Pass a data.frame containing several items composing one scale, get a
likert::likert() object, which you can plot.
Intelligently makes use of labels and value labels if present.
Examples
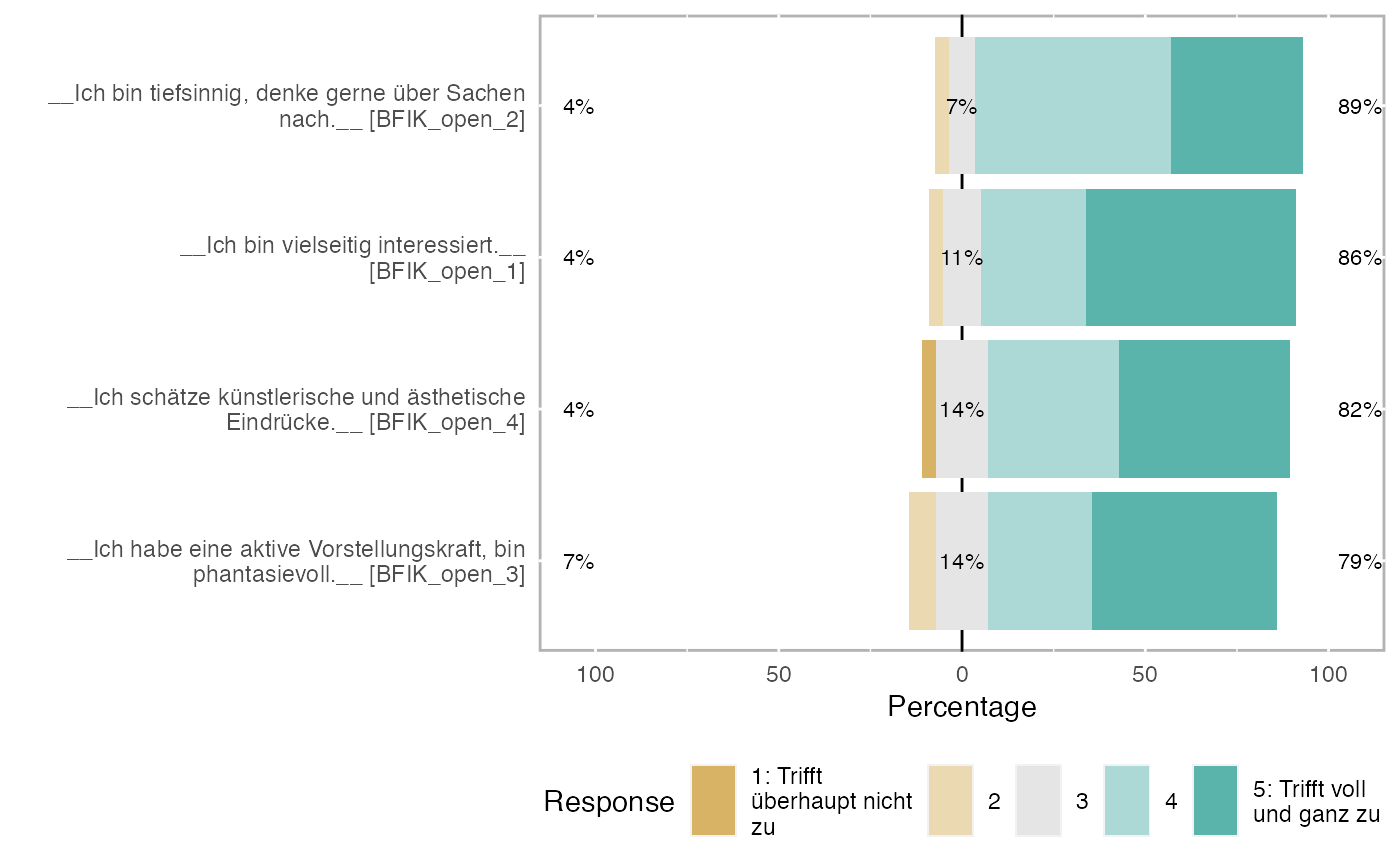
data("bfi", package = "codebook")
open_items <- paste0("BFIK_open_",1:4)
graphics::plot(likert_from_items(bfi[, open_items]))
#> Warning: The `size` argument of `element_rect()` is deprecated as of ggplot2 3.4.0.
#> ℹ Please use the `linewidth` argument instead.
#> ℹ The deprecated feature was likely used in the likert package.
#>   Please report the issue at <https://github.com/jbryer/likert/issues>.