Codebook
knitr::opts_chunk$set(
  warning = FALSE, # show warnings during codebook generation
  message = FALSE, # show messages during codebook generation
  error = TRUE, # do not interrupt codebook generation in case of errors,
                # usually better for debugging
  echo = TRUE  # show R code
)
ggplot2::theme_set(ggplot2::theme_bw())
pander::panderOptions("table.split.table", Inf)
knit_by_pkgdown <- !is.null(knitr::opts_chunk$get("fig.retina"))
pander::panderOptions("table.split.table", Inf)
ggplot2::theme_set(ggplot2::theme_bw())
knitr::opts_chunk$set(warning = TRUE, message = TRUE, error = TRUE, echo = TRUE)
ptsd <- rio::import("https://osf.io/uv7fm/download", "sav")codebook_data <- ptsd
#
# var_label(codebook_data) <- dict %>% select(Variable, Label) %>% dict_to_list()
# omit the following lines, if your missing values are already properly labelled
codebook_data <- detect_missing(codebook_data,
only_labelled = TRUE, # only labelled values are autodetected as
# missing
negative_values_are_missing = FALSE, # negative values are missing values
ninety_nine_problems = TRUE, # 99/999 are missing values, if they
# are more than 5 MAD from the median
)
# If you are not using formr, the codebook package needs to guess which items
# form a scale. The following line finds item aggregates with names like this:
# scale = scale_1 + scale_2R + scale_3R
# identifying these aggregates allows the codebook function to
# automatically compute reliabilities.
# However, it will not reverse items automatically.
codebook_data <- detect_scales(codebook_data)metadata(codebook_data)$name <- "
Current Posttraumatic Stress Disorder symptomatology distorts memory for past symptoms
"
metadata(codebook_data)$description <- paste0("
### Download link
[Open Science Framework]https://osf.io/uv7fm/download)
")
metadata(codebook_data)$identifier <- "https://osf.io/bdax7/"
metadata(codebook_data)$datePublished <- "2018-05-04"
metadata(codebook_data)$contributors <- list(
" Sasha Nahleen"," Reginald Nixon ", "Melanie Takarangi")
metadata(codebook_data)$url <- "https://osf.io/uv7fm/"
metadata(codebook_data)$temporalCoverage <- "2018"
metadata(codebook_data)$distribution = list(
list("@type" = "DataDownload",
"requiresSubscription" = "http://schema.org/True",
"encodingFormat" = "https://www.loc.gov/preservation/digital/formats/fdd/fdd000469.shtml",
contentUrl = "https://osf.io/uv7fm/download")
)codebook(codebook_data)knitr::asis_output(data_info)Metadata
Description
if (exists("name", meta)) {
  glue::glue(
    "__Dataset name__: {name}",
    .envir = meta)
}
Dataset name: Current Posttraumatic Stress Disorder symptomatology distorts memory for past symptoms
cat(description)Download link
[Open Science Framework]https://osf.io/uv7fm/download)
Temporal Coverage: 2018
- URL: https://osf.io/uv7fm/
- Identifier: https://osf.io/bdax7/
Date published: 2018-05-04
meta <- meta[setdiff(names(meta),
                     c("creator", "datePublished", "identifier",
                       "url", "citation", "spatialCoverage",
                       "temporalCoverage", "description", "name"))]
pander::pander(meta)contributors:
- Sasha Nahleen
- Reginald Nixon
- Melanie Takarangi
distribution:
   * **@type**: DataDownload
   * **requiresSubscription**: http://schema.org/True
   * **encodingFormat**: https://www.loc.gov/preservation/digital/formats/fdd/fdd000469.shtml
   * **contentUrl**: https://osf.io/uv7fm/download
keywords: MturkID, Age, Ethnicity, EthnicityCoded, PCL_TotalScore_T1, PCL_ReexperiencingSubscale_T1, PCL_AvoidanceSubscale_T1, PCL_MoodandCognitionSubscale_T1, PCL_HyperarousalSubscale_T1, PCL_TotalScore_RecallofT1, PCL_ReexperiencingSubscale_RecallofT1, PCL_AvoidanceSubscale_RecallofT1, PCL_MoodandCognitionSubscale_RecallofT1, PCL_HyperarousalSubscale_RecallofT1, PCL_TotalScore_T2, PCL_ReexperiencingSubscale_T2, PCL_AvoidanceSubscale_T2, PCL_MoodandCognitionSubscale_T2, PCL_HyperarousalSubscale_T2, PTSDpositive_T2, MemoryDiscrepancy, ReliableChangeOverTime and ReliableChangeOverTime_AND_BelowPCLCutoff
knitr::asis_output(survey_overview)Variables
knitr::asis_output(paste0(scales_items, sep = "\n\n\n", collapse = "\n\n\n"))MturkID
Distribution
show_missing_values <- FALSE
if (has_labels(item)) {
  missing_values <- item[is.na(haven::zap_missing(item))]
  attributes(missing_values) <- attributes(item)
  if (!is.null(attributes(item)$labels)) {
    attributes(missing_values)$labels <- attributes(missing_values)$labels[is.na(attributes(missing_values)$labels)]
    attributes(item)$labels <- attributes(item)$labels[!is.na(attributes(item)$labels)]
  }
  if (is.double(item)) {
    show_missing_values <- length(unique(haven::na_tag(missing_values))) > 1
    item <- haven::zap_missing(item)
  }
  if (length(item_attributes$labels) == 0 && is.numeric(item)) {
    item <- haven::zap_labels(item)
  }
}
item_nomiss <- item[!is.na(item)]

# unnest mc_multiple and so on
if (
  is.character(item_nomiss) &&
  stringr::str_detect(item_nomiss, stringr::fixed(", ")) &&
  (exists("type", item_info) &&
    stringr::str_detect(item_info$type, pattern = stringr::fixed("multiple")))
  ) {
  item_nomiss <- unlist(stringr::str_split(item_nomiss, pattern = stringr::fixed(", ")))
}
attributes(item_nomiss) <- attributes(item)

old_height <- knitr::opts_chunk$get("fig.height")
non_missing_choices <- item_attributes[["labels"]]
many_labels <- length(non_missing_choices) > 7
go_vertical <- !is.numeric(item_nomiss) || many_labels
if ( go_vertical ) {
  # numeric items are plotted horizontally (because that's what usually expected)
  # categorical items are plotted vertically because we can use the screen real estate better this way

    if (is.null(choices) ||
        dplyr::n_distinct(item_nomiss) > length(non_missing_choices)) {
        non_missing_choices <- unique(item_nomiss)
        names(non_missing_choices) <- non_missing_choices
    }
  choice_multiplier <- old_height/6.5
    new_height <- 2 + choice_multiplier * length(non_missing_choices)
    new_height <- ifelse(new_height > 20, 20, new_height)
    new_height <- ifelse(new_height < 1, 1, new_height)
    knitr::opts_chunk$set(fig.height = new_height)
}

wrap_at <- knitr::opts_chunk$get("fig.width") * 10
# todo: if there are free-text choices mingled in with the pre-defined ones, don't show
# todo: show rare items if they are pre-defined
# todo: bin rare responses into "other category"
if (!length(item_nomiss)) {
cat("No non-missing values to show.")
} else if (is.numeric(item_nomiss) || dplyr::n_distinct(item_nomiss) < 20) {
plot_labelled(item_nomiss, item_name, wrap_at, go_vertical)
} else {
cat(dplyr::n_distinct(item_nomiss), " unique, categorical values, so not shown.")
}## 405 unique, categorical values, so not shown.knitr::opts_chunk$set(fig.height = old_height)0 missing values.
Summary statistics
attributes(item) <- item_attributes
df = data.frame(item, stringsAsFactors = FALSE)
names(df) = html_item_name
escaped_table(codebook_table(df))| name | data_type | missing | complete | n | empty | n_unique | min | max | format.spss | display_width |
|---|---|---|---|---|---|---|---|---|---|---|
| MturkID | character | 0 | 410 | 410 | 0 | 405 | 12 | 21 | A21 | 18 |
if (show_missing_values) {
  plot_labelled(missing_values, item_name, wrap_at)
}
if (!is.null(item_info)) {
# don't show choices again, if they're basically same thing as value labels
if (!is.null(choices) && !is.null(item_info$choices) &&
all(names(na.omit(choices)) == item_info$choices) &&
all(na.omit(choices) == names(item_info$choices))) {
item_info$choices <- NULL
}
item_info$label_parsed <-
item_info$choice_list <- item_info$study_id <- item_info$id <- NULL
pander::pander(item_info)
}if (!is.null(choices) && length(choices) && length(choices) < 30) {
pander::pander(as.list(choices))
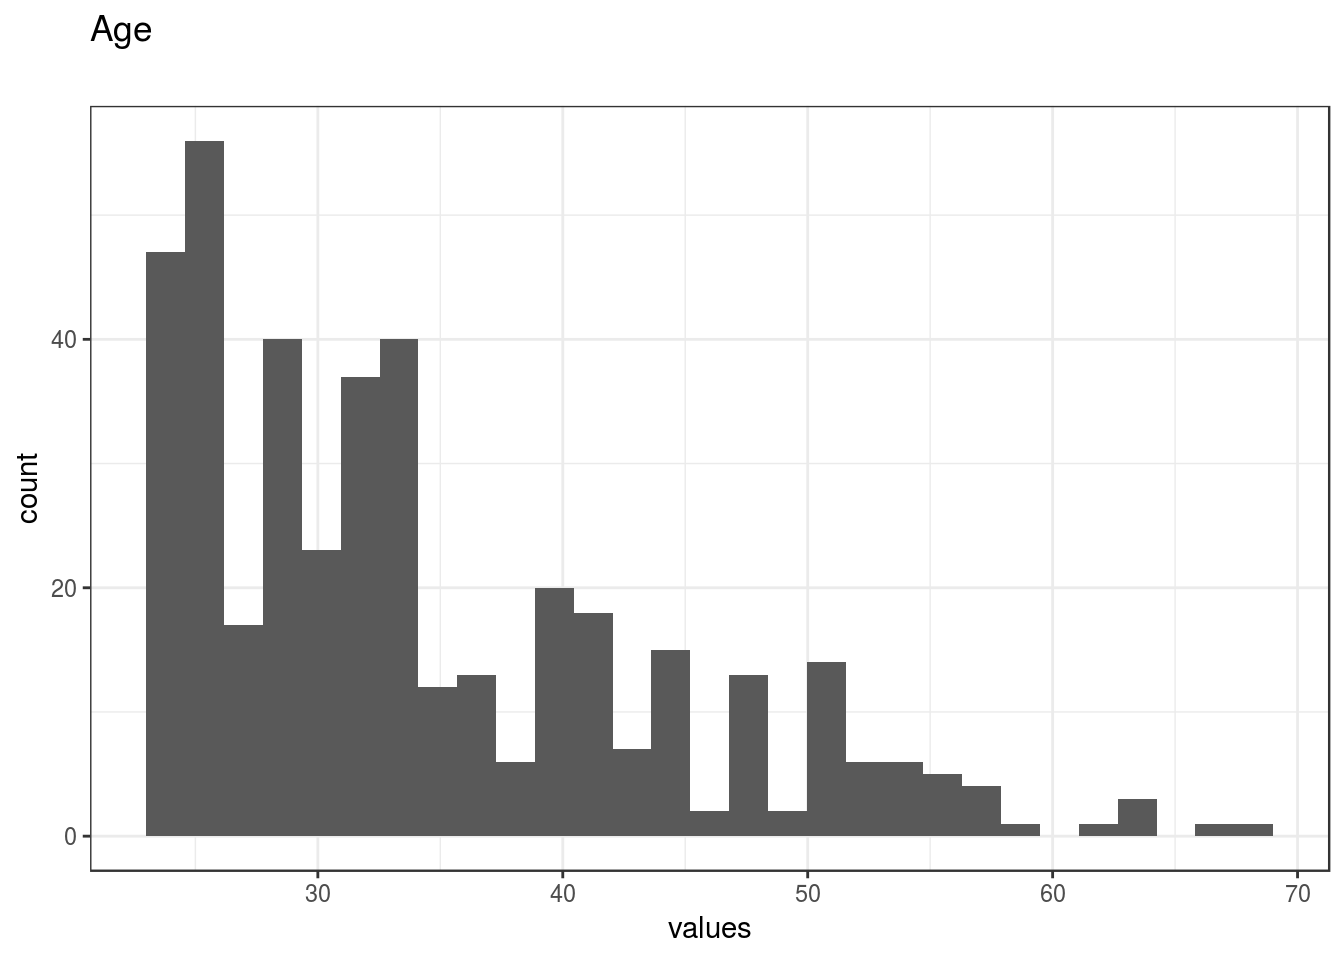
}Age
Distribution
show_missing_values <- FALSE
if (has_labels(item)) {
missing_values <- item[is.na(haven::zap_missing(item))]
attributes(missing_values) <- attributes(item)
if (!is.null(attributes(item)$labels)) {
attributes(missing_values)$labels <- attributes(missing_values)$labels[is.na(attributes(missing_values)$labels)]
attributes(item)$labels <- attributes(item)$labels[!is.na(attributes(item)$labels)]
}
if (is.double(item)) {
show_missing_values <- length(unique(haven::na_tag(missing_values))) > 1
item <- haven::zap_missing(item)
}
if (length(item_attributes$labels) == 0 && is.numeric(item)) {
item <- haven::zap_labels(item)
}
}
item_nomiss <- item[!is.na(item)]
# unnest mc_multiple and so on
if (
is.character(item_nomiss) &&
stringr::str_detect(item_nomiss, stringr::fixed(", ")) &&
(exists("type", item_info) &&
stringr::str_detect(item_info$type, pattern = stringr::fixed("multiple")))
) {
item_nomiss <- unlist(stringr::str_split(item_nomiss, pattern = stringr::fixed(", ")))
}
attributes(item_nomiss) <- attributes(item)
old_height <- knitr::opts_chunk$get("fig.height")
non_missing_choices <- item_attributes[["labels"]]
many_labels <- length(non_missing_choices) > 7
go_vertical <- !is.numeric(item_nomiss) || many_labels
if ( go_vertical ) {
# numeric items are plotted horizontally (because that's what usually expected)
# categorical items are plotted vertically because we can use the screen real estate better this way
if (is.null(choices) ||
dplyr::n_distinct(item_nomiss) > length(non_missing_choices)) {
non_missing_choices <- unique(item_nomiss)
names(non_missing_choices) <- non_missing_choices
}
choice_multiplier <- old_height/6.5
new_height <- 2 + choice_multiplier * length(non_missing_choices)
new_height <- ifelse(new_height > 20, 20, new_height)
new_height <- ifelse(new_height < 1, 1, new_height)
knitr::opts_chunk$set(fig.height = new_height)
}
wrap_at <- knitr::opts_chunk$get("fig.width") * 10# todo: if there are free-text choices mingled in with the pre-defined ones, don't show
# todo: show rare items if they are pre-defined
# todo: bin rare responses into "other category"
if (!length(item_nomiss)) {
cat("No non-missing values to show.")
} else if (is.numeric(item_nomiss) || dplyr::n_distinct(item_nomiss) < 20) {
plot_labelled(item_nomiss, item_name, wrap_at, go_vertical)
} else {
cat(dplyr::n_distinct(item_nomiss), " unique, categorical values, so not shown.")
}
knitr::opts_chunk$set(fig.height = old_height)0 missing values.
Summary statistics
attributes(item) <- item_attributes
df = data.frame(item, stringsAsFactors = FALSE)
names(df) = html_item_name
escaped_table(codebook_table(df))| name | data_type | missing | complete | n | mean | sd | p0 | p25 | p50 | p75 | p100 | hist | format.spss | display_width |
|---|---|---|---|---|---|---|---|---|---|---|---|---|---|---|
| Age | numeric | 0 | 410 | 410 | 34.27 | 9.67 | 23 | 26.25 | 32 | 40 | 69 | ▇▆▃▂▂▁▁▁ | F11.1 | 5 |
if (show_missing_values) {
plot_labelled(missing_values, item_name, wrap_at)
}if (!is.null(item_info)) {
# don't show choices again, if they're basically same thing as value labels
if (!is.null(choices) && !is.null(item_info$choices) &&
all(names(na.omit(choices)) == item_info$choices) &&
all(na.omit(choices) == names(item_info$choices))) {
item_info$choices <- NULL
}
item_info$label_parsed <-
item_info$choice_list <- item_info$study_id <- item_info$id <- NULL
pander::pander(item_info)
}if (!is.null(choices) && length(choices) && length(choices) < 30) {
pander::pander(as.list(choices))
}Ethnicity
Distribution
show_missing_values <- FALSE
if (has_labels(item)) {
missing_values <- item[is.na(haven::zap_missing(item))]
attributes(missing_values) <- attributes(item)
if (!is.null(attributes(item)$labels)) {
attributes(missing_values)$labels <- attributes(missing_values)$labels[is.na(attributes(missing_values)$labels)]
attributes(item)$labels <- attributes(item)$labels[!is.na(attributes(item)$labels)]
}
if (is.double(item)) {
show_missing_values <- length(unique(haven::na_tag(missing_values))) > 1
item <- haven::zap_missing(item)
}
if (length(item_attributes$labels) == 0 && is.numeric(item)) {
item <- haven::zap_labels(item)
}
}
item_nomiss <- item[!is.na(item)]
# unnest mc_multiple and so on
if (
is.character(item_nomiss) &&
stringr::str_detect(item_nomiss, stringr::fixed(", ")) &&
(exists("type", item_info) &&
stringr::str_detect(item_info$type, pattern = stringr::fixed("multiple")))
) {
item_nomiss <- unlist(stringr::str_split(item_nomiss, pattern = stringr::fixed(", ")))
}
attributes(item_nomiss) <- attributes(item)
old_height <- knitr::opts_chunk$get("fig.height")
non_missing_choices <- item_attributes[["labels"]]
many_labels <- length(non_missing_choices) > 7
go_vertical <- !is.numeric(item_nomiss) || many_labels
if ( go_vertical ) {
# numeric items are plotted horizontally (because that's what usually expected)
# categorical items are plotted vertically because we can use the screen real estate better this way
if (is.null(choices) ||
dplyr::n_distinct(item_nomiss) > length(non_missing_choices)) {
non_missing_choices <- unique(item_nomiss)
names(non_missing_choices) <- non_missing_choices
}
choice_multiplier <- old_height/6.5
new_height <- 2 + choice_multiplier * length(non_missing_choices)
new_height <- ifelse(new_height > 20, 20, new_height)
new_height <- ifelse(new_height < 1, 1, new_height)
knitr::opts_chunk$set(fig.height = new_height)
}
wrap_at <- knitr::opts_chunk$get("fig.width") * 10# todo: if there are free-text choices mingled in with the pre-defined ones, don't show
# todo: show rare items if they are pre-defined
# todo: bin rare responses into "other category"
if (!length(item_nomiss)) {
cat("No non-missing values to show.")
} else if (is.numeric(item_nomiss) || dplyr::n_distinct(item_nomiss) < 20) {
plot_labelled(item_nomiss, item_name, wrap_at, go_vertical)
} else {
cat(dplyr::n_distinct(item_nomiss), " unique, categorical values, so not shown.")
}## 87 unique, categorical values, so not shown.knitr::opts_chunk$set(fig.height = old_height)0 missing values.
Summary statistics
attributes(item) <- item_attributes
df = data.frame(item, stringsAsFactors = FALSE)
names(df) = html_item_name
escaped_table(codebook_table(df))| name | data_type | missing | complete | n | empty | n_unique | min | max | format.spss | display_width |
|---|---|---|---|---|---|---|---|---|---|---|
| Ethnicity | character | 0 | 410 | 410 | 0 | 87 | 5 | 91 | A91 | 22 |
if (show_missing_values) {
plot_labelled(missing_values, item_name, wrap_at)
}if (!is.null(item_info)) {
# don't show choices again, if they're basically same thing as value labels
if (!is.null(choices) && !is.null(item_info$choices) &&
all(names(na.omit(choices)) == item_info$choices) &&
all(na.omit(choices) == names(item_info$choices))) {
item_info$choices <- NULL
}
item_info$label_parsed <-
item_info$choice_list <- item_info$study_id <- item_info$id <- NULL
pander::pander(item_info)
}if (!is.null(choices) && length(choices) && length(choices) < 30) {
pander::pander(as.list(choices))
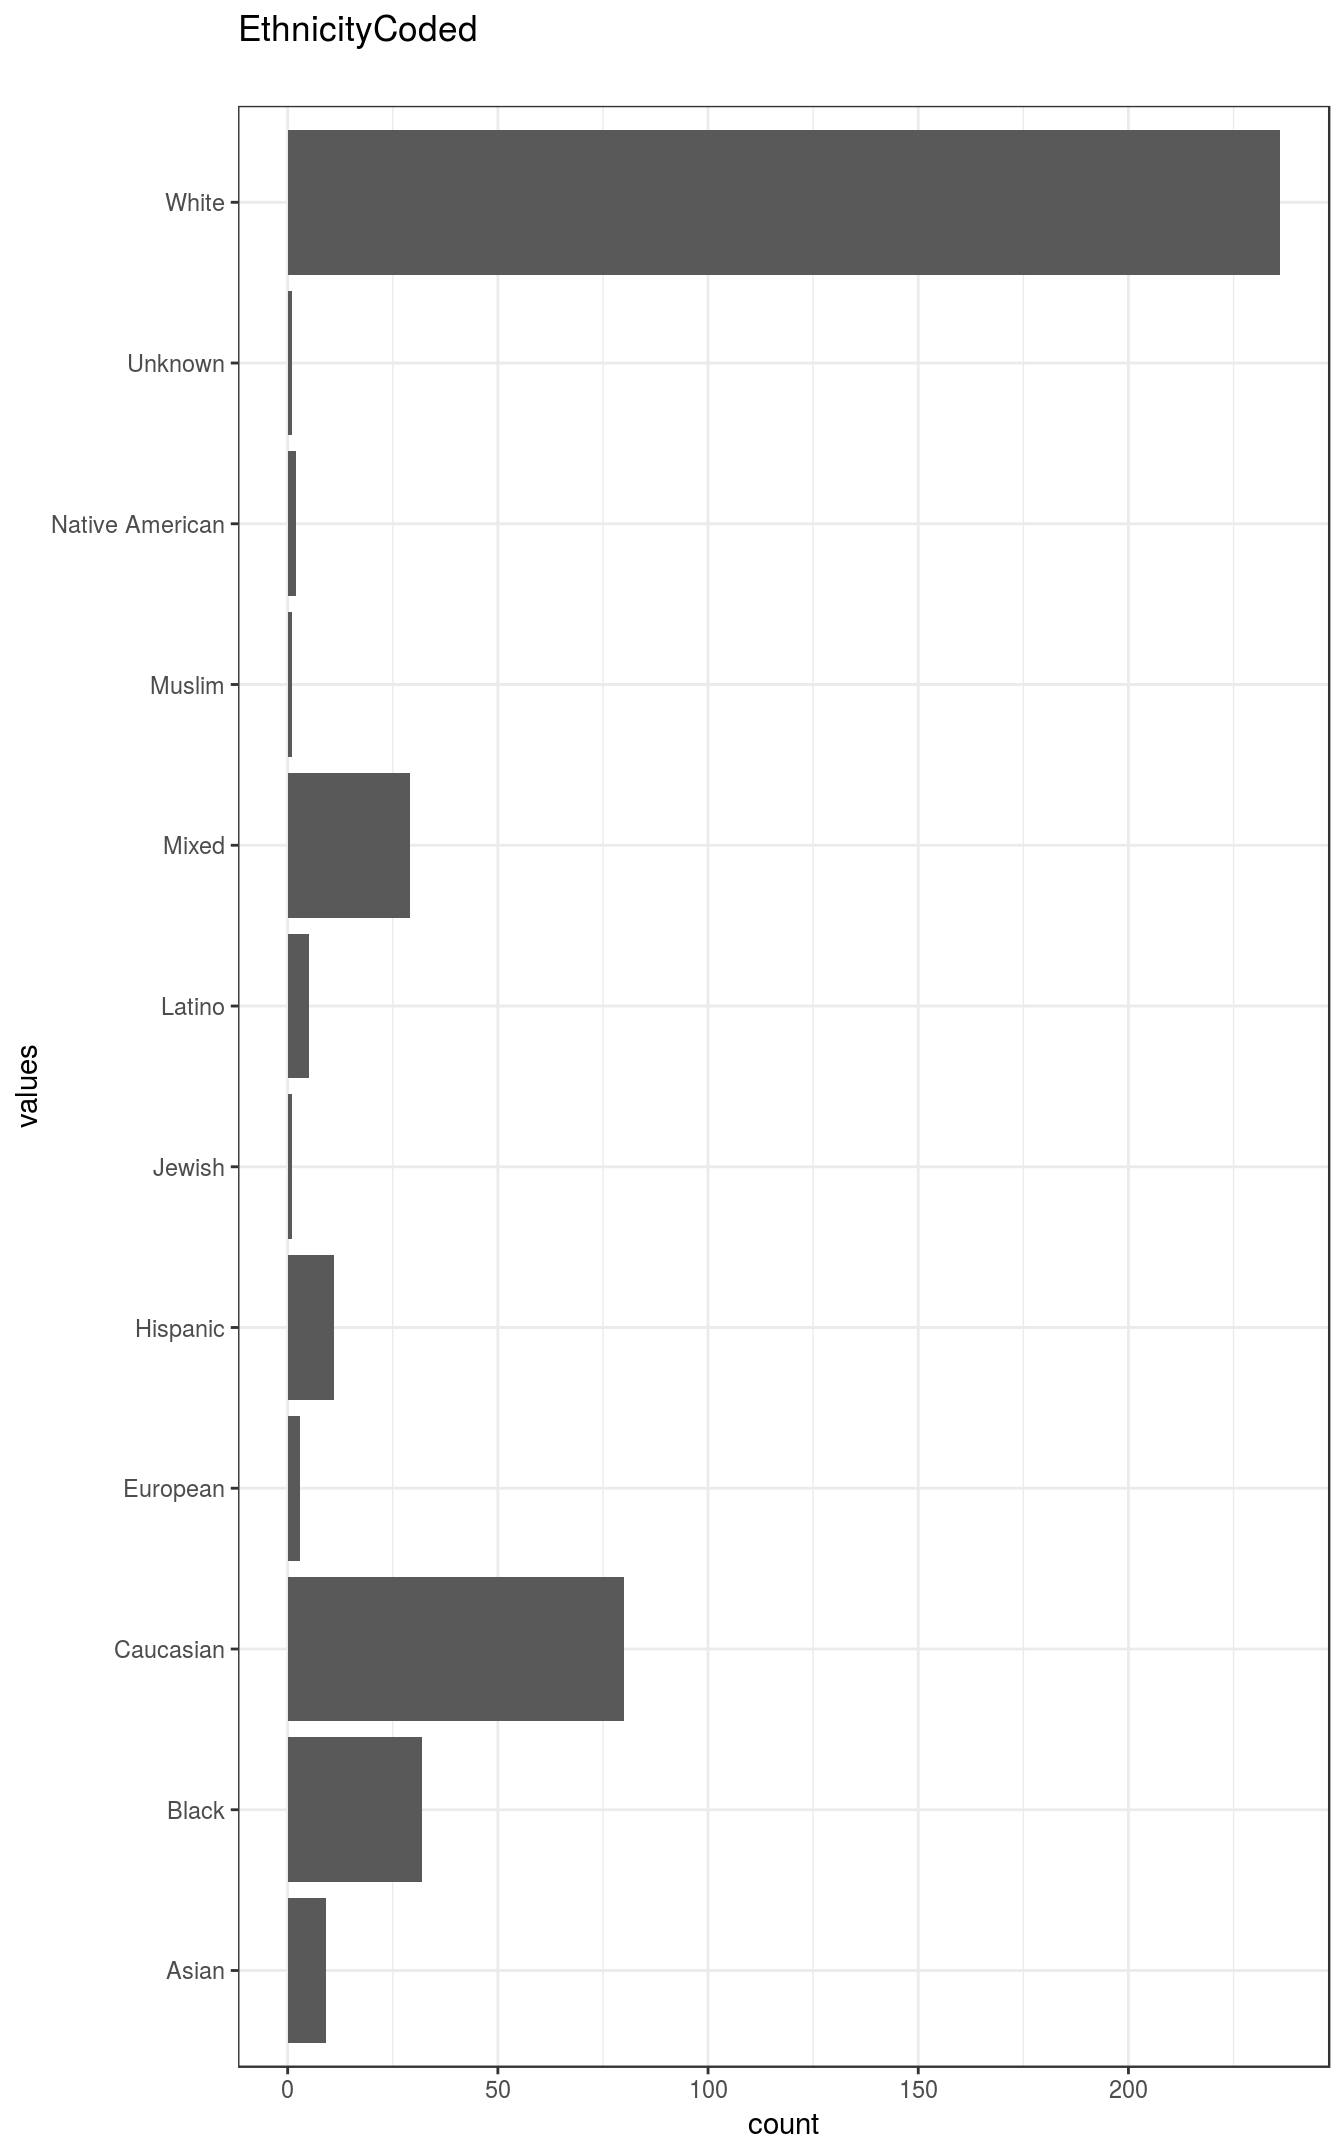
}EthnicityCoded
Distribution
show_missing_values <- FALSE
if (has_labels(item)) {
missing_values <- item[is.na(haven::zap_missing(item))]
attributes(missing_values) <- attributes(item)
if (!is.null(attributes(item)$labels)) {
attributes(missing_values)$labels <- attributes(missing_values)$labels[is.na(attributes(missing_values)$labels)]
attributes(item)$labels <- attributes(item)$labels[!is.na(attributes(item)$labels)]
}
if (is.double(item)) {
show_missing_values <- length(unique(haven::na_tag(missing_values))) > 1
item <- haven::zap_missing(item)
}
if (length(item_attributes$labels) == 0 && is.numeric(item)) {
item <- haven::zap_labels(item)
}
}
item_nomiss <- item[!is.na(item)]
# unnest mc_multiple and so on
if (
is.character(item_nomiss) &&
stringr::str_detect(item_nomiss, stringr::fixed(", ")) &&
(exists("type", item_info) &&
stringr::str_detect(item_info$type, pattern = stringr::fixed("multiple")))
) {
item_nomiss <- unlist(stringr::str_split(item_nomiss, pattern = stringr::fixed(", ")))
}
attributes(item_nomiss) <- attributes(item)
old_height <- knitr::opts_chunk$get("fig.height")
non_missing_choices <- item_attributes[["labels"]]
many_labels <- length(non_missing_choices) > 7
go_vertical <- !is.numeric(item_nomiss) || many_labels
if ( go_vertical ) {
# numeric items are plotted horizontally (because that's what usually expected)
# categorical items are plotted vertically because we can use the screen real estate better this way
if (is.null(choices) ||
dplyr::n_distinct(item_nomiss) > length(non_missing_choices)) {
non_missing_choices <- unique(item_nomiss)
names(non_missing_choices) <- non_missing_choices
}
choice_multiplier <- old_height/6.5
new_height <- 2 + choice_multiplier * length(non_missing_choices)
new_height <- ifelse(new_height > 20, 20, new_height)
new_height <- ifelse(new_height < 1, 1, new_height)
knitr::opts_chunk$set(fig.height = new_height)
}
wrap_at <- knitr::opts_chunk$get("fig.width") * 10# todo: if there are free-text choices mingled in with the pre-defined ones, don't show
# todo: show rare items if they are pre-defined
# todo: bin rare responses into "other category"
if (!length(item_nomiss)) {
cat("No non-missing values to show.")
} else if (is.numeric(item_nomiss) || dplyr::n_distinct(item_nomiss) < 20) {
plot_labelled(item_nomiss, item_name, wrap_at, go_vertical)
} else {
cat(dplyr::n_distinct(item_nomiss), " unique, categorical values, so not shown.")
}
knitr::opts_chunk$set(fig.height = old_height)0 missing values.
Summary statistics
attributes(item) <- item_attributes
df = data.frame(item, stringsAsFactors = FALSE)
names(df) = html_item_name
escaped_table(codebook_table(df))| name | data_type | missing | complete | n | empty | n_unique | min | max | format.spss |
|---|---|---|---|---|---|---|---|---|---|
| EthnicityCoded | character | 0 | 410 | 410 | 0 | 12 | 5 | 15 | A18 |
if (show_missing_values) {
plot_labelled(missing_values, item_name, wrap_at)
}if (!is.null(item_info)) {
# don't show choices again, if they're basically same thing as value labels
if (!is.null(choices) && !is.null(item_info$choices) &&
all(names(na.omit(choices)) == item_info$choices) &&
all(na.omit(choices) == names(item_info$choices))) {
item_info$choices <- NULL
}
item_info$label_parsed <-
item_info$choice_list <- item_info$study_id <- item_info$id <- NULL
pander::pander(item_info)
}if (!is.null(choices) && length(choices) && length(choices) < 30) {
pander::pander(as.list(choices))
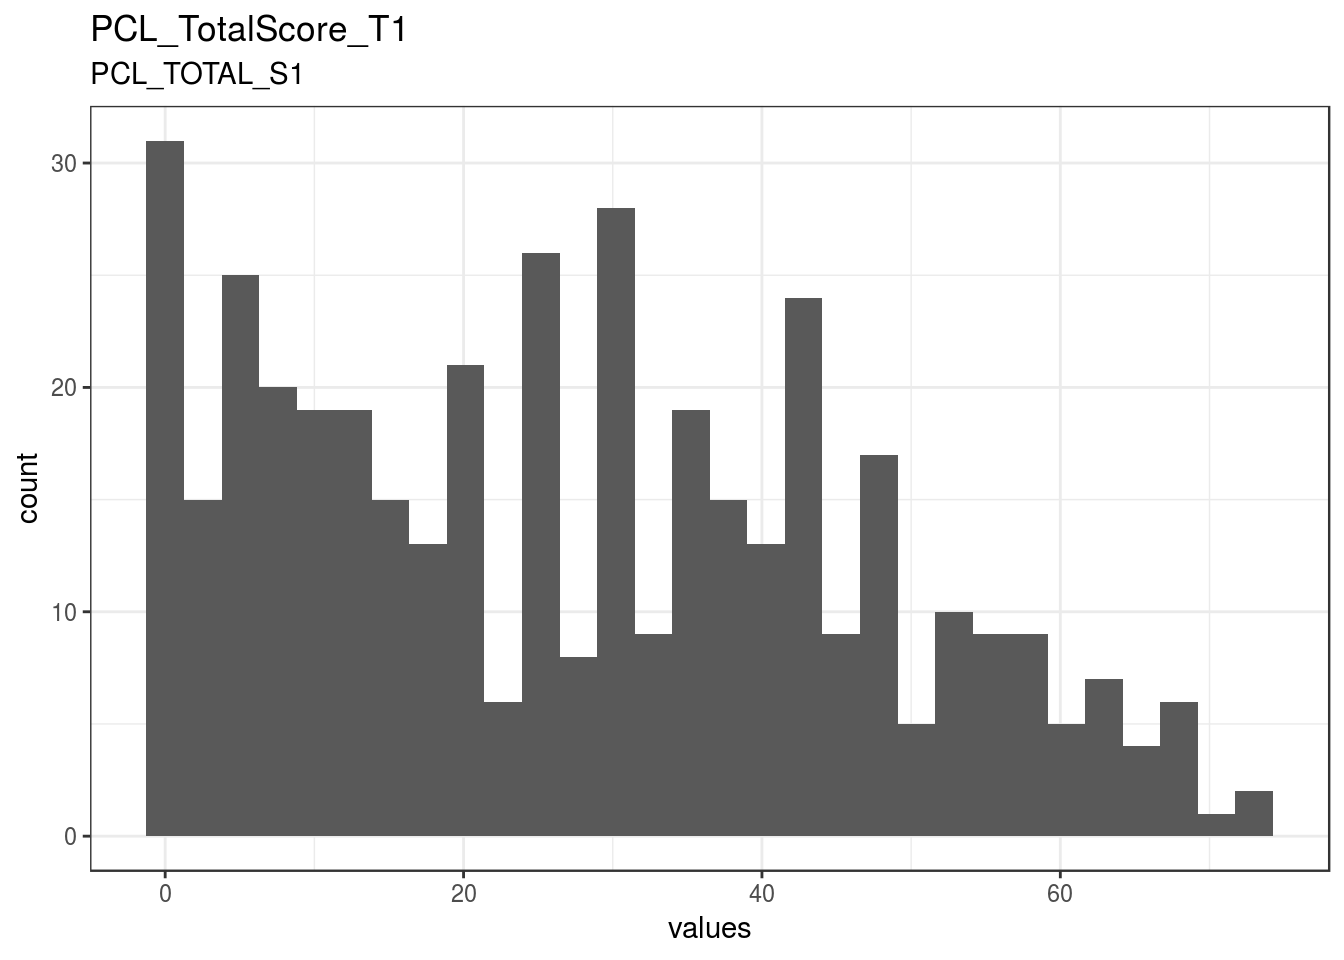
}PCL_TotalScore_T1
PCL_TOTAL_S1
Distribution
show_missing_values <- FALSE
if (has_labels(item)) {
missing_values <- item[is.na(haven::zap_missing(item))]
attributes(missing_values) <- attributes(item)
if (!is.null(attributes(item)$labels)) {
attributes(missing_values)$labels <- attributes(missing_values)$labels[is.na(attributes(missing_values)$labels)]
attributes(item)$labels <- attributes(item)$labels[!is.na(attributes(item)$labels)]
}
if (is.double(item)) {
show_missing_values <- length(unique(haven::na_tag(missing_values))) > 1
item <- haven::zap_missing(item)
}
if (length(item_attributes$labels) == 0 && is.numeric(item)) {
item <- haven::zap_labels(item)
}
}
item_nomiss <- item[!is.na(item)]
# unnest mc_multiple and so on
if (
is.character(item_nomiss) &&
stringr::str_detect(item_nomiss, stringr::fixed(", ")) &&
(exists("type", item_info) &&
stringr::str_detect(item_info$type, pattern = stringr::fixed("multiple")))
) {
item_nomiss <- unlist(stringr::str_split(item_nomiss, pattern = stringr::fixed(", ")))
}
attributes(item_nomiss) <- attributes(item)
old_height <- knitr::opts_chunk$get("fig.height")
non_missing_choices <- item_attributes[["labels"]]
many_labels <- length(non_missing_choices) > 7
go_vertical <- !is.numeric(item_nomiss) || many_labels
if ( go_vertical ) {
# numeric items are plotted horizontally (because that's what usually expected)
# categorical items are plotted vertically because we can use the screen real estate better this way
if (is.null(choices) ||
dplyr::n_distinct(item_nomiss) > length(non_missing_choices)) {
non_missing_choices <- unique(item_nomiss)
names(non_missing_choices) <- non_missing_choices
}
choice_multiplier <- old_height/6.5
new_height <- 2 + choice_multiplier * length(non_missing_choices)
new_height <- ifelse(new_height > 20, 20, new_height)
new_height <- ifelse(new_height < 1, 1, new_height)
knitr::opts_chunk$set(fig.height = new_height)
}
wrap_at <- knitr::opts_chunk$get("fig.width") * 10# todo: if there are free-text choices mingled in with the pre-defined ones, don't show
# todo: show rare items if they are pre-defined
# todo: bin rare responses into "other category"
if (!length(item_nomiss)) {
cat("No non-missing values to show.")
} else if (is.numeric(item_nomiss) || dplyr::n_distinct(item_nomiss) < 20) {
plot_labelled(item_nomiss, item_name, wrap_at, go_vertical)
} else {
cat(dplyr::n_distinct(item_nomiss), " unique, categorical values, so not shown.")
}
knitr::opts_chunk$set(fig.height = old_height)0 missing values.
Summary statistics
attributes(item) <- item_attributes
df = data.frame(item, stringsAsFactors = FALSE)
names(df) = html_item_name
escaped_table(codebook_table(df))| name | label | data_type | missing | complete | n | mean | sd | p0 | p25 | p50 | p75 | p100 | hist | format.spss | display_width |
|---|---|---|---|---|---|---|---|---|---|---|---|---|---|---|---|
| PCL_TotalScore_T1 | PCL_TOTAL_S1 | numeric | 0 | 410 | 410 | 27.38 | 19.1 | 0 | 10 | 26 | 42.75 | 73 | ▇▅▅▅▅▃▂▁ | F8.2 | 12 |
if (show_missing_values) {
plot_labelled(missing_values, item_name, wrap_at)
}if (!is.null(item_info)) {
# don't show choices again, if they're basically same thing as value labels
if (!is.null(choices) && !is.null(item_info$choices) &&
all(names(na.omit(choices)) == item_info$choices) &&
all(na.omit(choices) == names(item_info$choices))) {
item_info$choices <- NULL
}
item_info$label_parsed <-
item_info$choice_list <- item_info$study_id <- item_info$id <- NULL
pander::pander(item_info)
}if (!is.null(choices) && length(choices) && length(choices) < 30) {
pander::pander(as.list(choices))
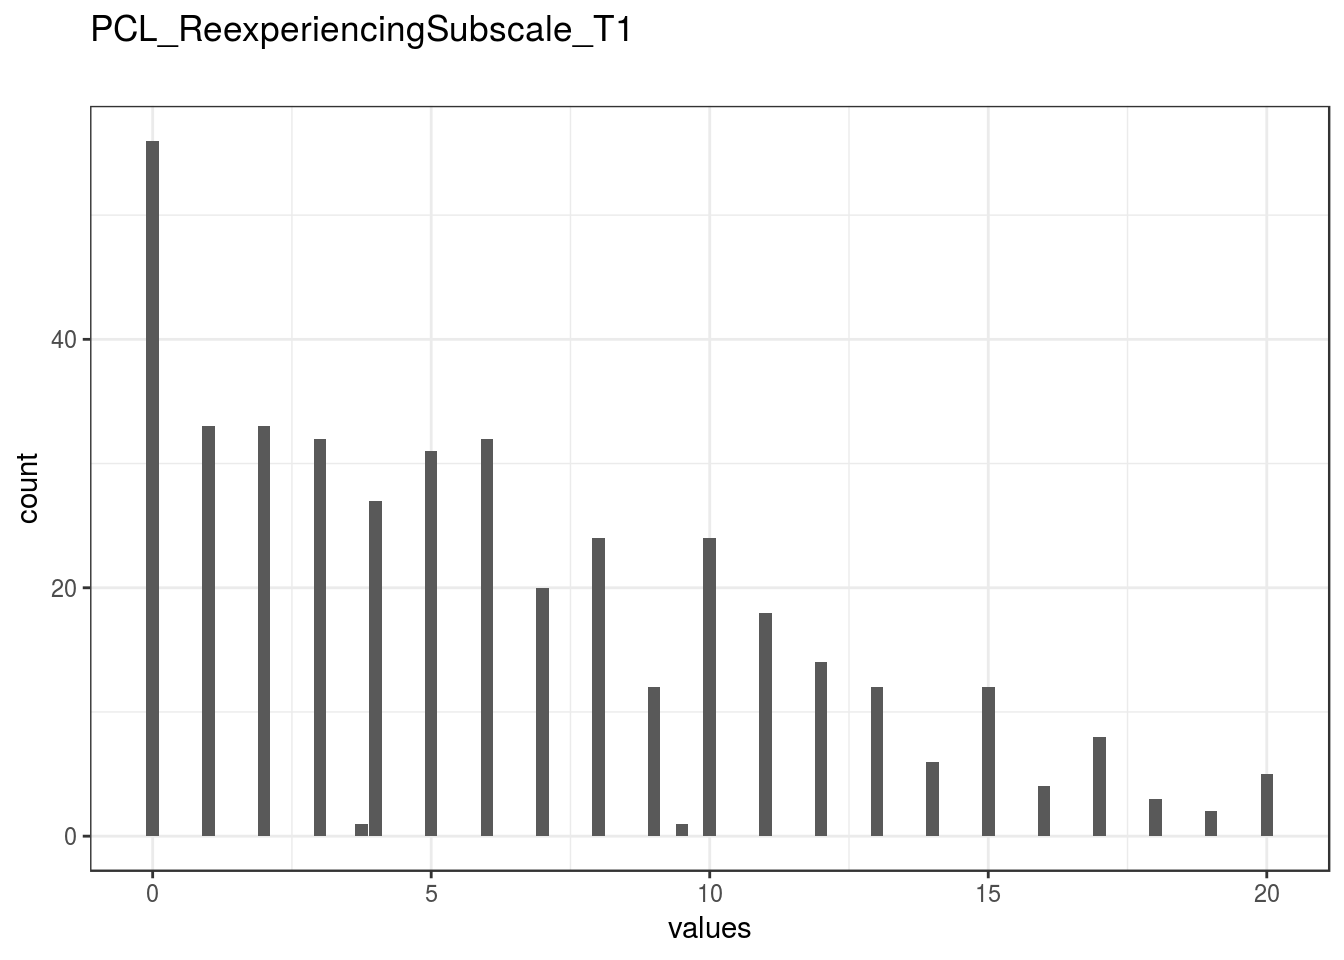
}PCL_ReexperiencingSubscale_T1
Distribution
show_missing_values <- FALSE
if (has_labels(item)) {
missing_values <- item[is.na(haven::zap_missing(item))]
attributes(missing_values) <- attributes(item)
if (!is.null(attributes(item)$labels)) {
attributes(missing_values)$labels <- attributes(missing_values)$labels[is.na(attributes(missing_values)$labels)]
attributes(item)$labels <- attributes(item)$labels[!is.na(attributes(item)$labels)]
}
if (is.double(item)) {
show_missing_values <- length(unique(haven::na_tag(missing_values))) > 1
item <- haven::zap_missing(item)
}
if (length(item_attributes$labels) == 0 && is.numeric(item)) {
item <- haven::zap_labels(item)
}
}
item_nomiss <- item[!is.na(item)]
# unnest mc_multiple and so on
if (
is.character(item_nomiss) &&
stringr::str_detect(item_nomiss, stringr::fixed(", ")) &&
(exists("type", item_info) &&
stringr::str_detect(item_info$type, pattern = stringr::fixed("multiple")))
) {
item_nomiss <- unlist(stringr::str_split(item_nomiss, pattern = stringr::fixed(", ")))
}
attributes(item_nomiss) <- attributes(item)
old_height <- knitr::opts_chunk$get("fig.height")
non_missing_choices <- item_attributes[["labels"]]
many_labels <- length(non_missing_choices) > 7
go_vertical <- !is.numeric(item_nomiss) || many_labels
if ( go_vertical ) {
# numeric items are plotted horizontally (because that's what usually expected)
# categorical items are plotted vertically because we can use the screen real estate better this way
if (is.null(choices) ||
dplyr::n_distinct(item_nomiss) > length(non_missing_choices)) {
non_missing_choices <- unique(item_nomiss)
names(non_missing_choices) <- non_missing_choices
}
choice_multiplier <- old_height/6.5
new_height <- 2 + choice_multiplier * length(non_missing_choices)
new_height <- ifelse(new_height > 20, 20, new_height)
new_height <- ifelse(new_height < 1, 1, new_height)
knitr::opts_chunk$set(fig.height = new_height)
}
wrap_at <- knitr::opts_chunk$get("fig.width") * 10# todo: if there are free-text choices mingled in with the pre-defined ones, don't show
# todo: show rare items if they are pre-defined
# todo: bin rare responses into "other category"
if (!length(item_nomiss)) {
cat("No non-missing values to show.")
} else if (is.numeric(item_nomiss) || dplyr::n_distinct(item_nomiss) < 20) {
plot_labelled(item_nomiss, item_name, wrap_at, go_vertical)
} else {
cat(dplyr::n_distinct(item_nomiss), " unique, categorical values, so not shown.")
}
knitr::opts_chunk$set(fig.height = old_height)0 missing values.
Summary statistics
attributes(item) <- item_attributes
df = data.frame(item, stringsAsFactors = FALSE)
names(df) = html_item_name
escaped_table(codebook_table(df))| name | data_type | missing | complete | n | mean | sd | p0 | p25 | p50 | p75 | p100 | hist | format.spss | display_width |
|---|---|---|---|---|---|---|---|---|---|---|---|---|---|---|
| PCL_ReexperiencingSubscale_T1 | numeric | 0 | 410 | 410 | 6.15 | 5.05 | 0 | 2 | 5 | 10 | 20 | ▇▆▃▃▂▂▁▁ | F8.2 | 15 |
if (show_missing_values) {
plot_labelled(missing_values, item_name, wrap_at)
}if (!is.null(item_info)) {
# don't show choices again, if they're basically same thing as value labels
if (!is.null(choices) && !is.null(item_info$choices) &&
all(names(na.omit(choices)) == item_info$choices) &&
all(na.omit(choices) == names(item_info$choices))) {
item_info$choices <- NULL
}
item_info$label_parsed <-
item_info$choice_list <- item_info$study_id <- item_info$id <- NULL
pander::pander(item_info)
}if (!is.null(choices) && length(choices) && length(choices) < 30) {
pander::pander(as.list(choices))
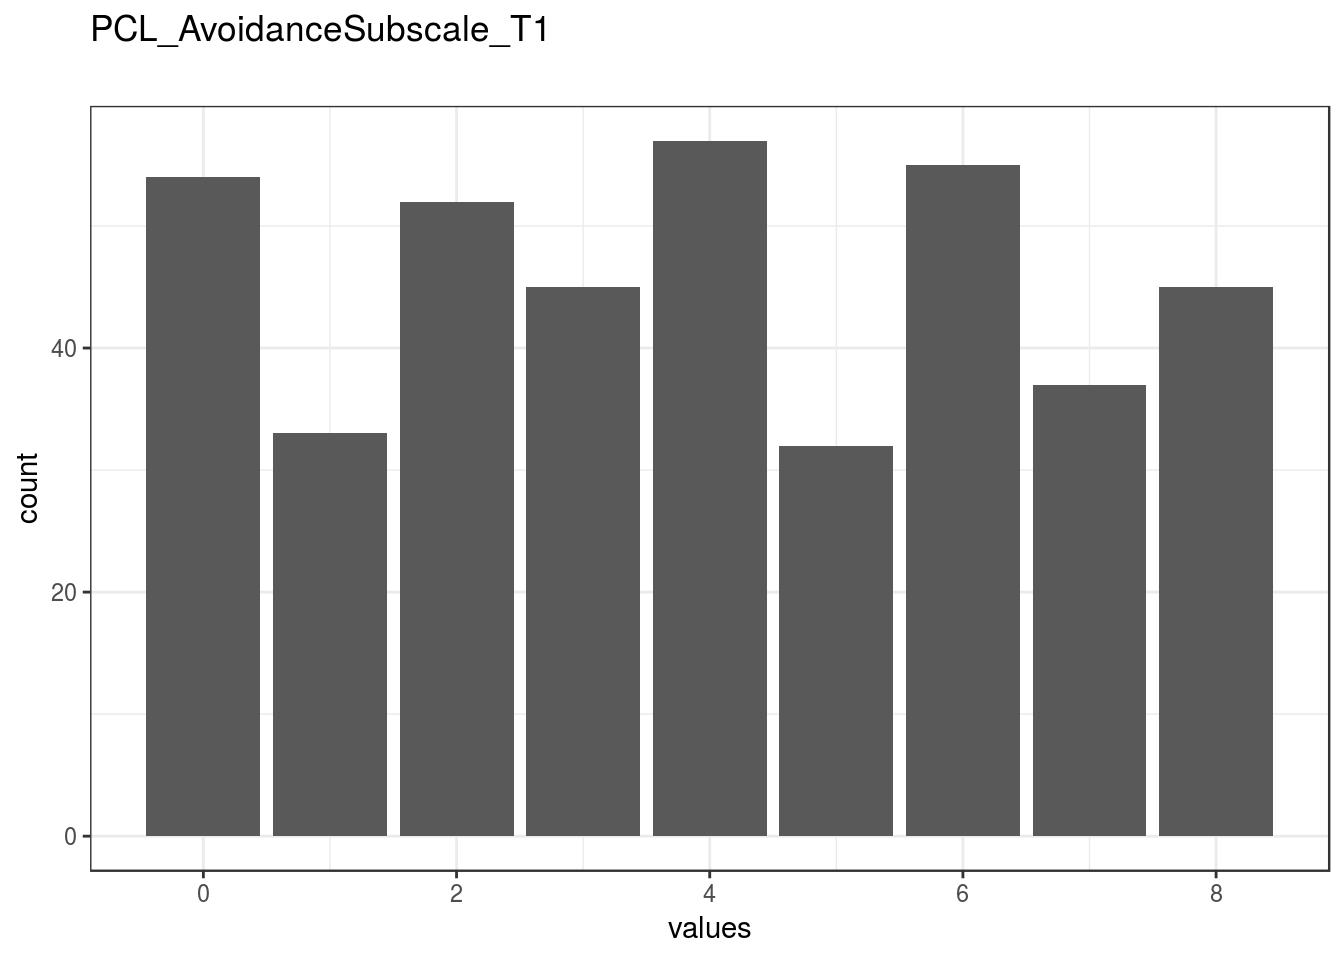
}PCL_AvoidanceSubscale_T1
Distribution
show_missing_values <- FALSE
if (has_labels(item)) {
missing_values <- item[is.na(haven::zap_missing(item))]
attributes(missing_values) <- attributes(item)
if (!is.null(attributes(item)$labels)) {
attributes(missing_values)$labels <- attributes(missing_values)$labels[is.na(attributes(missing_values)$labels)]
attributes(item)$labels <- attributes(item)$labels[!is.na(attributes(item)$labels)]
}
if (is.double(item)) {
show_missing_values <- length(unique(haven::na_tag(missing_values))) > 1
item <- haven::zap_missing(item)
}
if (length(item_attributes$labels) == 0 && is.numeric(item)) {
item <- haven::zap_labels(item)
}
}
item_nomiss <- item[!is.na(item)]
# unnest mc_multiple and so on
if (
is.character(item_nomiss) &&
stringr::str_detect(item_nomiss, stringr::fixed(", ")) &&
(exists("type", item_info) &&
stringr::str_detect(item_info$type, pattern = stringr::fixed("multiple")))
) {
item_nomiss <- unlist(stringr::str_split(item_nomiss, pattern = stringr::fixed(", ")))
}
attributes(item_nomiss) <- attributes(item)
old_height <- knitr::opts_chunk$get("fig.height")
non_missing_choices <- item_attributes[["labels"]]
many_labels <- length(non_missing_choices) > 7
go_vertical <- !is.numeric(item_nomiss) || many_labels
if ( go_vertical ) {
# numeric items are plotted horizontally (because that's what usually expected)
# categorical items are plotted vertically because we can use the screen real estate better this way
if (is.null(choices) ||
dplyr::n_distinct(item_nomiss) > length(non_missing_choices)) {
non_missing_choices <- unique(item_nomiss)
names(non_missing_choices) <- non_missing_choices
}
choice_multiplier <- old_height/6.5
new_height <- 2 + choice_multiplier * length(non_missing_choices)
new_height <- ifelse(new_height > 20, 20, new_height)
new_height <- ifelse(new_height < 1, 1, new_height)
knitr::opts_chunk$set(fig.height = new_height)
}
wrap_at <- knitr::opts_chunk$get("fig.width") * 10# todo: if there are free-text choices mingled in with the pre-defined ones, don't show
# todo: show rare items if they are pre-defined
# todo: bin rare responses into "other category"
if (!length(item_nomiss)) {
cat("No non-missing values to show.")
} else if (is.numeric(item_nomiss) || dplyr::n_distinct(item_nomiss) < 20) {
plot_labelled(item_nomiss, item_name, wrap_at, go_vertical)
} else {
cat(dplyr::n_distinct(item_nomiss), " unique, categorical values, so not shown.")
}
knitr::opts_chunk$set(fig.height = old_height)0 missing values.
Summary statistics
attributes(item) <- item_attributes
df = data.frame(item, stringsAsFactors = FALSE)
names(df) = html_item_name
escaped_table(codebook_table(df))| name | data_type | missing | complete | n | mean | sd | p0 | p25 | p50 | p75 | p100 | hist | format.spss | display_width |
|---|---|---|---|---|---|---|---|---|---|---|---|---|---|---|
| PCL_AvoidanceSubscale_T1 | numeric | 0 | 410 | 410 | 3.92 | 2.58 | 0 | 2 | 4 | 6 | 8 | ▇▅▅▅▃▅▃▅ | F8.2 | 12 |
if (show_missing_values) {
plot_labelled(missing_values, item_name, wrap_at)
}if (!is.null(item_info)) {
# don't show choices again, if they're basically same thing as value labels
if (!is.null(choices) && !is.null(item_info$choices) &&
all(names(na.omit(choices)) == item_info$choices) &&
all(na.omit(choices) == names(item_info$choices))) {
item_info$choices <- NULL
}
item_info$label_parsed <-
item_info$choice_list <- item_info$study_id <- item_info$id <- NULL
pander::pander(item_info)
}if (!is.null(choices) && length(choices) && length(choices) < 30) {
pander::pander(as.list(choices))
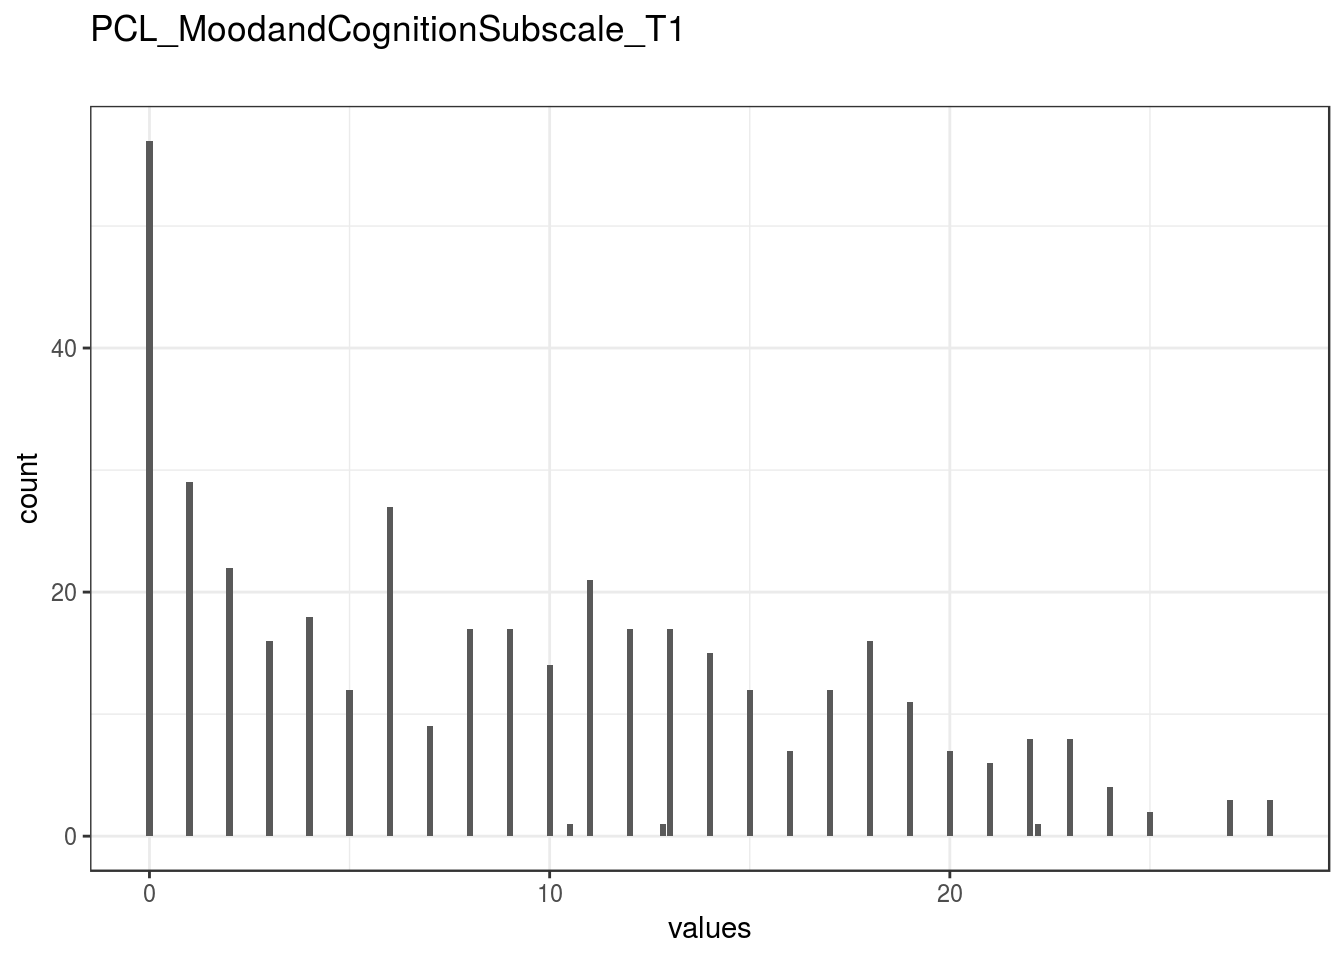
}PCL_MoodandCognitionSubscale_T1
Distribution
show_missing_values <- FALSE
if (has_labels(item)) {
missing_values <- item[is.na(haven::zap_missing(item))]
attributes(missing_values) <- attributes(item)
if (!is.null(attributes(item)$labels)) {
attributes(missing_values)$labels <- attributes(missing_values)$labels[is.na(attributes(missing_values)$labels)]
attributes(item)$labels <- attributes(item)$labels[!is.na(attributes(item)$labels)]
}
if (is.double(item)) {
show_missing_values <- length(unique(haven::na_tag(missing_values))) > 1
item <- haven::zap_missing(item)
}
if (length(item_attributes$labels) == 0 && is.numeric(item)) {
item <- haven::zap_labels(item)
}
}
item_nomiss <- item[!is.na(item)]
# unnest mc_multiple and so on
if (
is.character(item_nomiss) &&
stringr::str_detect(item_nomiss, stringr::fixed(", ")) &&
(exists("type", item_info) &&
stringr::str_detect(item_info$type, pattern = stringr::fixed("multiple")))
) {
item_nomiss <- unlist(stringr::str_split(item_nomiss, pattern = stringr::fixed(", ")))
}
attributes(item_nomiss) <- attributes(item)
old_height <- knitr::opts_chunk$get("fig.height")
non_missing_choices <- item_attributes[["labels"]]
many_labels <- length(non_missing_choices) > 7
go_vertical <- !is.numeric(item_nomiss) || many_labels
if ( go_vertical ) {
# numeric items are plotted horizontally (because that's what usually expected)
# categorical items are plotted vertically because we can use the screen real estate better this way
if (is.null(choices) ||
dplyr::n_distinct(item_nomiss) > length(non_missing_choices)) {
non_missing_choices <- unique(item_nomiss)
names(non_missing_choices) <- non_missing_choices
}
choice_multiplier <- old_height/6.5
new_height <- 2 + choice_multiplier * length(non_missing_choices)
new_height <- ifelse(new_height > 20, 20, new_height)
new_height <- ifelse(new_height < 1, 1, new_height)
knitr::opts_chunk$set(fig.height = new_height)
}
wrap_at <- knitr::opts_chunk$get("fig.width") * 10# todo: if there are free-text choices mingled in with the pre-defined ones, don't show
# todo: show rare items if they are pre-defined
# todo: bin rare responses into "other category"
if (!length(item_nomiss)) {
cat("No non-missing values to show.")
} else if (is.numeric(item_nomiss) || dplyr::n_distinct(item_nomiss) < 20) {
plot_labelled(item_nomiss, item_name, wrap_at, go_vertical)
} else {
cat(dplyr::n_distinct(item_nomiss), " unique, categorical values, so not shown.")
}
knitr::opts_chunk$set(fig.height = old_height)0 missing values.
Summary statistics
attributes(item) <- item_attributes
df = data.frame(item, stringsAsFactors = FALSE)
names(df) = html_item_name
escaped_table(codebook_table(df))| name | data_type | missing | complete | n | mean | sd | p0 | p25 | p50 | p75 | p100 | hist | format.spss | display_width |
|---|---|---|---|---|---|---|---|---|---|---|---|---|---|---|
| PCL_MoodandCognitionSubscale_T1 | numeric | 0 | 410 | 410 | 9.14 | 7.36 | 0 | 2 | 8 | 14 | 28 | ▇▅▃▅▂▂▂▁ | F8.2 | 17 |
if (show_missing_values) {
plot_labelled(missing_values, item_name, wrap_at)
}if (!is.null(item_info)) {
# don't show choices again, if they're basically same thing as value labels
if (!is.null(choices) && !is.null(item_info$choices) &&
all(names(na.omit(choices)) == item_info$choices) &&
all(na.omit(choices) == names(item_info$choices))) {
item_info$choices <- NULL
}
item_info$label_parsed <-
item_info$choice_list <- item_info$study_id <- item_info$id <- NULL
pander::pander(item_info)
}if (!is.null(choices) && length(choices) && length(choices) < 30) {
pander::pander(as.list(choices))
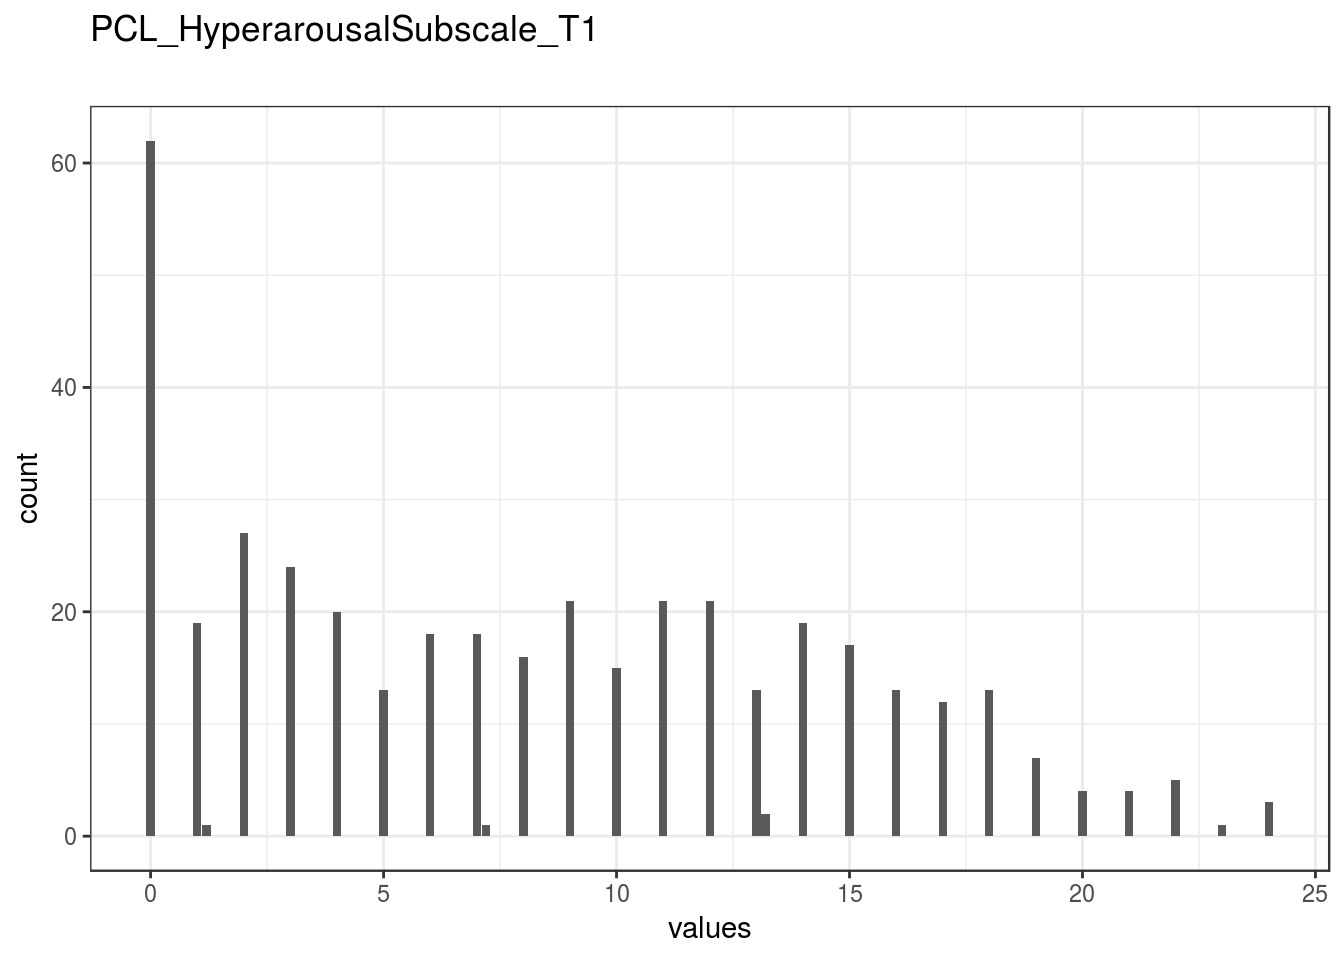
}PCL_HyperarousalSubscale_T1
Distribution
show_missing_values <- FALSE
if (has_labels(item)) {
missing_values <- item[is.na(haven::zap_missing(item))]
attributes(missing_values) <- attributes(item)
if (!is.null(attributes(item)$labels)) {
attributes(missing_values)$labels <- attributes(missing_values)$labels[is.na(attributes(missing_values)$labels)]
attributes(item)$labels <- attributes(item)$labels[!is.na(attributes(item)$labels)]
}
if (is.double(item)) {
show_missing_values <- length(unique(haven::na_tag(missing_values))) > 1
item <- haven::zap_missing(item)
}
if (length(item_attributes$labels) == 0 && is.numeric(item)) {
item <- haven::zap_labels(item)
}
}
item_nomiss <- item[!is.na(item)]
# unnest mc_multiple and so on
if (
is.character(item_nomiss) &&
stringr::str_detect(item_nomiss, stringr::fixed(", ")) &&
(exists("type", item_info) &&
stringr::str_detect(item_info$type, pattern = stringr::fixed("multiple")))
) {
item_nomiss <- unlist(stringr::str_split(item_nomiss, pattern = stringr::fixed(", ")))
}
attributes(item_nomiss) <- attributes(item)
old_height <- knitr::opts_chunk$get("fig.height")
non_missing_choices <- item_attributes[["labels"]]
many_labels <- length(non_missing_choices) > 7
go_vertical <- !is.numeric(item_nomiss) || many_labels
if ( go_vertical ) {
# numeric items are plotted horizontally (because that's what usually expected)
# categorical items are plotted vertically because we can use the screen real estate better this way
if (is.null(choices) ||
dplyr::n_distinct(item_nomiss) > length(non_missing_choices)) {
non_missing_choices <- unique(item_nomiss)
names(non_missing_choices) <- non_missing_choices
}
choice_multiplier <- old_height/6.5
new_height <- 2 + choice_multiplier * length(non_missing_choices)
new_height <- ifelse(new_height > 20, 20, new_height)
new_height <- ifelse(new_height < 1, 1, new_height)
knitr::opts_chunk$set(fig.height = new_height)
}
wrap_at <- knitr::opts_chunk$get("fig.width") * 10# todo: if there are free-text choices mingled in with the pre-defined ones, don't show
# todo: show rare items if they are pre-defined
# todo: bin rare responses into "other category"
if (!length(item_nomiss)) {
cat("No non-missing values to show.")
} else if (is.numeric(item_nomiss) || dplyr::n_distinct(item_nomiss) < 20) {
plot_labelled(item_nomiss, item_name, wrap_at, go_vertical)
} else {
cat(dplyr::n_distinct(item_nomiss), " unique, categorical values, so not shown.")
}
knitr::opts_chunk$set(fig.height = old_height)0 missing values.
Summary statistics
attributes(item) <- item_attributes
df = data.frame(item, stringsAsFactors = FALSE)
names(df) = html_item_name
escaped_table(codebook_table(df))| name | data_type | missing | complete | n | mean | sd | p0 | p25 | p50 | p75 | p100 | hist | format.spss | display_width |
|---|---|---|---|---|---|---|---|---|---|---|---|---|---|---|
| PCL_HyperarousalSubscale_T1 | numeric | 0 | 410 | 410 | 8.16 | 6.39 | 0 | 2 | 8 | 13 | 24 | ▇▃▃▃▃▂▁▁ | F8.2 | 14 |
if (show_missing_values) {
plot_labelled(missing_values, item_name, wrap_at)
}if (!is.null(item_info)) {
# don't show choices again, if they're basically same thing as value labels
if (!is.null(choices) && !is.null(item_info$choices) &&
all(names(na.omit(choices)) == item_info$choices) &&
all(na.omit(choices) == names(item_info$choices))) {
item_info$choices <- NULL
}
item_info$label_parsed <-
item_info$choice_list <- item_info$study_id <- item_info$id <- NULL
pander::pander(item_info)
}if (!is.null(choices) && length(choices) && length(choices) < 30) {
pander::pander(as.list(choices))
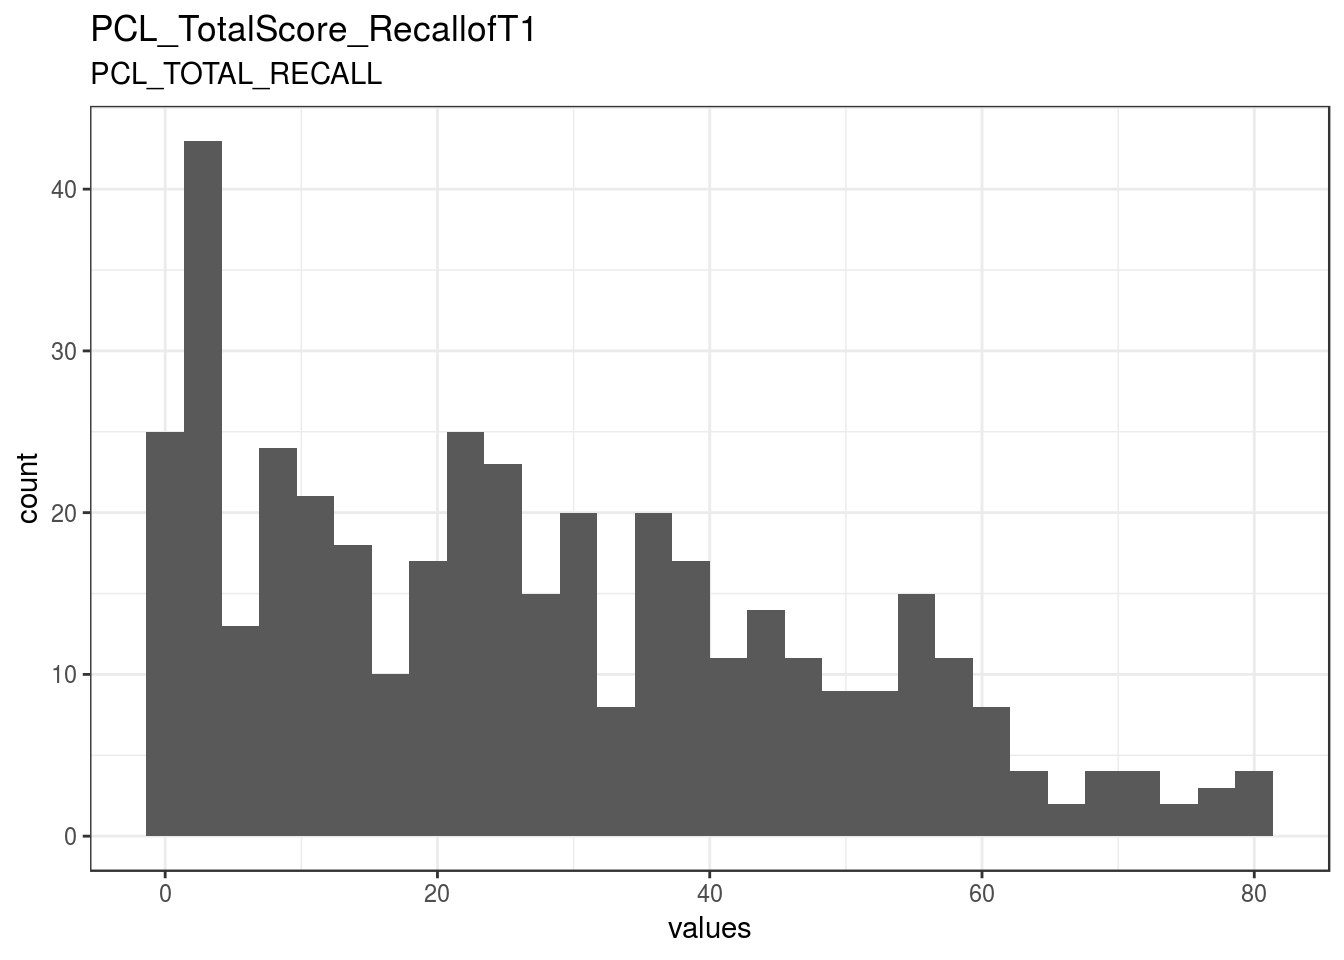
}PCL_TotalScore_RecallofT1
PCL_TOTAL_RECALL
Distribution
show_missing_values <- FALSE
if (has_labels(item)) {
missing_values <- item[is.na(haven::zap_missing(item))]
attributes(missing_values) <- attributes(item)
if (!is.null(attributes(item)$labels)) {
attributes(missing_values)$labels <- attributes(missing_values)$labels[is.na(attributes(missing_values)$labels)]
attributes(item)$labels <- attributes(item)$labels[!is.na(attributes(item)$labels)]
}
if (is.double(item)) {
show_missing_values <- length(unique(haven::na_tag(missing_values))) > 1
item <- haven::zap_missing(item)
}
if (length(item_attributes$labels) == 0 && is.numeric(item)) {
item <- haven::zap_labels(item)
}
}
item_nomiss <- item[!is.na(item)]
# unnest mc_multiple and so on
if (
is.character(item_nomiss) &&
stringr::str_detect(item_nomiss, stringr::fixed(", ")) &&
(exists("type", item_info) &&
stringr::str_detect(item_info$type, pattern = stringr::fixed("multiple")))
) {
item_nomiss <- unlist(stringr::str_split(item_nomiss, pattern = stringr::fixed(", ")))
}
attributes(item_nomiss) <- attributes(item)
old_height <- knitr::opts_chunk$get("fig.height")
non_missing_choices <- item_attributes[["labels"]]
many_labels <- length(non_missing_choices) > 7
go_vertical <- !is.numeric(item_nomiss) || many_labels
if ( go_vertical ) {
# numeric items are plotted horizontally (because that's what usually expected)
# categorical items are plotted vertically because we can use the screen real estate better this way
if (is.null(choices) ||
dplyr::n_distinct(item_nomiss) > length(non_missing_choices)) {
non_missing_choices <- unique(item_nomiss)
names(non_missing_choices) <- non_missing_choices
}
choice_multiplier <- old_height/6.5
new_height <- 2 + choice_multiplier * length(non_missing_choices)
new_height <- ifelse(new_height > 20, 20, new_height)
new_height <- ifelse(new_height < 1, 1, new_height)
knitr::opts_chunk$set(fig.height = new_height)
}
wrap_at <- knitr::opts_chunk$get("fig.width") * 10# todo: if there are free-text choices mingled in with the pre-defined ones, don't show
# todo: show rare items if they are pre-defined
# todo: bin rare responses into "other category"
if (!length(item_nomiss)) {
cat("No non-missing values to show.")
} else if (is.numeric(item_nomiss) || dplyr::n_distinct(item_nomiss) < 20) {
plot_labelled(item_nomiss, item_name, wrap_at, go_vertical)
} else {
cat(dplyr::n_distinct(item_nomiss), " unique, categorical values, so not shown.")
}
knitr::opts_chunk$set(fig.height = old_height)0 missing values.
Summary statistics
attributes(item) <- item_attributes
df = data.frame(item, stringsAsFactors = FALSE)
names(df) = html_item_name
escaped_table(codebook_table(df))| name | label | data_type | missing | complete | n | mean | sd | p0 | p25 | p50 | p75 | p100 | hist | format.spss | display_width |
|---|---|---|---|---|---|---|---|---|---|---|---|---|---|---|---|
| PCL_TotalScore_RecallofT1 | PCL_TOTAL_RECALL | numeric | 0 | 410 | 410 | 27.55 | 20.56 | 0 | 9 | 24.5 | 42 | 80 | ▇▅▆▃▃▃▁▁ | F8.2 | 12 |
if (show_missing_values) {
plot_labelled(missing_values, item_name, wrap_at)
}if (!is.null(item_info)) {
# don't show choices again, if they're basically same thing as value labels
if (!is.null(choices) && !is.null(item_info$choices) &&
all(names(na.omit(choices)) == item_info$choices) &&
all(na.omit(choices) == names(item_info$choices))) {
item_info$choices <- NULL
}
item_info$label_parsed <-
item_info$choice_list <- item_info$study_id <- item_info$id <- NULL
pander::pander(item_info)
}if (!is.null(choices) && length(choices) && length(choices) < 30) {
pander::pander(as.list(choices))
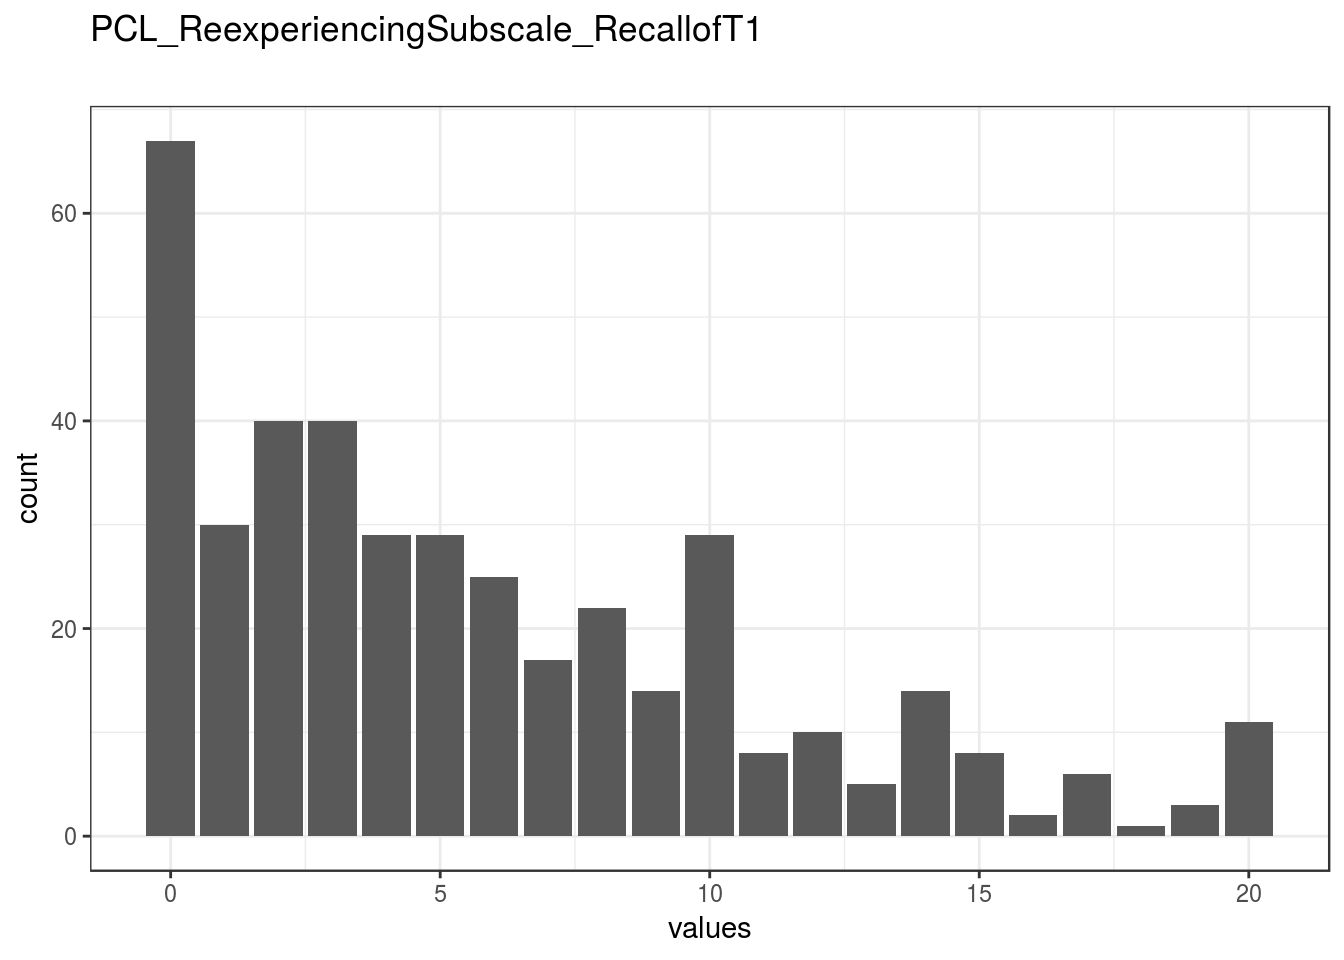
}PCL_ReexperiencingSubscale_RecallofT1
Distribution
show_missing_values <- FALSE
if (has_labels(item)) {
missing_values <- item[is.na(haven::zap_missing(item))]
attributes(missing_values) <- attributes(item)
if (!is.null(attributes(item)$labels)) {
attributes(missing_values)$labels <- attributes(missing_values)$labels[is.na(attributes(missing_values)$labels)]
attributes(item)$labels <- attributes(item)$labels[!is.na(attributes(item)$labels)]
}
if (is.double(item)) {
show_missing_values <- length(unique(haven::na_tag(missing_values))) > 1
item <- haven::zap_missing(item)
}
if (length(item_attributes$labels) == 0 && is.numeric(item)) {
item <- haven::zap_labels(item)
}
}
item_nomiss <- item[!is.na(item)]
# unnest mc_multiple and so on
if (
is.character(item_nomiss) &&
stringr::str_detect(item_nomiss, stringr::fixed(", ")) &&
(exists("type", item_info) &&
stringr::str_detect(item_info$type, pattern = stringr::fixed("multiple")))
) {
item_nomiss <- unlist(stringr::str_split(item_nomiss, pattern = stringr::fixed(", ")))
}
attributes(item_nomiss) <- attributes(item)
old_height <- knitr::opts_chunk$get("fig.height")
non_missing_choices <- item_attributes[["labels"]]
many_labels <- length(non_missing_choices) > 7
go_vertical <- !is.numeric(item_nomiss) || many_labels
if ( go_vertical ) {
# numeric items are plotted horizontally (because that's what usually expected)
# categorical items are plotted vertically because we can use the screen real estate better this way
if (is.null(choices) ||
dplyr::n_distinct(item_nomiss) > length(non_missing_choices)) {
non_missing_choices <- unique(item_nomiss)
names(non_missing_choices) <- non_missing_choices
}
choice_multiplier <- old_height/6.5
new_height <- 2 + choice_multiplier * length(non_missing_choices)
new_height <- ifelse(new_height > 20, 20, new_height)
new_height <- ifelse(new_height < 1, 1, new_height)
knitr::opts_chunk$set(fig.height = new_height)
}
wrap_at <- knitr::opts_chunk$get("fig.width") * 10# todo: if there are free-text choices mingled in with the pre-defined ones, don't show
# todo: show rare items if they are pre-defined
# todo: bin rare responses into "other category"
if (!length(item_nomiss)) {
cat("No non-missing values to show.")
} else if (is.numeric(item_nomiss) || dplyr::n_distinct(item_nomiss) < 20) {
plot_labelled(item_nomiss, item_name, wrap_at, go_vertical)
} else {
cat(dplyr::n_distinct(item_nomiss), " unique, categorical values, so not shown.")
}
knitr::opts_chunk$set(fig.height = old_height)0 missing values.
Summary statistics
attributes(item) <- item_attributes
df = data.frame(item, stringsAsFactors = FALSE)
names(df) = html_item_name
escaped_table(codebook_table(df))| name | data_type | missing | complete | n | mean | sd | p0 | p25 | p50 | p75 | p100 | hist | format.spss | display_width |
|---|---|---|---|---|---|---|---|---|---|---|---|---|---|---|
| PCL_ReexperiencingSubscale_RecallofT1 | numeric | 0 | 410 | 410 | 5.78 | 5.2 | 0 | 2 | 4 | 9 | 20 | ▇▆▂▃▁▂▁▁ | F8.2 | 21 |
if (show_missing_values) {
plot_labelled(missing_values, item_name, wrap_at)
}if (!is.null(item_info)) {
# don't show choices again, if they're basically same thing as value labels
if (!is.null(choices) && !is.null(item_info$choices) &&
all(names(na.omit(choices)) == item_info$choices) &&
all(na.omit(choices) == names(item_info$choices))) {
item_info$choices <- NULL
}
item_info$label_parsed <-
item_info$choice_list <- item_info$study_id <- item_info$id <- NULL
pander::pander(item_info)
}if (!is.null(choices) && length(choices) && length(choices) < 30) {
pander::pander(as.list(choices))
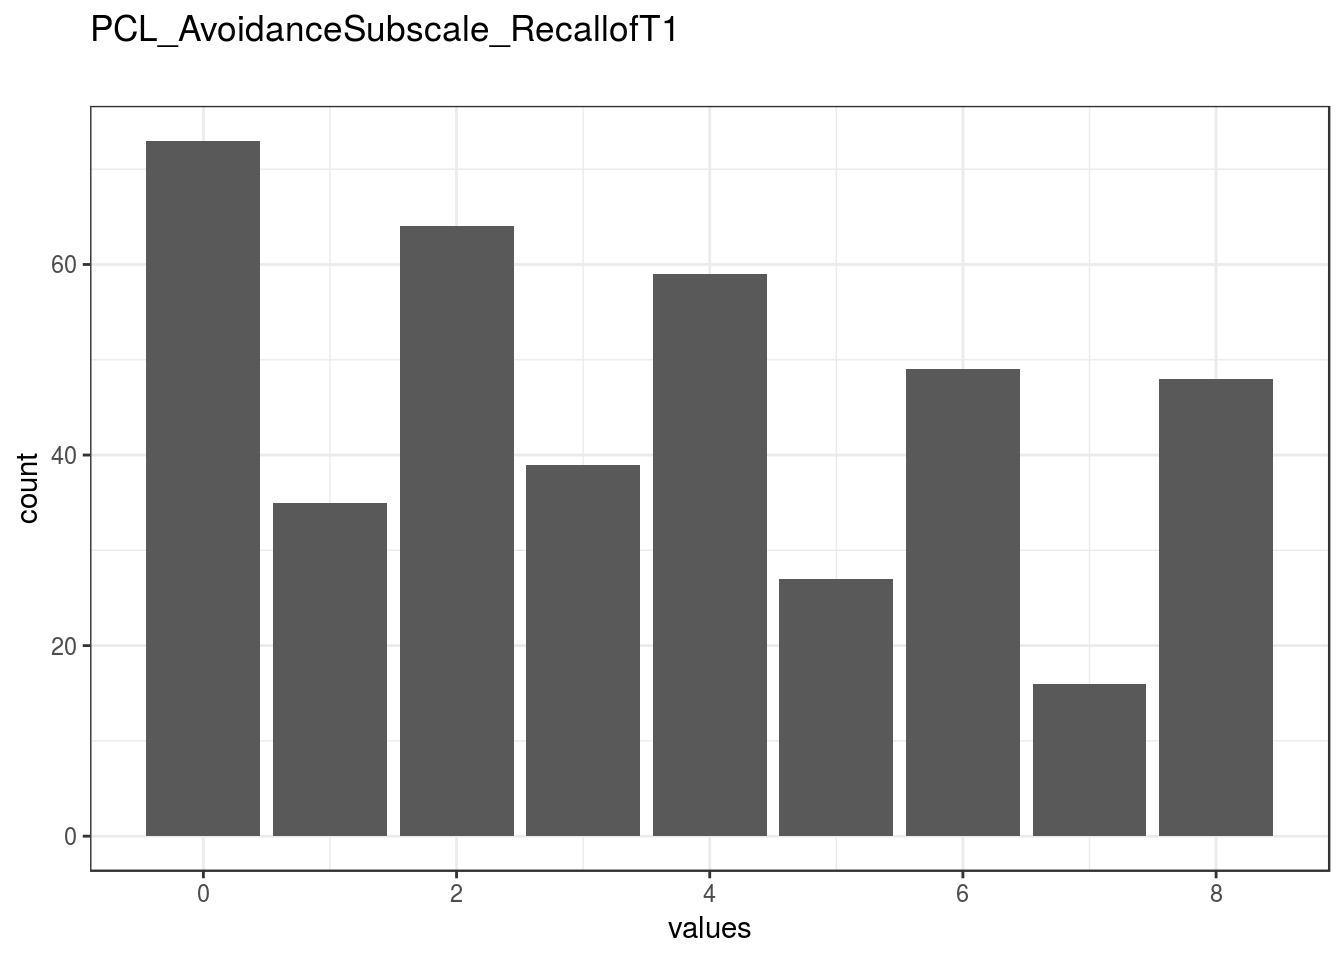
}PCL_AvoidanceSubscale_RecallofT1
Distribution
show_missing_values <- FALSE
if (has_labels(item)) {
missing_values <- item[is.na(haven::zap_missing(item))]
attributes(missing_values) <- attributes(item)
if (!is.null(attributes(item)$labels)) {
attributes(missing_values)$labels <- attributes(missing_values)$labels[is.na(attributes(missing_values)$labels)]
attributes(item)$labels <- attributes(item)$labels[!is.na(attributes(item)$labels)]
}
if (is.double(item)) {
show_missing_values <- length(unique(haven::na_tag(missing_values))) > 1
item <- haven::zap_missing(item)
}
if (length(item_attributes$labels) == 0 && is.numeric(item)) {
item <- haven::zap_labels(item)
}
}
item_nomiss <- item[!is.na(item)]
# unnest mc_multiple and so on
if (
is.character(item_nomiss) &&
stringr::str_detect(item_nomiss, stringr::fixed(", ")) &&
(exists("type", item_info) &&
stringr::str_detect(item_info$type, pattern = stringr::fixed("multiple")))
) {
item_nomiss <- unlist(stringr::str_split(item_nomiss, pattern = stringr::fixed(", ")))
}
attributes(item_nomiss) <- attributes(item)
old_height <- knitr::opts_chunk$get("fig.height")
non_missing_choices <- item_attributes[["labels"]]
many_labels <- length(non_missing_choices) > 7
go_vertical <- !is.numeric(item_nomiss) || many_labels
if ( go_vertical ) {
# numeric items are plotted horizontally (because that's what usually expected)
# categorical items are plotted vertically because we can use the screen real estate better this way
if (is.null(choices) ||
dplyr::n_distinct(item_nomiss) > length(non_missing_choices)) {
non_missing_choices <- unique(item_nomiss)
names(non_missing_choices) <- non_missing_choices
}
choice_multiplier <- old_height/6.5
new_height <- 2 + choice_multiplier * length(non_missing_choices)
new_height <- ifelse(new_height > 20, 20, new_height)
new_height <- ifelse(new_height < 1, 1, new_height)
knitr::opts_chunk$set(fig.height = new_height)
}
wrap_at <- knitr::opts_chunk$get("fig.width") * 10# todo: if there are free-text choices mingled in with the pre-defined ones, don't show
# todo: show rare items if they are pre-defined
# todo: bin rare responses into "other category"
if (!length(item_nomiss)) {
cat("No non-missing values to show.")
} else if (is.numeric(item_nomiss) || dplyr::n_distinct(item_nomiss) < 20) {
plot_labelled(item_nomiss, item_name, wrap_at, go_vertical)
} else {
cat(dplyr::n_distinct(item_nomiss), " unique, categorical values, so not shown.")
}
knitr::opts_chunk$set(fig.height = old_height)0 missing values.
Summary statistics
attributes(item) <- item_attributes
df = data.frame(item, stringsAsFactors = FALSE)
names(df) = html_item_name
escaped_table(codebook_table(df))| name | data_type | missing | complete | n | mean | sd | p0 | p25 | p50 | p75 | p100 | hist | format.spss | display_width |
|---|---|---|---|---|---|---|---|---|---|---|---|---|---|---|
| PCL_AvoidanceSubscale_RecallofT1 | numeric | 0 | 410 | 410 | 3.51 | 2.62 | 0 | 1 | 3 | 6 | 8 | ▇▅▃▅▂▃▁▃ | F8.2 | 18 |
if (show_missing_values) {
plot_labelled(missing_values, item_name, wrap_at)
}if (!is.null(item_info)) {
# don't show choices again, if they're basically same thing as value labels
if (!is.null(choices) && !is.null(item_info$choices) &&
all(names(na.omit(choices)) == item_info$choices) &&
all(na.omit(choices) == names(item_info$choices))) {
item_info$choices <- NULL
}
item_info$label_parsed <-
item_info$choice_list <- item_info$study_id <- item_info$id <- NULL
pander::pander(item_info)
}if (!is.null(choices) && length(choices) && length(choices) < 30) {
pander::pander(as.list(choices))
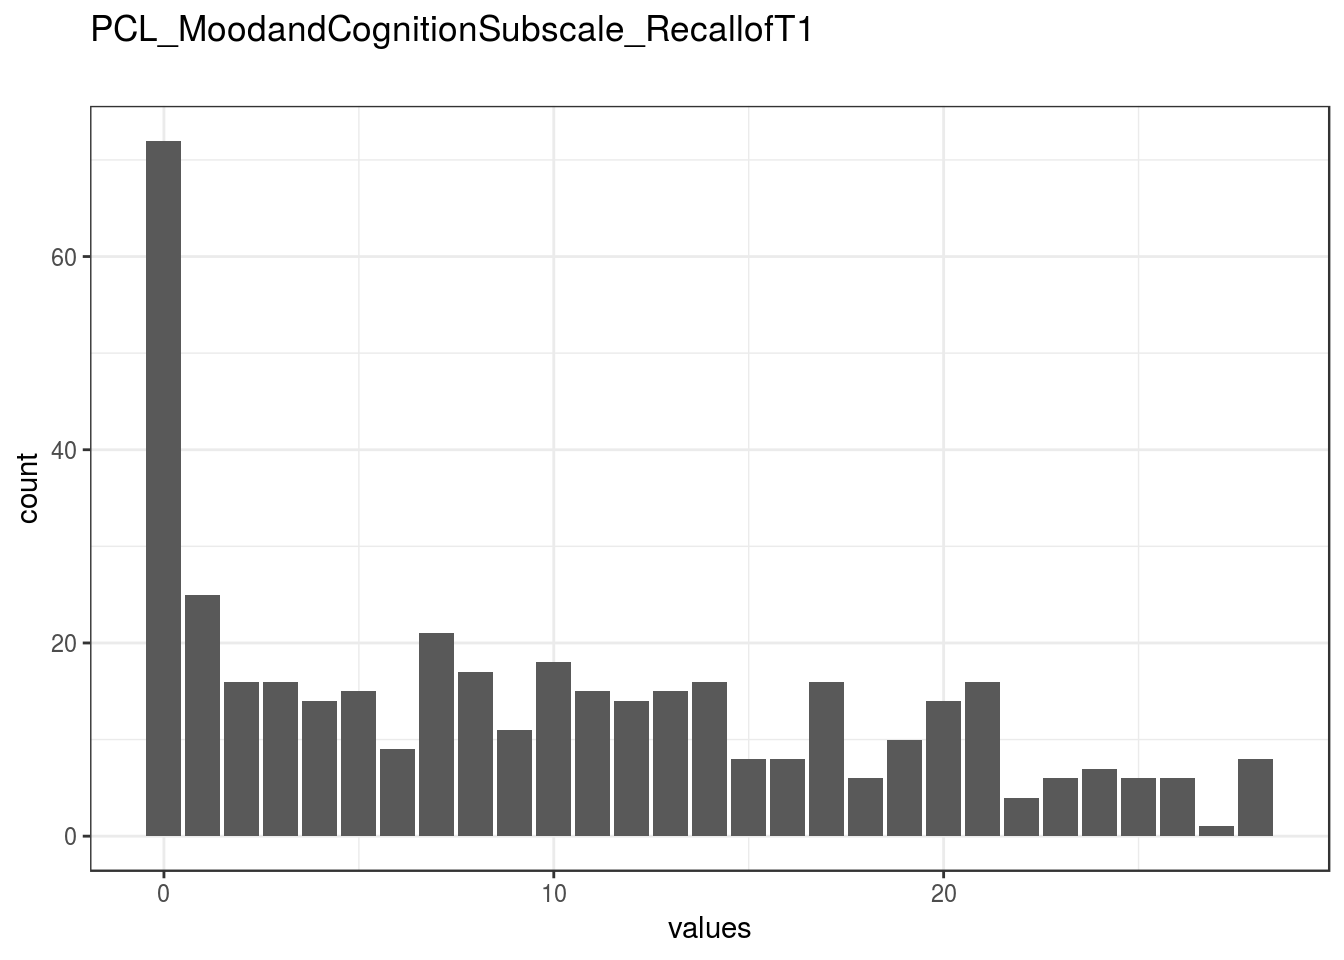
}PCL_MoodandCognitionSubscale_RecallofT1
Distribution
show_missing_values <- FALSE
if (has_labels(item)) {
missing_values <- item[is.na(haven::zap_missing(item))]
attributes(missing_values) <- attributes(item)
if (!is.null(attributes(item)$labels)) {
attributes(missing_values)$labels <- attributes(missing_values)$labels[is.na(attributes(missing_values)$labels)]
attributes(item)$labels <- attributes(item)$labels[!is.na(attributes(item)$labels)]
}
if (is.double(item)) {
show_missing_values <- length(unique(haven::na_tag(missing_values))) > 1
item <- haven::zap_missing(item)
}
if (length(item_attributes$labels) == 0 && is.numeric(item)) {
item <- haven::zap_labels(item)
}
}
item_nomiss <- item[!is.na(item)]
# unnest mc_multiple and so on
if (
is.character(item_nomiss) &&
stringr::str_detect(item_nomiss, stringr::fixed(", ")) &&
(exists("type", item_info) &&
stringr::str_detect(item_info$type, pattern = stringr::fixed("multiple")))
) {
item_nomiss <- unlist(stringr::str_split(item_nomiss, pattern = stringr::fixed(", ")))
}
attributes(item_nomiss) <- attributes(item)
old_height <- knitr::opts_chunk$get("fig.height")
non_missing_choices <- item_attributes[["labels"]]
many_labels <- length(non_missing_choices) > 7
go_vertical <- !is.numeric(item_nomiss) || many_labels
if ( go_vertical ) {
# numeric items are plotted horizontally (because that's what usually expected)
# categorical items are plotted vertically because we can use the screen real estate better this way
if (is.null(choices) ||
dplyr::n_distinct(item_nomiss) > length(non_missing_choices)) {
non_missing_choices <- unique(item_nomiss)
names(non_missing_choices) <- non_missing_choices
}
choice_multiplier <- old_height/6.5
new_height <- 2 + choice_multiplier * length(non_missing_choices)
new_height <- ifelse(new_height > 20, 20, new_height)
new_height <- ifelse(new_height < 1, 1, new_height)
knitr::opts_chunk$set(fig.height = new_height)
}
wrap_at <- knitr::opts_chunk$get("fig.width") * 10# todo: if there are free-text choices mingled in with the pre-defined ones, don't show
# todo: show rare items if they are pre-defined
# todo: bin rare responses into "other category"
if (!length(item_nomiss)) {
cat("No non-missing values to show.")
} else if (is.numeric(item_nomiss) || dplyr::n_distinct(item_nomiss) < 20) {
plot_labelled(item_nomiss, item_name, wrap_at, go_vertical)
} else {
cat(dplyr::n_distinct(item_nomiss), " unique, categorical values, so not shown.")
}
knitr::opts_chunk$set(fig.height = old_height)0 missing values.
Summary statistics
attributes(item) <- item_attributes
df = data.frame(item, stringsAsFactors = FALSE)
names(df) = html_item_name
escaped_table(codebook_table(df))| name | data_type | missing | complete | n | mean | sd | p0 | p25 | p50 | p75 | p100 | hist | format.spss | display_width |
|---|---|---|---|---|---|---|---|---|---|---|---|---|---|---|
| PCL_MoodandCognitionSubscale_RecallofT1 | numeric | 0 | 410 | 410 | 9.73 | 8.17 | 0 | 2 | 8.5 | 16 | 28 | ▇▃▃▃▂▃▁▁ | F8.2 | 23 |
if (show_missing_values) {
plot_labelled(missing_values, item_name, wrap_at)
}if (!is.null(item_info)) {
# don't show choices again, if they're basically same thing as value labels
if (!is.null(choices) && !is.null(item_info$choices) &&
all(names(na.omit(choices)) == item_info$choices) &&
all(na.omit(choices) == names(item_info$choices))) {
item_info$choices <- NULL
}
item_info$label_parsed <-
item_info$choice_list <- item_info$study_id <- item_info$id <- NULL
pander::pander(item_info)
}if (!is.null(choices) && length(choices) && length(choices) < 30) {
pander::pander(as.list(choices))
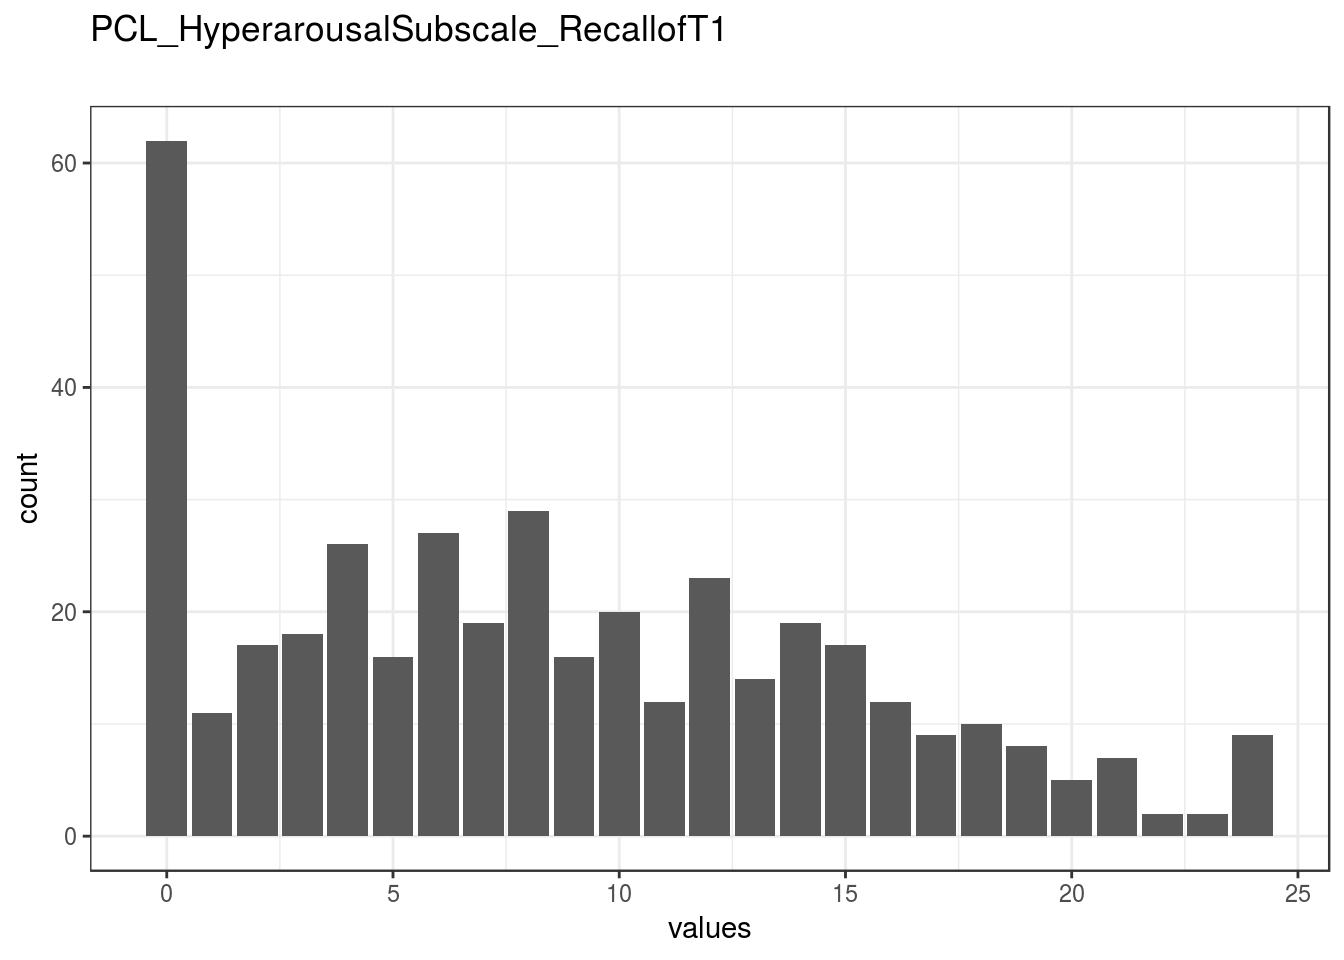
}PCL_HyperarousalSubscale_RecallofT1
Distribution
show_missing_values <- FALSE
if (has_labels(item)) {
missing_values <- item[is.na(haven::zap_missing(item))]
attributes(missing_values) <- attributes(item)
if (!is.null(attributes(item)$labels)) {
attributes(missing_values)$labels <- attributes(missing_values)$labels[is.na(attributes(missing_values)$labels)]
attributes(item)$labels <- attributes(item)$labels[!is.na(attributes(item)$labels)]
}
if (is.double(item)) {
show_missing_values <- length(unique(haven::na_tag(missing_values))) > 1
item <- haven::zap_missing(item)
}
if (length(item_attributes$labels) == 0 && is.numeric(item)) {
item <- haven::zap_labels(item)
}
}
item_nomiss <- item[!is.na(item)]
# unnest mc_multiple and so on
if (
is.character(item_nomiss) &&
stringr::str_detect(item_nomiss, stringr::fixed(", ")) &&
(exists("type", item_info) &&
stringr::str_detect(item_info$type, pattern = stringr::fixed("multiple")))
) {
item_nomiss <- unlist(stringr::str_split(item_nomiss, pattern = stringr::fixed(", ")))
}
attributes(item_nomiss) <- attributes(item)
old_height <- knitr::opts_chunk$get("fig.height")
non_missing_choices <- item_attributes[["labels"]]
many_labels <- length(non_missing_choices) > 7
go_vertical <- !is.numeric(item_nomiss) || many_labels
if ( go_vertical ) {
# numeric items are plotted horizontally (because that's what usually expected)
# categorical items are plotted vertically because we can use the screen real estate better this way
if (is.null(choices) ||
dplyr::n_distinct(item_nomiss) > length(non_missing_choices)) {
non_missing_choices <- unique(item_nomiss)
names(non_missing_choices) <- non_missing_choices
}
choice_multiplier <- old_height/6.5
new_height <- 2 + choice_multiplier * length(non_missing_choices)
new_height <- ifelse(new_height > 20, 20, new_height)
new_height <- ifelse(new_height < 1, 1, new_height)
knitr::opts_chunk$set(fig.height = new_height)
}
wrap_at <- knitr::opts_chunk$get("fig.width") * 10# todo: if there are free-text choices mingled in with the pre-defined ones, don't show
# todo: show rare items if they are pre-defined
# todo: bin rare responses into "other category"
if (!length(item_nomiss)) {
cat("No non-missing values to show.")
} else if (is.numeric(item_nomiss) || dplyr::n_distinct(item_nomiss) < 20) {
plot_labelled(item_nomiss, item_name, wrap_at, go_vertical)
} else {
cat(dplyr::n_distinct(item_nomiss), " unique, categorical values, so not shown.")
}
knitr::opts_chunk$set(fig.height = old_height)0 missing values.
Summary statistics
attributes(item) <- item_attributes
df = data.frame(item, stringsAsFactors = FALSE)
names(df) = html_item_name
escaped_table(codebook_table(df))| name | data_type | missing | complete | n | mean | sd | p0 | p25 | p50 | p75 | p100 | hist | format.spss | display_width |
|---|---|---|---|---|---|---|---|---|---|---|---|---|---|---|
| PCL_HyperarousalSubscale_RecallofT1 | numeric | 0 | 410 | 410 | 8.52 | 6.47 | 0 | 3 | 8 | 13 | 24 | ▇▅▅▅▃▂▂▁ | F8.2 | 20 |
if (show_missing_values) {
plot_labelled(missing_values, item_name, wrap_at)
}if (!is.null(item_info)) {
# don't show choices again, if they're basically same thing as value labels
if (!is.null(choices) && !is.null(item_info$choices) &&
all(names(na.omit(choices)) == item_info$choices) &&
all(na.omit(choices) == names(item_info$choices))) {
item_info$choices <- NULL
}
item_info$label_parsed <-
item_info$choice_list <- item_info$study_id <- item_info$id <- NULL
pander::pander(item_info)
}if (!is.null(choices) && length(choices) && length(choices) < 30) {
pander::pander(as.list(choices))
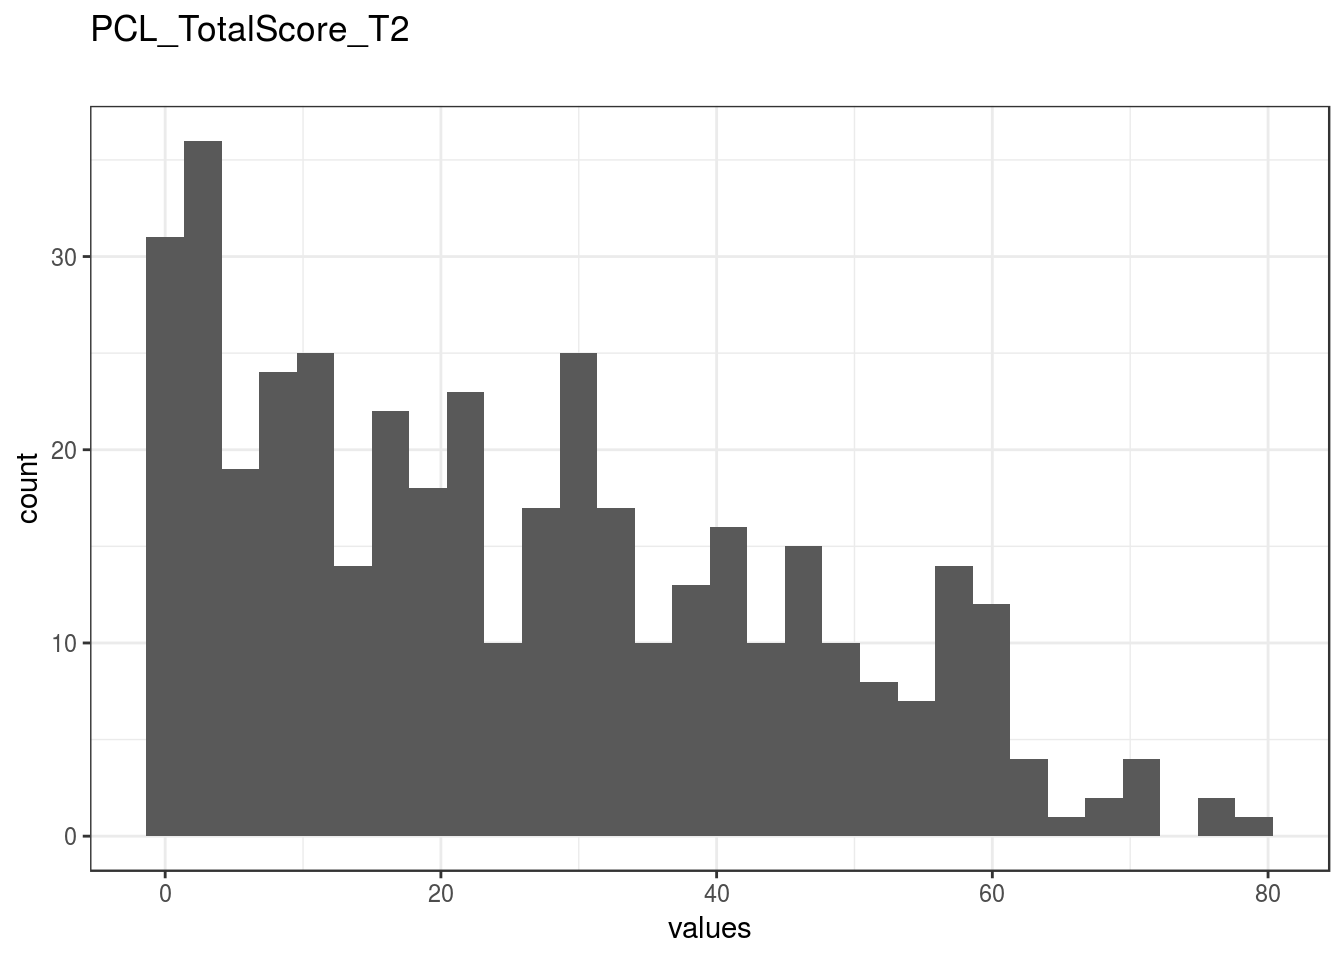
}PCL_TotalScore_T2
Distribution
show_missing_values <- FALSE
if (has_labels(item)) {
missing_values <- item[is.na(haven::zap_missing(item))]
attributes(missing_values) <- attributes(item)
if (!is.null(attributes(item)$labels)) {
attributes(missing_values)$labels <- attributes(missing_values)$labels[is.na(attributes(missing_values)$labels)]
attributes(item)$labels <- attributes(item)$labels[!is.na(attributes(item)$labels)]
}
if (is.double(item)) {
show_missing_values <- length(unique(haven::na_tag(missing_values))) > 1
item <- haven::zap_missing(item)
}
if (length(item_attributes$labels) == 0 && is.numeric(item)) {
item <- haven::zap_labels(item)
}
}
item_nomiss <- item[!is.na(item)]
# unnest mc_multiple and so on
if (
is.character(item_nomiss) &&
stringr::str_detect(item_nomiss, stringr::fixed(", ")) &&
(exists("type", item_info) &&
stringr::str_detect(item_info$type, pattern = stringr::fixed("multiple")))
) {
item_nomiss <- unlist(stringr::str_split(item_nomiss, pattern = stringr::fixed(", ")))
}
attributes(item_nomiss) <- attributes(item)
old_height <- knitr::opts_chunk$get("fig.height")
non_missing_choices <- item_attributes[["labels"]]
many_labels <- length(non_missing_choices) > 7
go_vertical <- !is.numeric(item_nomiss) || many_labels
if ( go_vertical ) {
# numeric items are plotted horizontally (because that's what usually expected)
# categorical items are plotted vertically because we can use the screen real estate better this way
if (is.null(choices) ||
dplyr::n_distinct(item_nomiss) > length(non_missing_choices)) {
non_missing_choices <- unique(item_nomiss)
names(non_missing_choices) <- non_missing_choices
}
choice_multiplier <- old_height/6.5
new_height <- 2 + choice_multiplier * length(non_missing_choices)
new_height <- ifelse(new_height > 20, 20, new_height)
new_height <- ifelse(new_height < 1, 1, new_height)
knitr::opts_chunk$set(fig.height = new_height)
}
wrap_at <- knitr::opts_chunk$get("fig.width") * 10# todo: if there are free-text choices mingled in with the pre-defined ones, don't show
# todo: show rare items if they are pre-defined
# todo: bin rare responses into "other category"
if (!length(item_nomiss)) {
cat("No non-missing values to show.")
} else if (is.numeric(item_nomiss) || dplyr::n_distinct(item_nomiss) < 20) {
plot_labelled(item_nomiss, item_name, wrap_at, go_vertical)
} else {
cat(dplyr::n_distinct(item_nomiss), " unique, categorical values, so not shown.")
}
knitr::opts_chunk$set(fig.height = old_height)0 missing values.
Summary statistics
attributes(item) <- item_attributes
df = data.frame(item, stringsAsFactors = FALSE)
names(df) = html_item_name
escaped_table(codebook_table(df))| name | data_type | missing | complete | n | mean | sd | p0 | p25 | p50 | p75 | p100 | hist | format.spss | display_width |
|---|---|---|---|---|---|---|---|---|---|---|---|---|---|---|
| PCL_TotalScore_T2 | numeric | 0 | 410 | 410 | 25.58 | 19.41 | 0 | 8 | 22.5 | 40 | 79 | ▇▅▅▃▃▃▁▁ | F8.2 | 12 |
if (show_missing_values) {
plot_labelled(missing_values, item_name, wrap_at)
}if (!is.null(item_info)) {
# don't show choices again, if they're basically same thing as value labels
if (!is.null(choices) && !is.null(item_info$choices) &&
all(names(na.omit(choices)) == item_info$choices) &&
all(na.omit(choices) == names(item_info$choices))) {
item_info$choices <- NULL
}
item_info$label_parsed <-
item_info$choice_list <- item_info$study_id <- item_info$id <- NULL
pander::pander(item_info)
}if (!is.null(choices) && length(choices) && length(choices) < 30) {
pander::pander(as.list(choices))
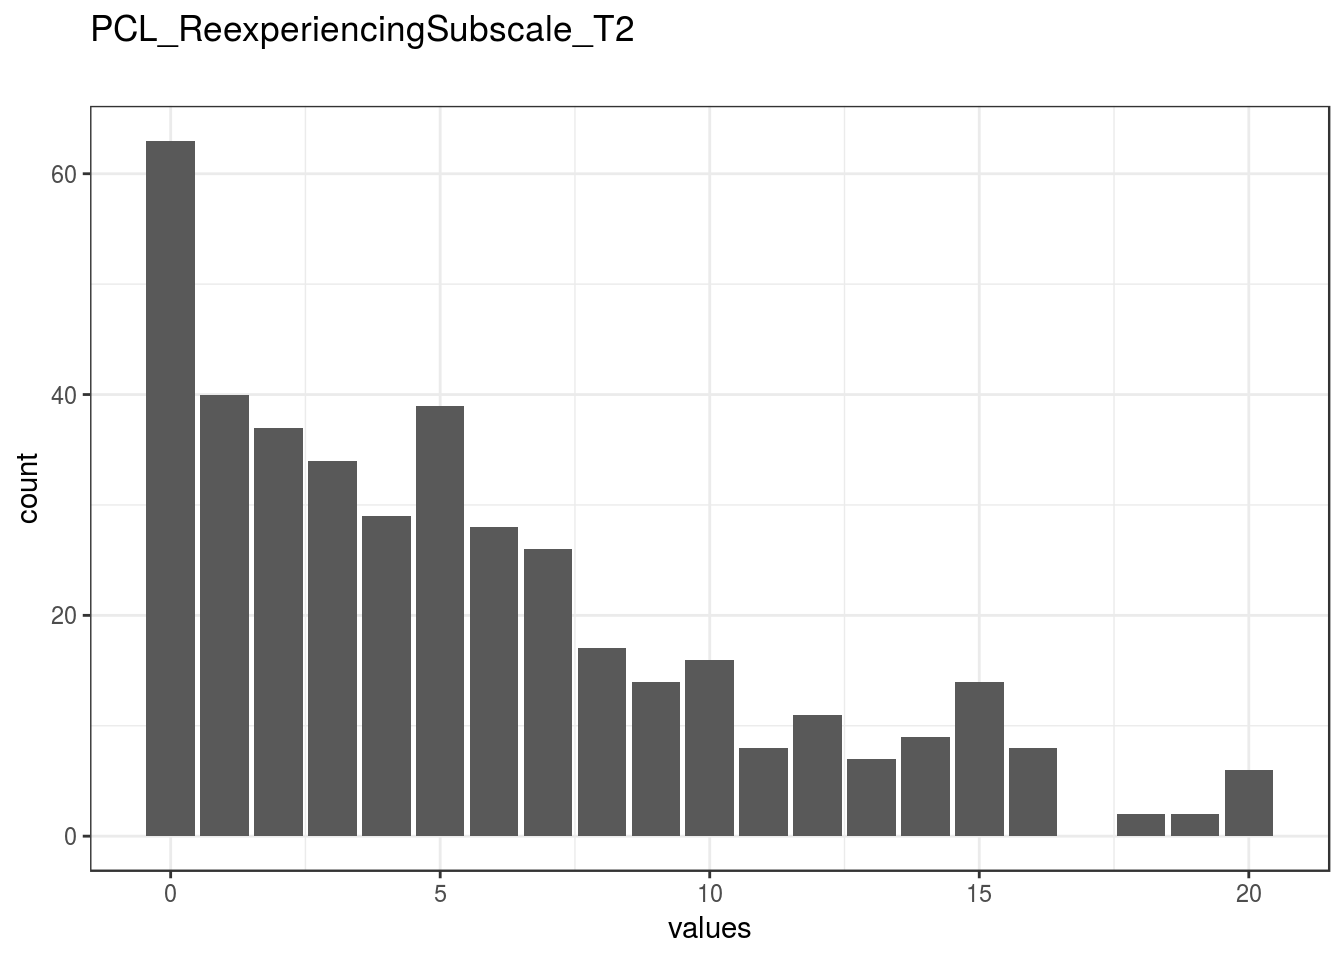
}PCL_ReexperiencingSubscale_T2
Distribution
show_missing_values <- FALSE
if (has_labels(item)) {
missing_values <- item[is.na(haven::zap_missing(item))]
attributes(missing_values) <- attributes(item)
if (!is.null(attributes(item)$labels)) {
attributes(missing_values)$labels <- attributes(missing_values)$labels[is.na(attributes(missing_values)$labels)]
attributes(item)$labels <- attributes(item)$labels[!is.na(attributes(item)$labels)]
}
if (is.double(item)) {
show_missing_values <- length(unique(haven::na_tag(missing_values))) > 1
item <- haven::zap_missing(item)
}
if (length(item_attributes$labels) == 0 && is.numeric(item)) {
item <- haven::zap_labels(item)
}
}
item_nomiss <- item[!is.na(item)]
# unnest mc_multiple and so on
if (
is.character(item_nomiss) &&
stringr::str_detect(item_nomiss, stringr::fixed(", ")) &&
(exists("type", item_info) &&
stringr::str_detect(item_info$type, pattern = stringr::fixed("multiple")))
) {
item_nomiss <- unlist(stringr::str_split(item_nomiss, pattern = stringr::fixed(", ")))
}
attributes(item_nomiss) <- attributes(item)
old_height <- knitr::opts_chunk$get("fig.height")
non_missing_choices <- item_attributes[["labels"]]
many_labels <- length(non_missing_choices) > 7
go_vertical <- !is.numeric(item_nomiss) || many_labels
if ( go_vertical ) {
# numeric items are plotted horizontally (because that's what usually expected)
# categorical items are plotted vertically because we can use the screen real estate better this way
if (is.null(choices) ||
dplyr::n_distinct(item_nomiss) > length(non_missing_choices)) {
non_missing_choices <- unique(item_nomiss)
names(non_missing_choices) <- non_missing_choices
}
choice_multiplier <- old_height/6.5
new_height <- 2 + choice_multiplier * length(non_missing_choices)
new_height <- ifelse(new_height > 20, 20, new_height)
new_height <- ifelse(new_height < 1, 1, new_height)
knitr::opts_chunk$set(fig.height = new_height)
}
wrap_at <- knitr::opts_chunk$get("fig.width") * 10# todo: if there are free-text choices mingled in with the pre-defined ones, don't show
# todo: show rare items if they are pre-defined
# todo: bin rare responses into "other category"
if (!length(item_nomiss)) {
cat("No non-missing values to show.")
} else if (is.numeric(item_nomiss) || dplyr::n_distinct(item_nomiss) < 20) {
plot_labelled(item_nomiss, item_name, wrap_at, go_vertical)
} else {
cat(dplyr::n_distinct(item_nomiss), " unique, categorical values, so not shown.")
}
knitr::opts_chunk$set(fig.height = old_height)0 missing values.
Summary statistics
attributes(item) <- item_attributes
df = data.frame(item, stringsAsFactors = FALSE)
names(df) = html_item_name
escaped_table(codebook_table(df))| name | data_type | missing | complete | n | mean | sd | p0 | p25 | p50 | p75 | p100 | hist | format.spss | display_width |
|---|---|---|---|---|---|---|---|---|---|---|---|---|---|---|
| PCL_ReexperiencingSubscale_T2 | numeric | 0 | 410 | 410 | 5.53 | 4.93 | 0 | 1.25 | 5 | 8 | 20 | ▇▆▃▃▁▂▁▁ | F8.2 | 15 |
if (show_missing_values) {
plot_labelled(missing_values, item_name, wrap_at)
}if (!is.null(item_info)) {
# don't show choices again, if they're basically same thing as value labels
if (!is.null(choices) && !is.null(item_info$choices) &&
all(names(na.omit(choices)) == item_info$choices) &&
all(na.omit(choices) == names(item_info$choices))) {
item_info$choices <- NULL
}
item_info$label_parsed <-
item_info$choice_list <- item_info$study_id <- item_info$id <- NULL
pander::pander(item_info)
}if (!is.null(choices) && length(choices) && length(choices) < 30) {
pander::pander(as.list(choices))
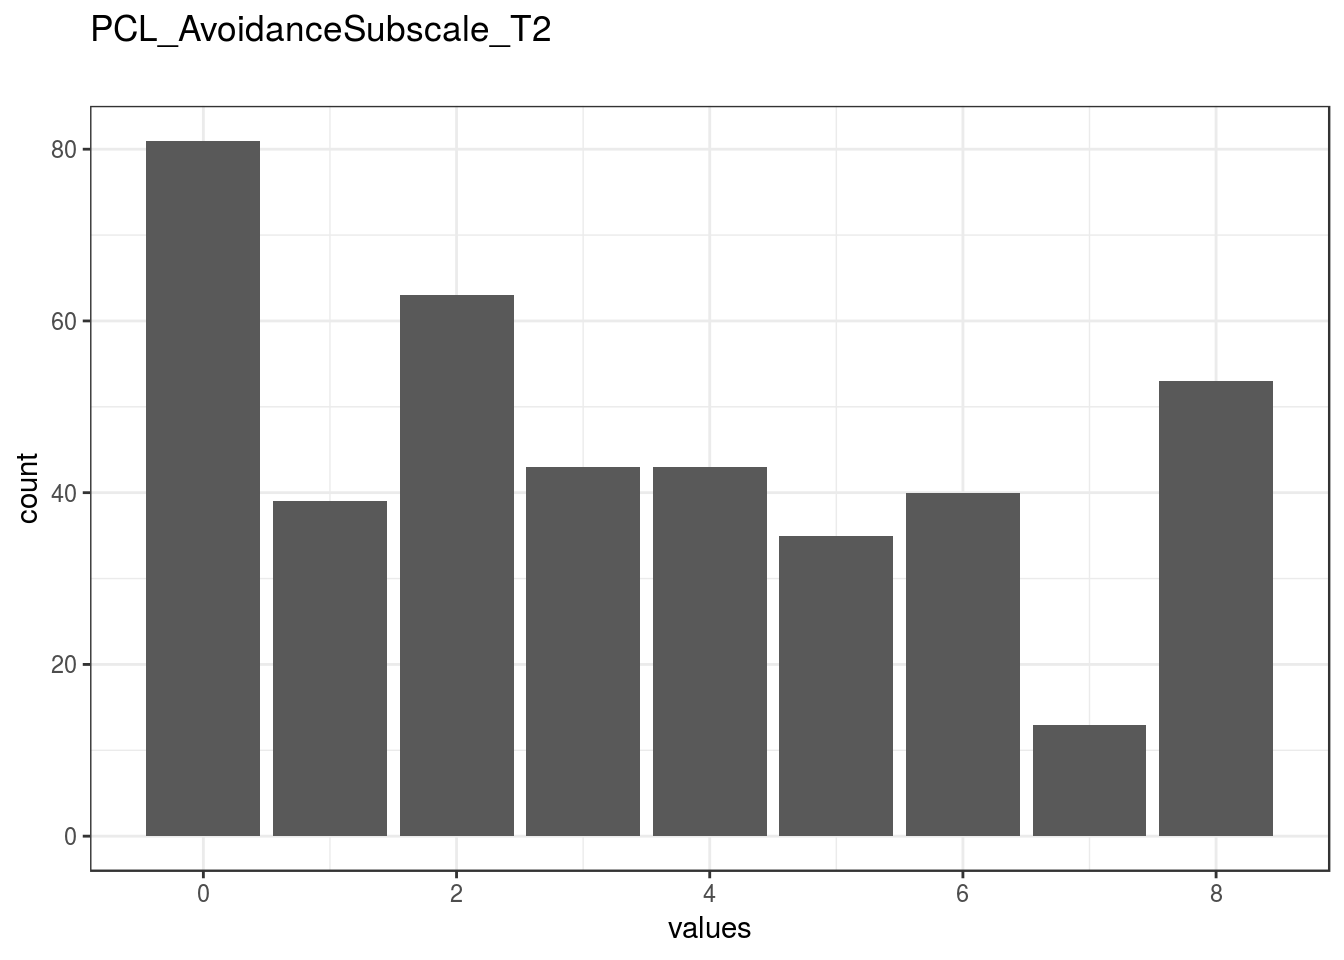
}PCL_AvoidanceSubscale_T2
Distribution
show_missing_values <- FALSE
if (has_labels(item)) {
missing_values <- item[is.na(haven::zap_missing(item))]
attributes(missing_values) <- attributes(item)
if (!is.null(attributes(item)$labels)) {
attributes(missing_values)$labels <- attributes(missing_values)$labels[is.na(attributes(missing_values)$labels)]
attributes(item)$labels <- attributes(item)$labels[!is.na(attributes(item)$labels)]
}
if (is.double(item)) {
show_missing_values <- length(unique(haven::na_tag(missing_values))) > 1
item <- haven::zap_missing(item)
}
if (length(item_attributes$labels) == 0 && is.numeric(item)) {
item <- haven::zap_labels(item)
}
}
item_nomiss <- item[!is.na(item)]
# unnest mc_multiple and so on
if (
is.character(item_nomiss) &&
stringr::str_detect(item_nomiss, stringr::fixed(", ")) &&
(exists("type", item_info) &&
stringr::str_detect(item_info$type, pattern = stringr::fixed("multiple")))
) {
item_nomiss <- unlist(stringr::str_split(item_nomiss, pattern = stringr::fixed(", ")))
}
attributes(item_nomiss) <- attributes(item)
old_height <- knitr::opts_chunk$get("fig.height")
non_missing_choices <- item_attributes[["labels"]]
many_labels <- length(non_missing_choices) > 7
go_vertical <- !is.numeric(item_nomiss) || many_labels
if ( go_vertical ) {
# numeric items are plotted horizontally (because that's what usually expected)
# categorical items are plotted vertically because we can use the screen real estate better this way
if (is.null(choices) ||
dplyr::n_distinct(item_nomiss) > length(non_missing_choices)) {
non_missing_choices <- unique(item_nomiss)
names(non_missing_choices) <- non_missing_choices
}
choice_multiplier <- old_height/6.5
new_height <- 2 + choice_multiplier * length(non_missing_choices)
new_height <- ifelse(new_height > 20, 20, new_height)
new_height <- ifelse(new_height < 1, 1, new_height)
knitr::opts_chunk$set(fig.height = new_height)
}
wrap_at <- knitr::opts_chunk$get("fig.width") * 10# todo: if there are free-text choices mingled in with the pre-defined ones, don't show
# todo: show rare items if they are pre-defined
# todo: bin rare responses into "other category"
if (!length(item_nomiss)) {
cat("No non-missing values to show.")
} else if (is.numeric(item_nomiss) || dplyr::n_distinct(item_nomiss) < 20) {
plot_labelled(item_nomiss, item_name, wrap_at, go_vertical)
} else {
cat(dplyr::n_distinct(item_nomiss), " unique, categorical values, so not shown.")
}
knitr::opts_chunk$set(fig.height = old_height)0 missing values.
Summary statistics
attributes(item) <- item_attributes
df = data.frame(item, stringsAsFactors = FALSE)
names(df) = html_item_name
escaped_table(codebook_table(df))| name | data_type | missing | complete | n | mean | sd | p0 | p25 | p50 | p75 | p100 | hist | format.spss | display_width |
|---|---|---|---|---|---|---|---|---|---|---|---|---|---|---|
| PCL_AvoidanceSubscale_T2 | numeric | 0 | 410 | 410 | 3.4 | 2.69 | 0 | 1 | 3 | 6 | 8 | ▇▅▃▃▂▂▁▃ | F8.2 | 12 |
if (show_missing_values) {
plot_labelled(missing_values, item_name, wrap_at)
}if (!is.null(item_info)) {
# don't show choices again, if they're basically same thing as value labels
if (!is.null(choices) && !is.null(item_info$choices) &&
all(names(na.omit(choices)) == item_info$choices) &&
all(na.omit(choices) == names(item_info$choices))) {
item_info$choices <- NULL
}
item_info$label_parsed <-
item_info$choice_list <- item_info$study_id <- item_info$id <- NULL
pander::pander(item_info)
}if (!is.null(choices) && length(choices) && length(choices) < 30) {
pander::pander(as.list(choices))
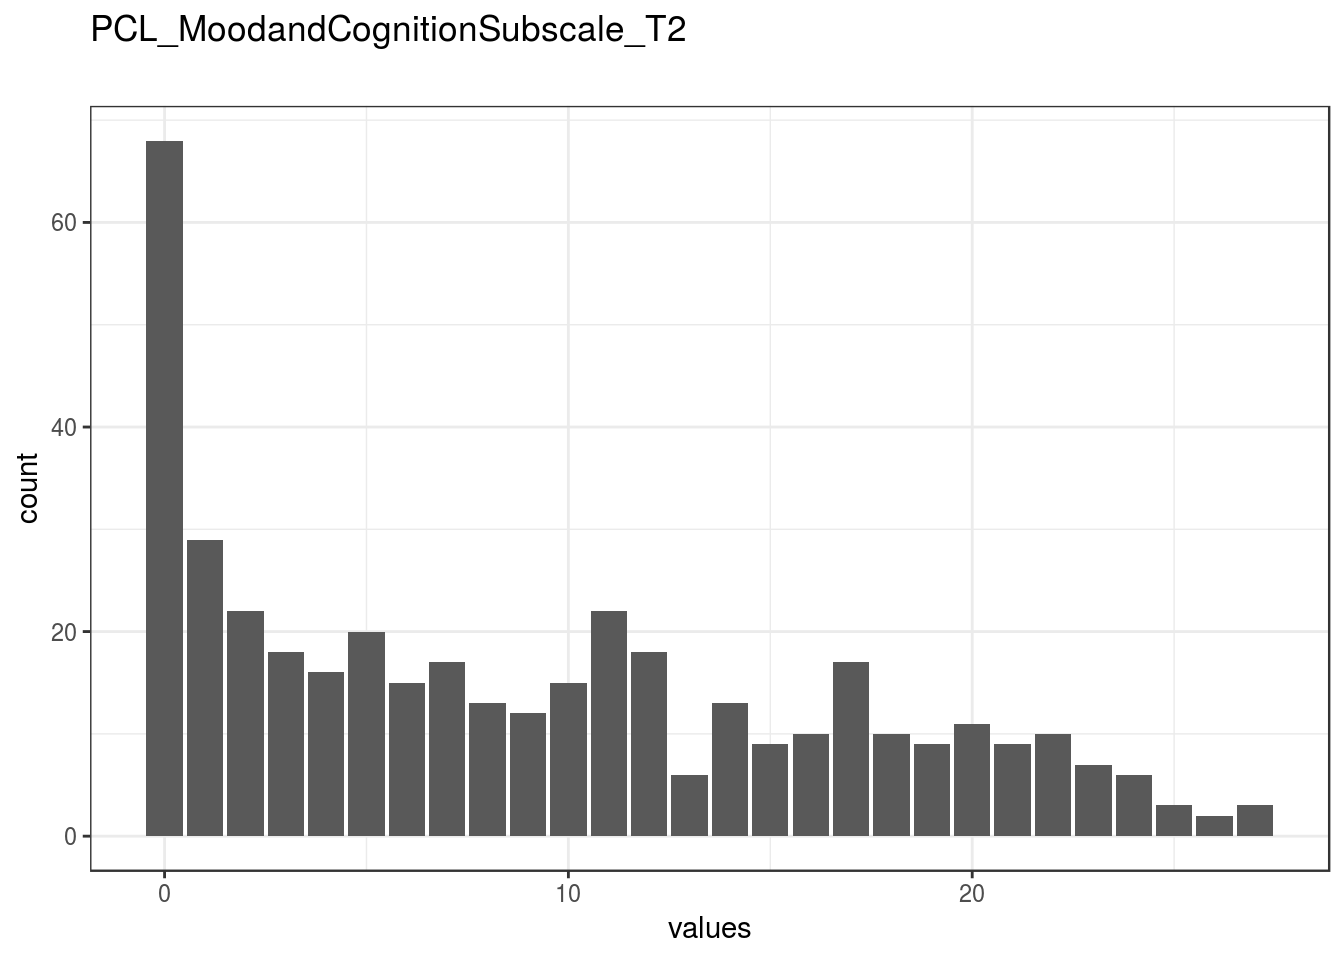
}PCL_MoodandCognitionSubscale_T2
Distribution
show_missing_values <- FALSE
if (has_labels(item)) {
missing_values <- item[is.na(haven::zap_missing(item))]
attributes(missing_values) <- attributes(item)
if (!is.null(attributes(item)$labels)) {
attributes(missing_values)$labels <- attributes(missing_values)$labels[is.na(attributes(missing_values)$labels)]
attributes(item)$labels <- attributes(item)$labels[!is.na(attributes(item)$labels)]
}
if (is.double(item)) {
show_missing_values <- length(unique(haven::na_tag(missing_values))) > 1
item <- haven::zap_missing(item)
}
if (length(item_attributes$labels) == 0 && is.numeric(item)) {
item <- haven::zap_labels(item)
}
}
item_nomiss <- item[!is.na(item)]
# unnest mc_multiple and so on
if (
is.character(item_nomiss) &&
stringr::str_detect(item_nomiss, stringr::fixed(", ")) &&
(exists("type", item_info) &&
stringr::str_detect(item_info$type, pattern = stringr::fixed("multiple")))
) {
item_nomiss <- unlist(stringr::str_split(item_nomiss, pattern = stringr::fixed(", ")))
}
attributes(item_nomiss) <- attributes(item)
old_height <- knitr::opts_chunk$get("fig.height")
non_missing_choices <- item_attributes[["labels"]]
many_labels <- length(non_missing_choices) > 7
go_vertical <- !is.numeric(item_nomiss) || many_labels
if ( go_vertical ) {
# numeric items are plotted horizontally (because that's what usually expected)
# categorical items are plotted vertically because we can use the screen real estate better this way
if (is.null(choices) ||
dplyr::n_distinct(item_nomiss) > length(non_missing_choices)) {
non_missing_choices <- unique(item_nomiss)
names(non_missing_choices) <- non_missing_choices
}
choice_multiplier <- old_height/6.5
new_height <- 2 + choice_multiplier * length(non_missing_choices)
new_height <- ifelse(new_height > 20, 20, new_height)
new_height <- ifelse(new_height < 1, 1, new_height)
knitr::opts_chunk$set(fig.height = new_height)
}
wrap_at <- knitr::opts_chunk$get("fig.width") * 10# todo: if there are free-text choices mingled in with the pre-defined ones, don't show
# todo: show rare items if they are pre-defined
# todo: bin rare responses into "other category"
if (!length(item_nomiss)) {
cat("No non-missing values to show.")
} else if (is.numeric(item_nomiss) || dplyr::n_distinct(item_nomiss) < 20) {
plot_labelled(item_nomiss, item_name, wrap_at, go_vertical)
} else {
cat(dplyr::n_distinct(item_nomiss), " unique, categorical values, so not shown.")
}
knitr::opts_chunk$set(fig.height = old_height)0 missing values.
Summary statistics
attributes(item) <- item_attributes
df = data.frame(item, stringsAsFactors = FALSE)
names(df) = html_item_name
escaped_table(codebook_table(df))| name | data_type | missing | complete | n | mean | sd | p0 | p25 | p50 | p75 | p100 | hist | format.spss | display_width |
|---|---|---|---|---|---|---|---|---|---|---|---|---|---|---|
| PCL_MoodandCognitionSubscale_T2 | numeric | 0 | 410 | 410 | 8.92 | 7.61 | 0 | 2 | 7.5 | 15 | 27 | ▇▃▃▃▂▃▂▁ | F8.2 | 17 |
if (show_missing_values) {
plot_labelled(missing_values, item_name, wrap_at)
}if (!is.null(item_info)) {
# don't show choices again, if they're basically same thing as value labels
if (!is.null(choices) && !is.null(item_info$choices) &&
all(names(na.omit(choices)) == item_info$choices) &&
all(na.omit(choices) == names(item_info$choices))) {
item_info$choices <- NULL
}
item_info$label_parsed <-
item_info$choice_list <- item_info$study_id <- item_info$id <- NULL
pander::pander(item_info)
}if (!is.null(choices) && length(choices) && length(choices) < 30) {
pander::pander(as.list(choices))
}PCL_HyperarousalSubscale_T2
Distribution
show_missing_values <- FALSE
if (has_labels(item)) {
missing_values <- item[is.na(haven::zap_missing(item))]
attributes(missing_values) <- attributes(item)
if (!is.null(attributes(item)$labels)) {
attributes(missing_values)$labels <- attributes(missing_values)$labels[is.na(attributes(missing_values)$labels)]
attributes(item)$labels <- attributes(item)$labels[!is.na(attributes(item)$labels)]
}
if (is.double(item)) {
show_missing_values <- length(unique(haven::na_tag(missing_values))) > 1
item <- haven::zap_missing(item)
}
if (length(item_attributes$labels) == 0 && is.numeric(item)) {
item <- haven::zap_labels(item)
}
}
item_nomiss <- item[!is.na(item)]
# unnest mc_multiple and so on
if (
is.character(item_nomiss) &&
stringr::str_detect(item_nomiss, stringr::fixed(", ")) &&
(exists("type", item_info) &&
stringr::str_detect(item_info$type, pattern = stringr::fixed("multiple")))
) {
item_nomiss <- unlist(stringr::str_split(item_nomiss, pattern = stringr::fixed(", ")))
}
attributes(item_nomiss) <- attributes(item)
old_height <- knitr::opts_chunk$get("fig.height")
non_missing_choices <- item_attributes[["labels"]]
many_labels <- length(non_missing_choices) > 7
go_vertical <- !is.numeric(item_nomiss) || many_labels
if ( go_vertical ) {
# numeric items are plotted horizontally (because that's what usually expected)
# categorical items are plotted vertically because we can use the screen real estate better this way
if (is.null(choices) ||
dplyr::n_distinct(item_nomiss) > length(non_missing_choices)) {
non_missing_choices <- unique(item_nomiss)
names(non_missing_choices) <- non_missing_choices
}
choice_multiplier <- old_height/6.5
new_height <- 2 + choice_multiplier * length(non_missing_choices)
new_height <- ifelse(new_height > 20, 20, new_height)
new_height <- ifelse(new_height < 1, 1, new_height)
knitr::opts_chunk$set(fig.height = new_height)
}
wrap_at <- knitr::opts_chunk$get("fig.width") * 10# todo: if there are free-text choices mingled in with the pre-defined ones, don't show
# todo: show rare items if they are pre-defined
# todo: bin rare responses into "other category"
if (!length(item_nomiss)) {
cat("No non-missing values to show.")
} else if (is.numeric(item_nomiss) || dplyr::n_distinct(item_nomiss) < 20) {
plot_labelled(item_nomiss, item_name, wrap_at, go_vertical)
} else {
cat(dplyr::n_distinct(item_nomiss), " unique, categorical values, so not shown.")
}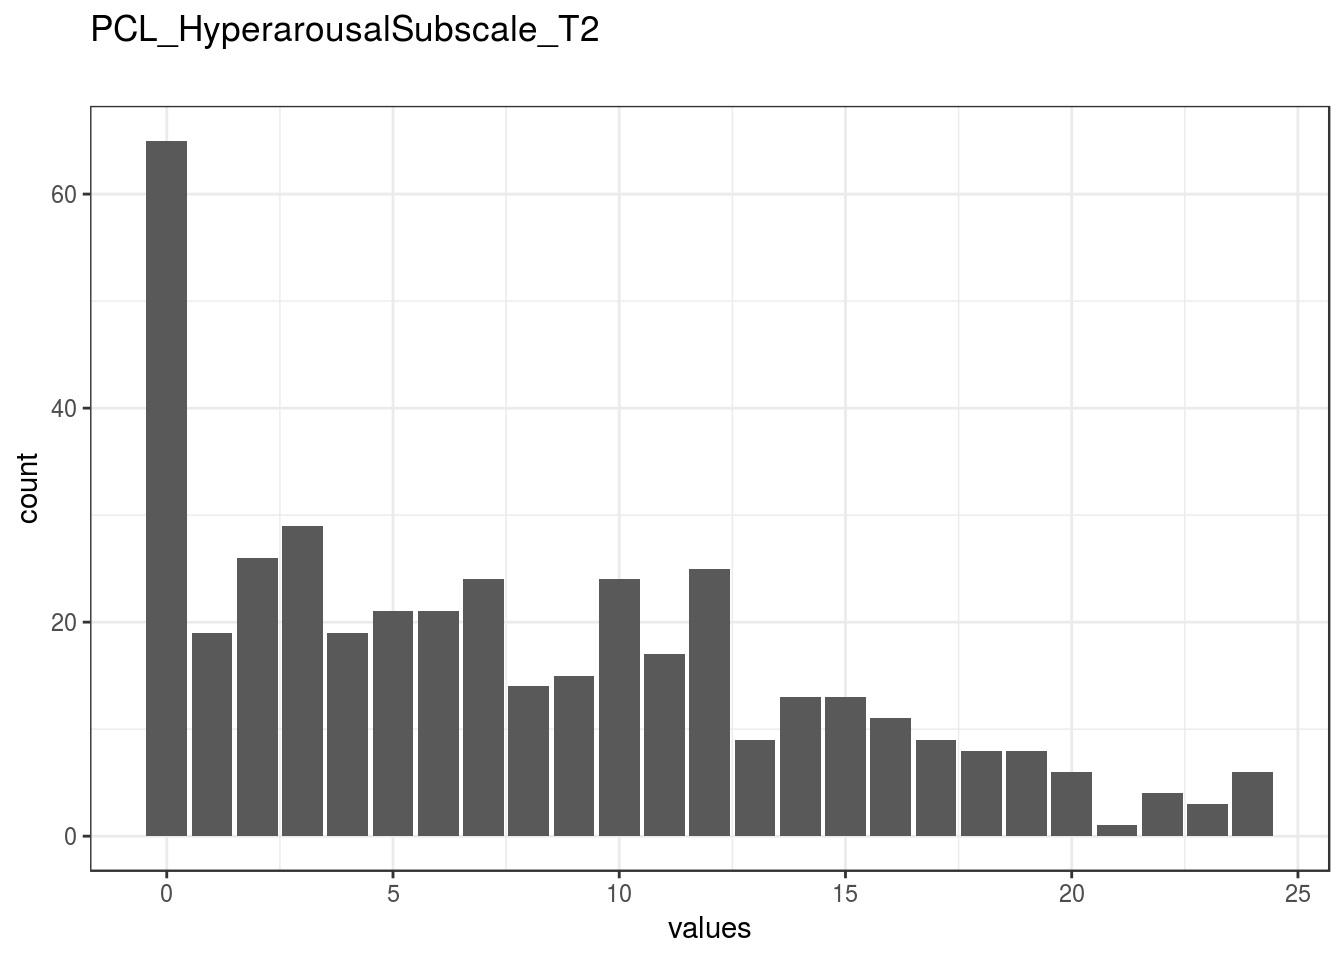
knitr::opts_chunk$set(fig.height = old_height)0 missing values.
Summary statistics
attributes(item) <- item_attributes
df = data.frame(item, stringsAsFactors = FALSE)
names(df) = html_item_name
escaped_table(codebook_table(df))| name | data_type | missing | complete | n | mean | sd | p0 | p25 | p50 | p75 | p100 | hist | format.spss | display_width |
|---|---|---|---|---|---|---|---|---|---|---|---|---|---|---|
| PCL_HyperarousalSubscale_T2 | numeric | 0 | 410 | 410 | 7.73 | 6.36 | 0 | 2 | 7 | 12 | 24 | ▇▃▃▃▂▂▁▁ | F8.2 | 14 |
if (show_missing_values) {
plot_labelled(missing_values, item_name, wrap_at)
}if (!is.null(item_info)) {
# don't show choices again, if they're basically same thing as value labels
if (!is.null(choices) && !is.null(item_info$choices) &&
all(names(na.omit(choices)) == item_info$choices) &&
all(na.omit(choices) == names(item_info$choices))) {
item_info$choices <- NULL
}
item_info$label_parsed <-
item_info$choice_list <- item_info$study_id <- item_info$id <- NULL
pander::pander(item_info)
}if (!is.null(choices) && length(choices) && length(choices) < 30) {
pander::pander(as.list(choices))
}PTSDpositive_T2
0
Distribution
show_missing_values <- FALSE
if (has_labels(item)) {
missing_values <- item[is.na(haven::zap_missing(item))]
attributes(missing_values) <- attributes(item)
if (!is.null(attributes(item)$labels)) {
attributes(missing_values)$labels <- attributes(missing_values)$labels[is.na(attributes(missing_values)$labels)]
attributes(item)$labels <- attributes(item)$labels[!is.na(attributes(item)$labels)]
}
if (is.double(item)) {
show_missing_values <- length(unique(haven::na_tag(missing_values))) > 1
item <- haven::zap_missing(item)
}
if (length(item_attributes$labels) == 0 && is.numeric(item)) {
item <- haven::zap_labels(item)
}
}
item_nomiss <- item[!is.na(item)]
# unnest mc_multiple and so on
if (
is.character(item_nomiss) &&
stringr::str_detect(item_nomiss, stringr::fixed(", ")) &&
(exists("type", item_info) &&
stringr::str_detect(item_info$type, pattern = stringr::fixed("multiple")))
) {
item_nomiss <- unlist(stringr::str_split(item_nomiss, pattern = stringr::fixed(", ")))
}
attributes(item_nomiss) <- attributes(item)
old_height <- knitr::opts_chunk$get("fig.height")
non_missing_choices <- item_attributes[["labels"]]
many_labels <- length(non_missing_choices) > 7
go_vertical <- !is.numeric(item_nomiss) || many_labels
if ( go_vertical ) {
# numeric items are plotted horizontally (because that's what usually expected)
# categorical items are plotted vertically because we can use the screen real estate better this way
if (is.null(choices) ||
dplyr::n_distinct(item_nomiss) > length(non_missing_choices)) {
non_missing_choices <- unique(item_nomiss)
names(non_missing_choices) <- non_missing_choices
}
choice_multiplier <- old_height/6.5
new_height <- 2 + choice_multiplier * length(non_missing_choices)
new_height <- ifelse(new_height > 20, 20, new_height)
new_height <- ifelse(new_height < 1, 1, new_height)
knitr::opts_chunk$set(fig.height = new_height)
}
wrap_at <- knitr::opts_chunk$get("fig.width") * 10# todo: if there are free-text choices mingled in with the pre-defined ones, don't show
# todo: show rare items if they are pre-defined
# todo: bin rare responses into "other category"
if (!length(item_nomiss)) {
cat("No non-missing values to show.")
} else if (is.numeric(item_nomiss) || dplyr::n_distinct(item_nomiss) < 20) {
plot_labelled(item_nomiss, item_name, wrap_at, go_vertical)
} else {
cat(dplyr::n_distinct(item_nomiss), " unique, categorical values, so not shown.")
}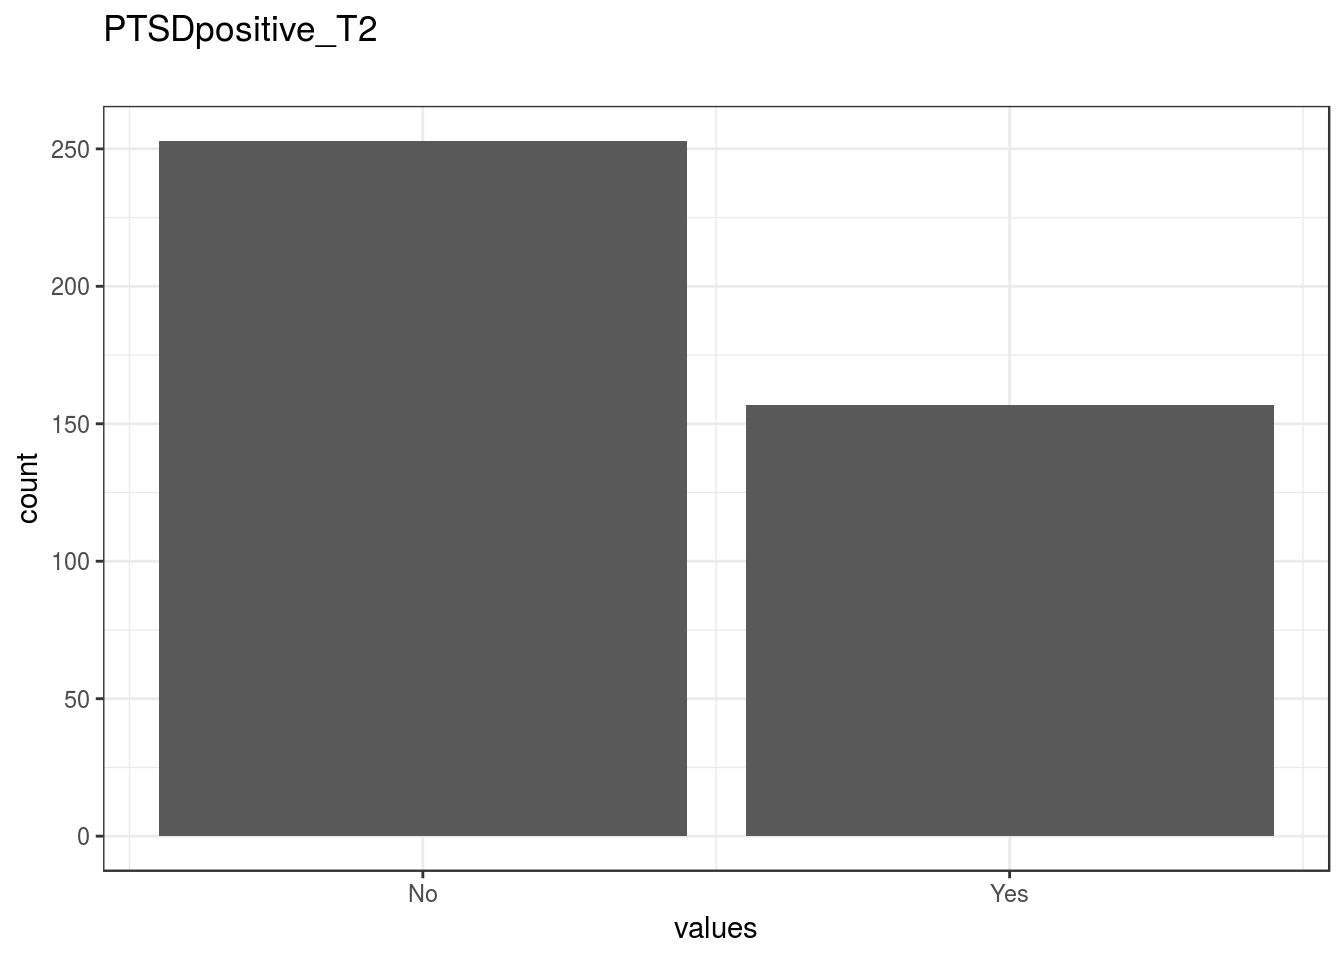
knitr::opts_chunk$set(fig.height = old_height)0 missing values.
Summary statistics
attributes(item) <- item_attributes
df = data.frame(item, stringsAsFactors = FALSE)
names(df) = html_item_name
escaped_table(codebook_table(df))| name | data_type | value_labels | missing | complete | n | mean | sd | p0 | p25 | p50 | p75 | p100 | hist | format.spss | display_width |
|---|---|---|---|---|---|---|---|---|---|---|---|---|---|---|---|
| PTSDpositive_T2 | numeric | 0. No, 1. Yes |
0 | 410 | 410 | 0.38 | 0.49 | 0 | 0 | 0 | 1 | 1 | ▇▁▁▁▁▁▁▅ | F8.2 | 13 |
if (show_missing_values) {
plot_labelled(missing_values, item_name, wrap_at)
}if (!is.null(item_info)) {
# don't show choices again, if they're basically same thing as value labels
if (!is.null(choices) && !is.null(item_info$choices) &&
all(names(na.omit(choices)) == item_info$choices) &&
all(na.omit(choices) == names(item_info$choices))) {
item_info$choices <- NULL
}
item_info$label_parsed <-
item_info$choice_list <- item_info$study_id <- item_info$id <- NULL
pander::pander(item_info)
}Value labels
if (!is.null(choices) && length(choices) && length(choices) < 30) {
    pander::pander(as.list(choices))
}- No: 0
- Yes: 1
MemoryDiscrepancy
Recall of T1 - T1 (positive scores indicate recalling more than initially experienced)
Distribution
show_missing_values <- FALSE
if (has_labels(item)) {
  missing_values <- item[is.na(haven::zap_missing(item))]
  attributes(missing_values) <- attributes(item)
  if (!is.null(attributes(item)$labels)) {
    attributes(missing_values)$labels <- attributes(missing_values)$labels[is.na(attributes(missing_values)$labels)]
    attributes(item)$labels <- attributes(item)$labels[!is.na(attributes(item)$labels)]
  }
  if (is.double(item)) {
    show_missing_values <- length(unique(haven::na_tag(missing_values))) > 1
    item <- haven::zap_missing(item)
  }
  if (length(item_attributes$labels) == 0 && is.numeric(item)) {
    item <- haven::zap_labels(item)
  }
}
item_nomiss <- item[!is.na(item)]

# unnest mc_multiple and so on
if (
  is.character(item_nomiss) &&
  stringr::str_detect(item_nomiss, stringr::fixed(", ")) &&
  (exists("type", item_info) &&
    stringr::str_detect(item_info$type, pattern = stringr::fixed("multiple")))
  ) {
  item_nomiss <- unlist(stringr::str_split(item_nomiss, pattern = stringr::fixed(", ")))
}
attributes(item_nomiss) <- attributes(item)

old_height <- knitr::opts_chunk$get("fig.height")
non_missing_choices <- item_attributes[["labels"]]
many_labels <- length(non_missing_choices) > 7
go_vertical <- !is.numeric(item_nomiss) || many_labels
if ( go_vertical ) {
  # numeric items are plotted horizontally (because that's what usually expected)
  # categorical items are plotted vertically because we can use the screen real estate better this way

    if (is.null(choices) ||
        dplyr::n_distinct(item_nomiss) > length(non_missing_choices)) {
        non_missing_choices <- unique(item_nomiss)
        names(non_missing_choices) <- non_missing_choices
    }
  choice_multiplier <- old_height/6.5
    new_height <- 2 + choice_multiplier * length(non_missing_choices)
    new_height <- ifelse(new_height > 20, 20, new_height)
    new_height <- ifelse(new_height < 1, 1, new_height)
    knitr::opts_chunk$set(fig.height = new_height)
}

wrap_at <- knitr::opts_chunk$get("fig.width") * 10
# todo: if there are free-text choices mingled in with the pre-defined ones, don't show
# todo: show rare items if they are pre-defined
# todo: bin rare responses into "other category"
if (!length(item_nomiss)) {
cat("No non-missing values to show.")
} else if (is.numeric(item_nomiss) || dplyr::n_distinct(item_nomiss) < 20) {
plot_labelled(item_nomiss, item_name, wrap_at, go_vertical)
} else {
cat(dplyr::n_distinct(item_nomiss), " unique, categorical values, so not shown.")
}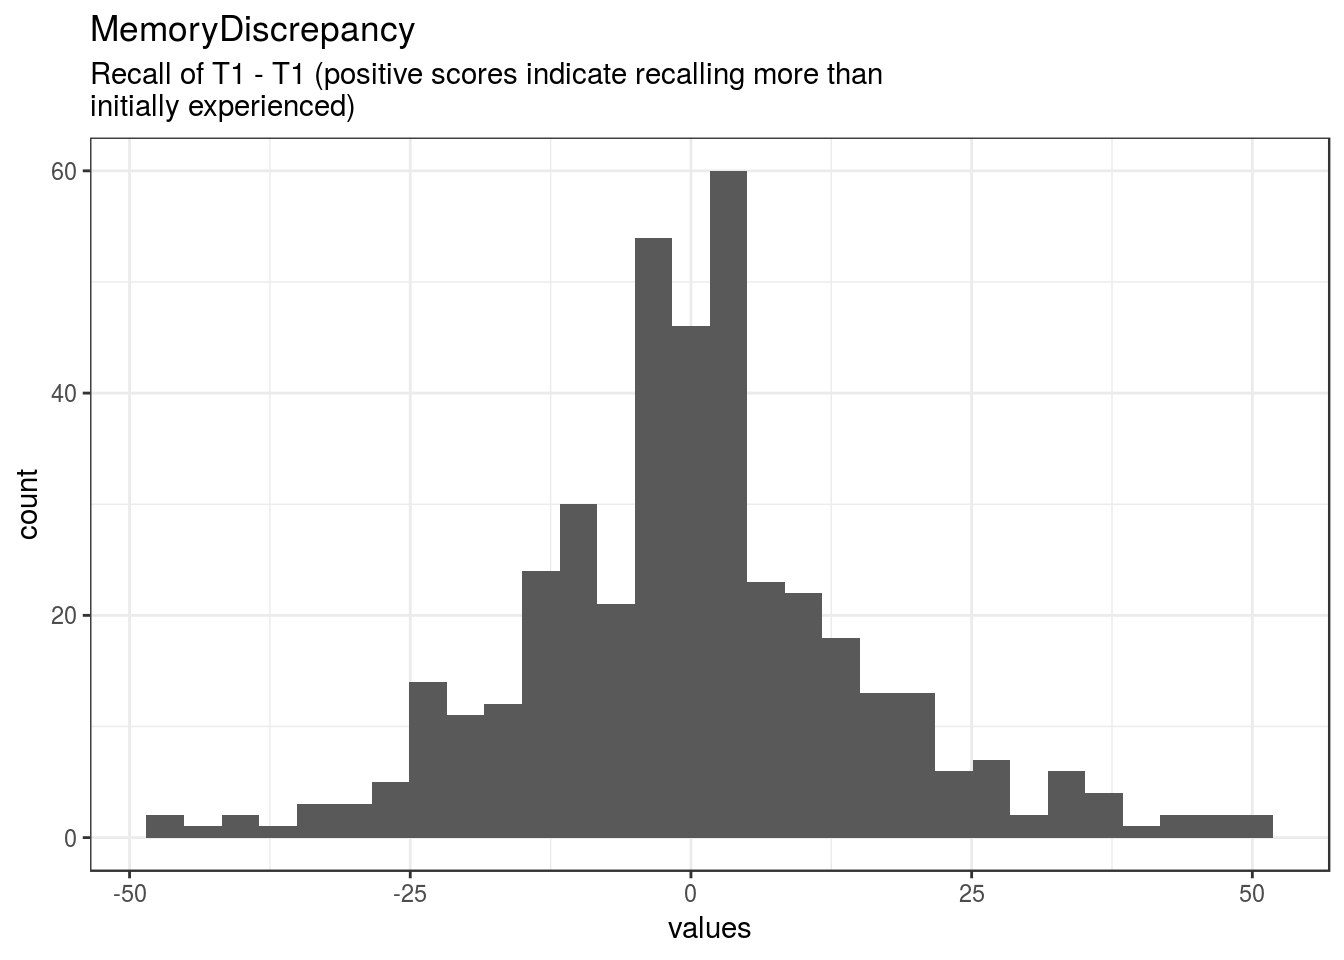
knitr::opts_chunk$set(fig.height = old_height)0 missing values.
Summary statistics
attributes(item) <- item_attributes
df = data.frame(item, stringsAsFactors = FALSE)
names(df) = html_item_name
escaped_table(codebook_table(df))| name | label | data_type | missing | complete | n | mean | sd | p0 | p25 | p50 | p75 | p100 | hist | format.spss | display_width |
|---|---|---|---|---|---|---|---|---|---|---|---|---|---|---|---|
| MemoryDiscrepancy | Recall of T1 - T1 (positive scores indicate recalling more than initially experienced) | numeric | 0 | 410 | 410 | 0.17 | 15.45 | -48 | -9 | 0 | 8 | 49 | ▁▁▃▇▇▂▁▁ | F8.2 | 15 |
if (show_missing_values) {
  plot_labelled(missing_values, item_name, wrap_at)
}
if (!is.null(item_info)) {
# don't show choices again, if they're basically same thing as value labels
if (!is.null(choices) && !is.null(item_info$choices) &&
all(names(na.omit(choices)) == item_info$choices) &&
all(na.omit(choices) == names(item_info$choices))) {
item_info$choices <- NULL
}
item_info$label_parsed <-
item_info$choice_list <- item_info$study_id <- item_info$id <- NULL
pander::pander(item_info)
}if (!is.null(choices) && length(choices) && length(choices) < 30) {
pander::pander(as.list(choices))
}ReliableChangeOverTime
1
Distribution
show_missing_values <- FALSE
if (has_labels(item)) {
missing_values <- item[is.na(haven::zap_missing(item))]
attributes(missing_values) <- attributes(item)
if (!is.null(attributes(item)$labels)) {
attributes(missing_values)$labels <- attributes(missing_values)$labels[is.na(attributes(missing_values)$labels)]
attributes(item)$labels <- attributes(item)$labels[!is.na(attributes(item)$labels)]
}
if (is.double(item)) {
show_missing_values <- length(unique(haven::na_tag(missing_values))) > 1
item <- haven::zap_missing(item)
}
if (length(item_attributes$labels) == 0 && is.numeric(item)) {
item <- haven::zap_labels(item)
}
}
item_nomiss <- item[!is.na(item)]
# unnest mc_multiple and so on
if (
is.character(item_nomiss) &&
stringr::str_detect(item_nomiss, stringr::fixed(", ")) &&
(exists("type", item_info) &&
stringr::str_detect(item_info$type, pattern = stringr::fixed("multiple")))
) {
item_nomiss <- unlist(stringr::str_split(item_nomiss, pattern = stringr::fixed(", ")))
}
attributes(item_nomiss) <- attributes(item)
old_height <- knitr::opts_chunk$get("fig.height")
non_missing_choices <- item_attributes[["labels"]]
many_labels <- length(non_missing_choices) > 7
go_vertical <- !is.numeric(item_nomiss) || many_labels
if ( go_vertical ) {
# numeric items are plotted horizontally (because that's what usually expected)
# categorical items are plotted vertically because we can use the screen real estate better this way
if (is.null(choices) ||
dplyr::n_distinct(item_nomiss) > length(non_missing_choices)) {
non_missing_choices <- unique(item_nomiss)
names(non_missing_choices) <- non_missing_choices
}
choice_multiplier <- old_height/6.5
new_height <- 2 + choice_multiplier * length(non_missing_choices)
new_height <- ifelse(new_height > 20, 20, new_height)
new_height <- ifelse(new_height < 1, 1, new_height)
knitr::opts_chunk$set(fig.height = new_height)
}
wrap_at <- knitr::opts_chunk$get("fig.width") * 10# todo: if there are free-text choices mingled in with the pre-defined ones, don't show
# todo: show rare items if they are pre-defined
# todo: bin rare responses into "other category"
if (!length(item_nomiss)) {
cat("No non-missing values to show.")
} else if (is.numeric(item_nomiss) || dplyr::n_distinct(item_nomiss) < 20) {
plot_labelled(item_nomiss, item_name, wrap_at, go_vertical)
} else {
cat(dplyr::n_distinct(item_nomiss), " unique, categorical values, so not shown.")
}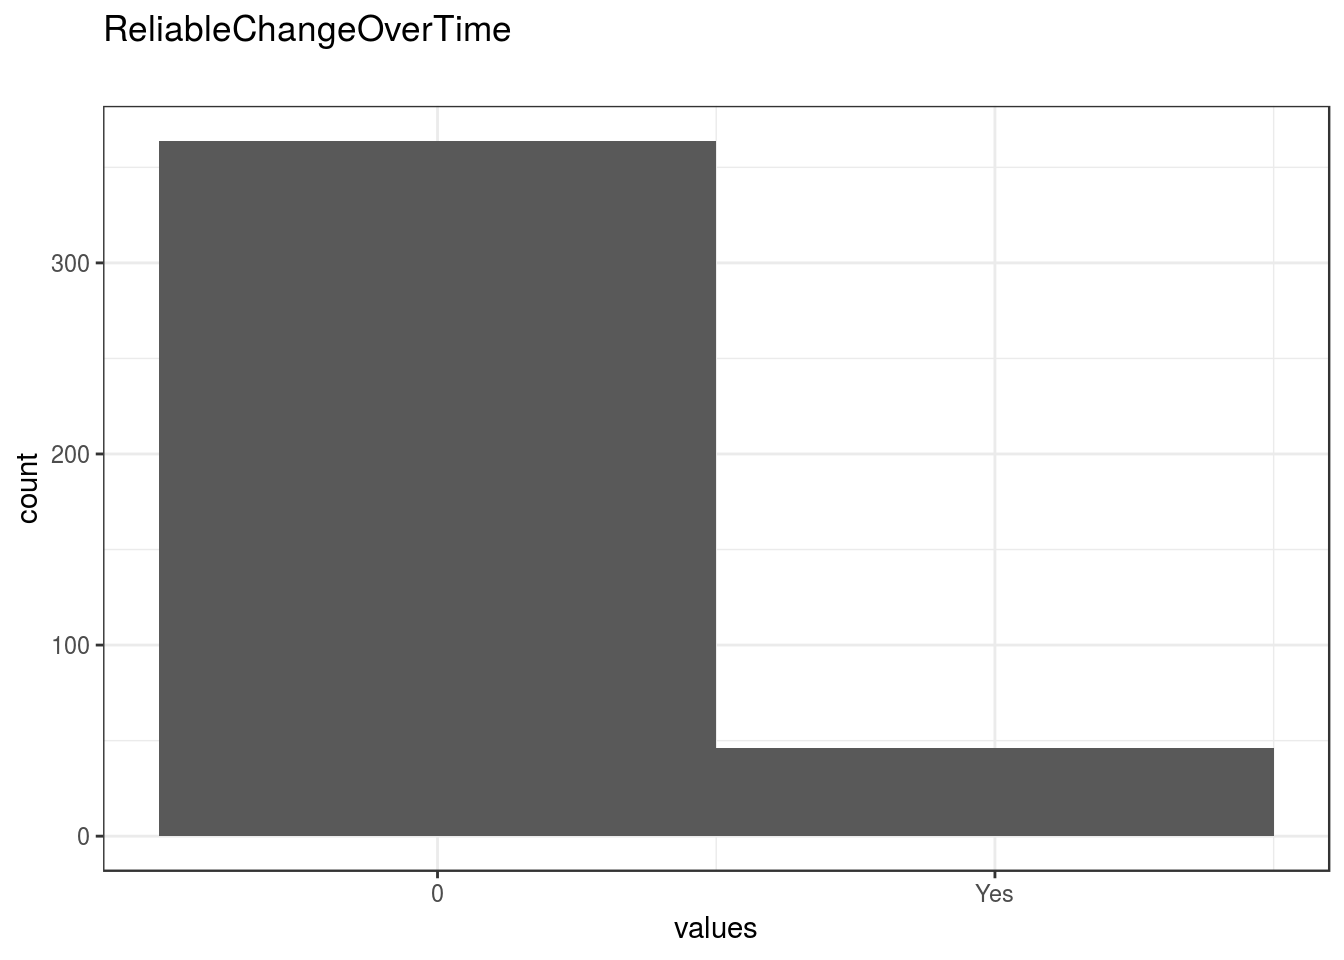
knitr::opts_chunk$set(fig.height = old_height)0 missing values.
Summary statistics
attributes(item) <- item_attributes
df = data.frame(item, stringsAsFactors = FALSE)
names(df) = html_item_name
escaped_table(codebook_table(df))| name | data_type | value_labels | missing | complete | n | mean | sd | p0 | p25 | p50 | p75 | p100 | hist | format.spss | display_width |
|---|---|---|---|---|---|---|---|---|---|---|---|---|---|---|---|
| ReliableChangeOverTime | numeric | 1. Yes | 0 | 410 | 410 | 0.11 | 0.32 | 0 | 0 | 0 | 0 | 1 | ▇▁▁▁▁▁▁▁ | F8.0 | 12 |
if (show_missing_values) {
plot_labelled(missing_values, item_name, wrap_at)
}if (!is.null(item_info)) {
# don't show choices again, if they're basically same thing as value labels
if (!is.null(choices) && !is.null(item_info$choices) &&
all(names(na.omit(choices)) == item_info$choices) &&
all(na.omit(choices) == names(item_info$choices))) {
item_info$choices <- NULL
}
item_info$label_parsed <-
item_info$choice_list <- item_info$study_id <- item_info$id <- NULL
pander::pander(item_info)
}Value labels
if (!is.null(choices) && length(choices) && length(choices) < 30) {
    pander::pander(as.list(choices))
}- Yes: 1
ReliableChangeOverTime_AND_BelowPCLCutoff
0
Distribution
show_missing_values <- FALSE
if (has_labels(item)) {
  missing_values <- item[is.na(haven::zap_missing(item))]
  attributes(missing_values) <- attributes(item)
  if (!is.null(attributes(item)$labels)) {
    attributes(missing_values)$labels <- attributes(missing_values)$labels[is.na(attributes(missing_values)$labels)]
    attributes(item)$labels <- attributes(item)$labels[!is.na(attributes(item)$labels)]
  }
  if (is.double(item)) {
    show_missing_values <- length(unique(haven::na_tag(missing_values))) > 1
    item <- haven::zap_missing(item)
  }
  if (length(item_attributes$labels) == 0 && is.numeric(item)) {
    item <- haven::zap_labels(item)
  }
}
item_nomiss <- item[!is.na(item)]

# unnest mc_multiple and so on
if (
  is.character(item_nomiss) &&
  stringr::str_detect(item_nomiss, stringr::fixed(", ")) &&
  (exists("type", item_info) &&
    stringr::str_detect(item_info$type, pattern = stringr::fixed("multiple")))
  ) {
  item_nomiss <- unlist(stringr::str_split(item_nomiss, pattern = stringr::fixed(", ")))
}
attributes(item_nomiss) <- attributes(item)

old_height <- knitr::opts_chunk$get("fig.height")
non_missing_choices <- item_attributes[["labels"]]
many_labels <- length(non_missing_choices) > 7
go_vertical <- !is.numeric(item_nomiss) || many_labels
if ( go_vertical ) {
  # numeric items are plotted horizontally (because that's what usually expected)
  # categorical items are plotted vertically because we can use the screen real estate better this way

    if (is.null(choices) ||
        dplyr::n_distinct(item_nomiss) > length(non_missing_choices)) {
        non_missing_choices <- unique(item_nomiss)
        names(non_missing_choices) <- non_missing_choices
    }
  choice_multiplier <- old_height/6.5
    new_height <- 2 + choice_multiplier * length(non_missing_choices)
    new_height <- ifelse(new_height > 20, 20, new_height)
    new_height <- ifelse(new_height < 1, 1, new_height)
    knitr::opts_chunk$set(fig.height = new_height)
}

wrap_at <- knitr::opts_chunk$get("fig.width") * 10
# todo: if there are free-text choices mingled in with the pre-defined ones, don't show
# todo: show rare items if they are pre-defined
# todo: bin rare responses into "other category"
if (!length(item_nomiss)) {
cat("No non-missing values to show.")
} else if (is.numeric(item_nomiss) || dplyr::n_distinct(item_nomiss) < 20) {
plot_labelled(item_nomiss, item_name, wrap_at, go_vertical)
} else {
cat(dplyr::n_distinct(item_nomiss), " unique, categorical values, so not shown.")
}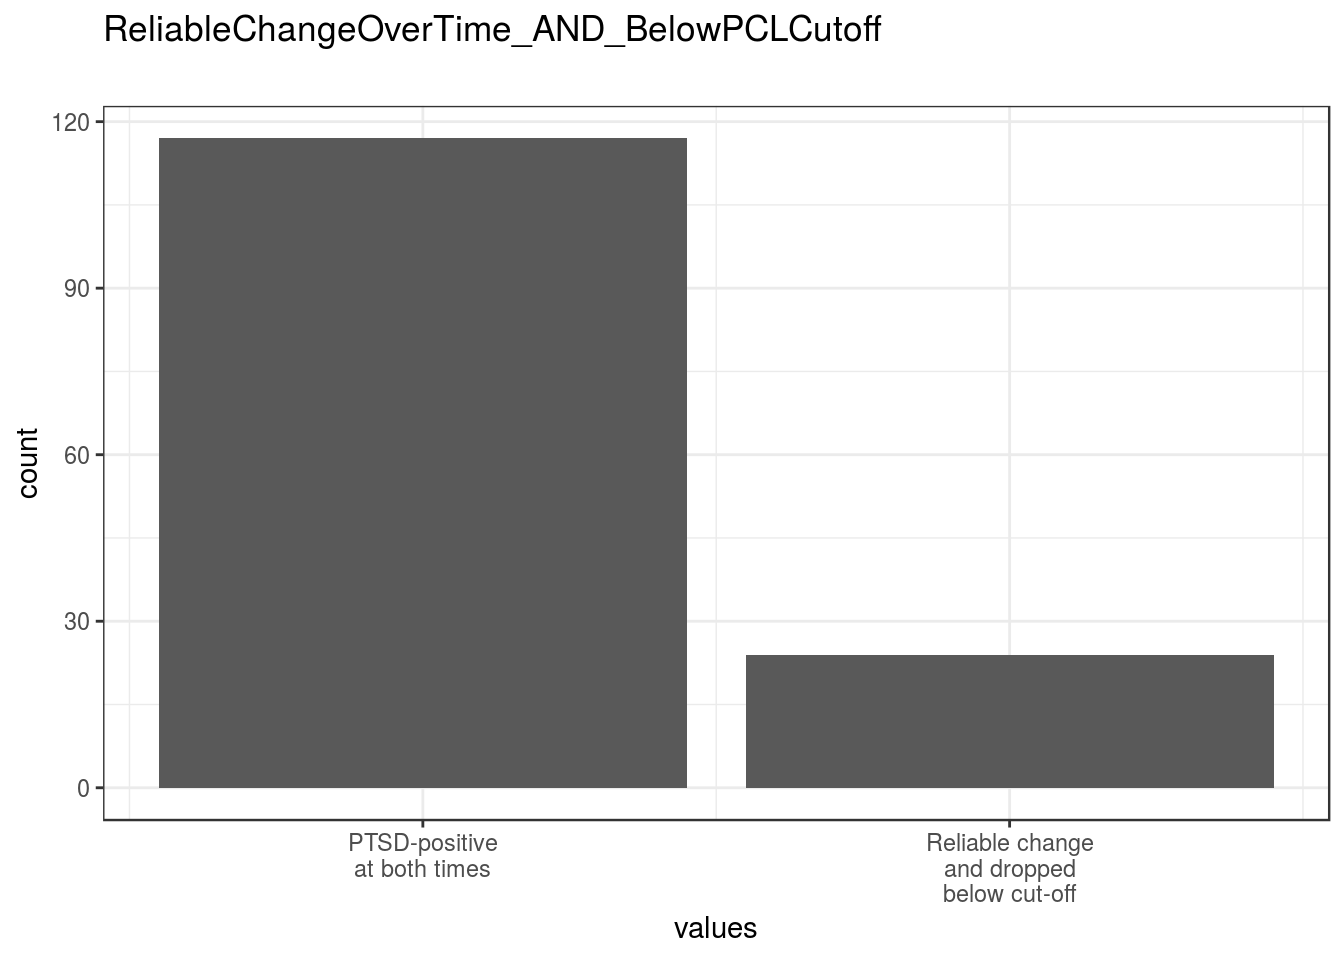
knitr::opts_chunk$set(fig.height = old_height)269 missing values.
Summary statistics
attributes(item) <- item_attributes
df = data.frame(item, stringsAsFactors = FALSE)
names(df) = html_item_name
escaped_table(codebook_table(df))| name | data_type | value_labels | missing | complete | n | mean | sd | p0 | p25 | p50 | p75 | p100 | hist | format.spss | display_width |
|---|---|---|---|---|---|---|---|---|---|---|---|---|---|---|---|
| ReliableChangeOverTime_AND_BelowPCLCutoff | numeric | 0. PTSD-positive at both times, 1. Reliable change and dropped below cut-off |
269 | 141 | 410 | 0.17 | 0.38 | 0 | 0 | 0 | 0 | 1 | ▇▁▁▁▁▁▁▂ | F8.0 | 18 |
if (show_missing_values) {
  plot_labelled(missing_values, item_name, wrap_at)
}
if (!is.null(item_info)) {
# don't show choices again, if they're basically same thing as value labels
if (!is.null(choices) && !is.null(item_info$choices) &&
all(names(na.omit(choices)) == item_info$choices) &&
all(na.omit(choices) == names(item_info$choices))) {
item_info$choices <- NULL
}
item_info$label_parsed <-
item_info$choice_list <- item_info$study_id <- item_info$id <- NULL
pander::pander(item_info)
}Value labels
if (!is.null(choices) && length(choices) && length(choices) < 30) {
    pander::pander(as.list(choices))
}- PTSD-positive at both times: 0
- Reliable change and dropped below cut-off: 1
missingness_reportMissingness report
Among those who finished the survey. Only variables that have missing values are shown.
if (  exists("ended", results) &&
  exists("expired", results)) {
  finisher_results <- dplyr::filter(results, !is.na(.data$ended))
} else {
  finisher_results <- results
  warning("Could not figure out who finished the surveys, because the ",
          "variables expired and ended were missing.")
}
## Warning: Could not figure out who finished the surveys, because the
## variables expired and ended were missing.if (length(md_pattern)) {
pander::pander(md_pattern)
}| description | ReliableChangeOverTime_AND_BelowPCLCutoff | var_miss | n_miss |
|---|---|---|---|
| Missing values in 1 variables | 0 | 1 | 269 |
| Missing values per variable | 269 | 269 | 269 |
| Missing values in 0 variables | 1 | 0 | 141 |
itemsCodebook table
export_table(metadata_table)jsonld