Codebook
knitr::opts_chunk$set(
  warning = FALSE, # show warnings during codebook generation
  message = FALSE, # show messages during codebook generation
  error = TRUE, # do not interrupt codebook generation in case of errors,
                # usually better for debugging
  echo = TRUE  # show R code
)
ggplot2::theme_set(ggplot2::theme_bw())
pander::panderOptions("table.split.table", Inf)
knit_by_pkgdown <- !is.null(knitr::opts_chunk$get("fig.retina"))
pander::panderOptions("table.split.table", Inf)
ggplot2::theme_set(ggplot2::theme_bw())
knitr::opts_chunk$set(warning = TRUE, message = TRUE, error = TRUE, echo = TRUE)
tetris <- rio::import("https://osf.io/xmd67/download", "sav")codebook_data <- tetris
#
# var_label(codebook_data) <- dict %>% select(Variable, Label) %>% dict_to_list()
# omit the following lines, if your missing values are already properly labelled
codebook_data <- detect_missing(codebook_data,
only_labelled = TRUE, # only labelled values are autodetected as
# missing
negative_values_are_missing = FALSE, # negative values are missing values
ninety_nine_problems = TRUE, # 99/999 are missing values, if they
# are more than 5 MAD from the median
)
# If you are not using formr, the codebook package needs to guess which items
# form a scale. The following line finds item aggregates with names like this:
# scale = scale_1 + scale_2R + scale_3R
# identifying these aggregates allows the codebook function to
# automatically compute reliabilities.
# However, it will not reverse items automatically.
codebook_data <- detect_scales(codebook_data)metadata(codebook_data)$name <- "Trauma, Treatment and Tetris: video gaming increases hippocampal volume in combat-related post-traumatic stress disorder"
metadata(codebook_data)$description <- paste0("
### Download link
[Open Science Framework](https://osf.io/xmd67/download)
")
metadata(codebook_data)$identifier <- "https://osf.io/xz32u/"
metadata(codebook_data)$datePublished <- "2018-02-07"
metadata(codebook_data)$contributors <- list(
"Oisin Butler ")
metadata(codebook_data)$url <- "https://osf.io/xmd67/"
metadata(codebook_data)$temporalCoverage <- "2018"
metadata(codebook_data)$distribution = list(
list("@type" = "DataDownload",
"requiresSubscription" = "http://schema.org/True",
"encodingFormat" = "https://www.loc.gov/preservation/digital/formats/fdd/fdd000469.shtml",
contentUrl = "https://osf.io/xmd67/download")
)codebook(codebook_data)knitr::asis_output(data_info)Metadata
Description
if (exists("name", meta)) {
  glue::glue(
    "__Dataset name__: {name}",
    .envir = meta)
}
Dataset name: Trauma, Treatment and Tetris: video gaming increases hippocampal volume in combat-related post-traumatic stress disorder
cat(description)Download link
Temporal Coverage: 2018
- URL: https://osf.io/xmd67/
- Identifier: https://osf.io/xz32u/
Date published: 2018-02-07
meta <- meta[setdiff(names(meta),
                     c("creator", "datePublished", "identifier",
                       "url", "citation", "spatialCoverage",
                       "temporalCoverage", "description", "name"))]
pander::pander(meta)contributors:
- Oisin Butler
distribution:
   * **@type**: DataDownload
   * **requiresSubscription**: http://schema.org/True
   * **encodingFormat**: https://www.loc.gov/preservation/digital/formats/fdd/fdd000469.shtml
   * **contentUrl**: https://osf.io/xmd67/download
keywords: ID, Group, Gender, Age_Years, No_Deployments, Days_Deployments, CES_SUM_Score, Days_Therapy, Number_EMDR_Session, TETRIS_average_time_per_days, TETRIS_no_days_missed, Interval_Pre_Post, Interval_Post_Follow_Up, TIV, Pre_Cat12_Hippocampus, Post_Pre_Cat12_Hippocampus, Pre_Anatomical_Hippocampus, Post_Anatomical_Hippocampus, Pre_MetaAnalysis_Hippocampus, Post_MetaAnalysis_Hippocampus, Cat12_Hippocampus_Change, Anatomical_Hippocampus_Change, MetaAnalysis_Hippocampus_Change, PDS_Sum_Pre, PDS_Sum_Post, PDS_Sum_Follow_Up, BDI_Pre, BDI_Post, BDI_Follow_Up, STAI_Trait_Pre, STAI_Trait_Post, STAI_Trait_Follow_Up, PDS_Change, BDI_Change and STAI_Trait_Change
knitr::asis_output(survey_overview)Variables
knitr::asis_output(paste0(scales_items, sep = "\n\n\n", collapse = "\n\n\n"))ID
Participant ID
Distribution
show_missing_values <- FALSE
if (has_labels(item)) {
  missing_values <- item[is.na(haven::zap_missing(item))]
  attributes(missing_values) <- attributes(item)
  if (!is.null(attributes(item)$labels)) {
    attributes(missing_values)$labels <- attributes(missing_values)$labels[is.na(attributes(missing_values)$labels)]
    attributes(item)$labels <- attributes(item)$labels[!is.na(attributes(item)$labels)]
  }
  if (is.double(item)) {
    show_missing_values <- length(unique(haven::na_tag(missing_values))) > 1
    item <- haven::zap_missing(item)
  }
  if (length(item_attributes$labels) == 0 && is.numeric(item)) {
    item <- haven::zap_labels(item)
  }
}
item_nomiss <- item[!is.na(item)]

# unnest mc_multiple and so on
if (
  is.character(item_nomiss) &&
  stringr::str_detect(item_nomiss, stringr::fixed(", ")) &&
  (exists("type", item_info) &&
    stringr::str_detect(item_info$type, pattern = stringr::fixed("multiple")))
  ) {
  item_nomiss <- unlist(stringr::str_split(item_nomiss, pattern = stringr::fixed(", ")))
}
attributes(item_nomiss) <- attributes(item)

old_height <- knitr::opts_chunk$get("fig.height")
non_missing_choices <- item_attributes[["labels"]]
many_labels <- length(non_missing_choices) > 7
go_vertical <- !is.numeric(item_nomiss) || many_labels
if ( go_vertical ) {
  # numeric items are plotted horizontally (because that's what usually expected)
  # categorical items are plotted vertically because we can use the screen real estate better this way

    if (is.null(choices) ||
        dplyr::n_distinct(item_nomiss) > length(non_missing_choices)) {
        non_missing_choices <- unique(item_nomiss)
        names(non_missing_choices) <- non_missing_choices
    }
  choice_multiplier <- old_height/6.5
    new_height <- 2 + choice_multiplier * length(non_missing_choices)
    new_height <- ifelse(new_height > 20, 20, new_height)
    new_height <- ifelse(new_height < 1, 1, new_height)
    knitr::opts_chunk$set(fig.height = new_height)
}

wrap_at <- knitr::opts_chunk$get("fig.width") * 10
# todo: if there are free-text choices mingled in with the pre-defined ones, don't show
# todo: show rare items if they are pre-defined
# todo: bin rare responses into "other category"
if (!length(item_nomiss)) {
cat("No non-missing values to show.")
} else if (is.numeric(item_nomiss) || dplyr::n_distinct(item_nomiss) < 20) {
plot_labelled(item_nomiss, item_name, wrap_at, go_vertical)
} else {
cat(dplyr::n_distinct(item_nomiss), " unique, categorical values, so not shown.")
}## 40 unique, categorical values, so not shown.knitr::opts_chunk$set(fig.height = old_height)0 missing values.
Summary statistics
attributes(item) <- item_attributes
df = data.frame(item, stringsAsFactors = FALSE)
names(df) = html_item_name
escaped_table(codebook_table(df))| name | label | data_type | missing | complete | n | empty | n_unique | min | max | format.spss | display_width |
|---|---|---|---|---|---|---|---|---|---|---|---|
| ID | Participant ID | character | 0 | 40 | 40 | 0 | 40 | 6 | 6 | A10 | 10 |
if (show_missing_values) {
  plot_labelled(missing_values, item_name, wrap_at)
}
if (!is.null(item_info)) {
# don't show choices again, if they're basically same thing as value labels
if (!is.null(choices) && !is.null(item_info$choices) &&
all(names(na.omit(choices)) == item_info$choices) &&
all(na.omit(choices) == names(item_info$choices))) {
item_info$choices <- NULL
}
item_info$label_parsed <-
item_info$choice_list <- item_info$study_id <- item_info$id <- NULL
pander::pander(item_info)
}if (!is.null(choices) && length(choices) && length(choices) < 30) {
pander::pander(as.list(choices))
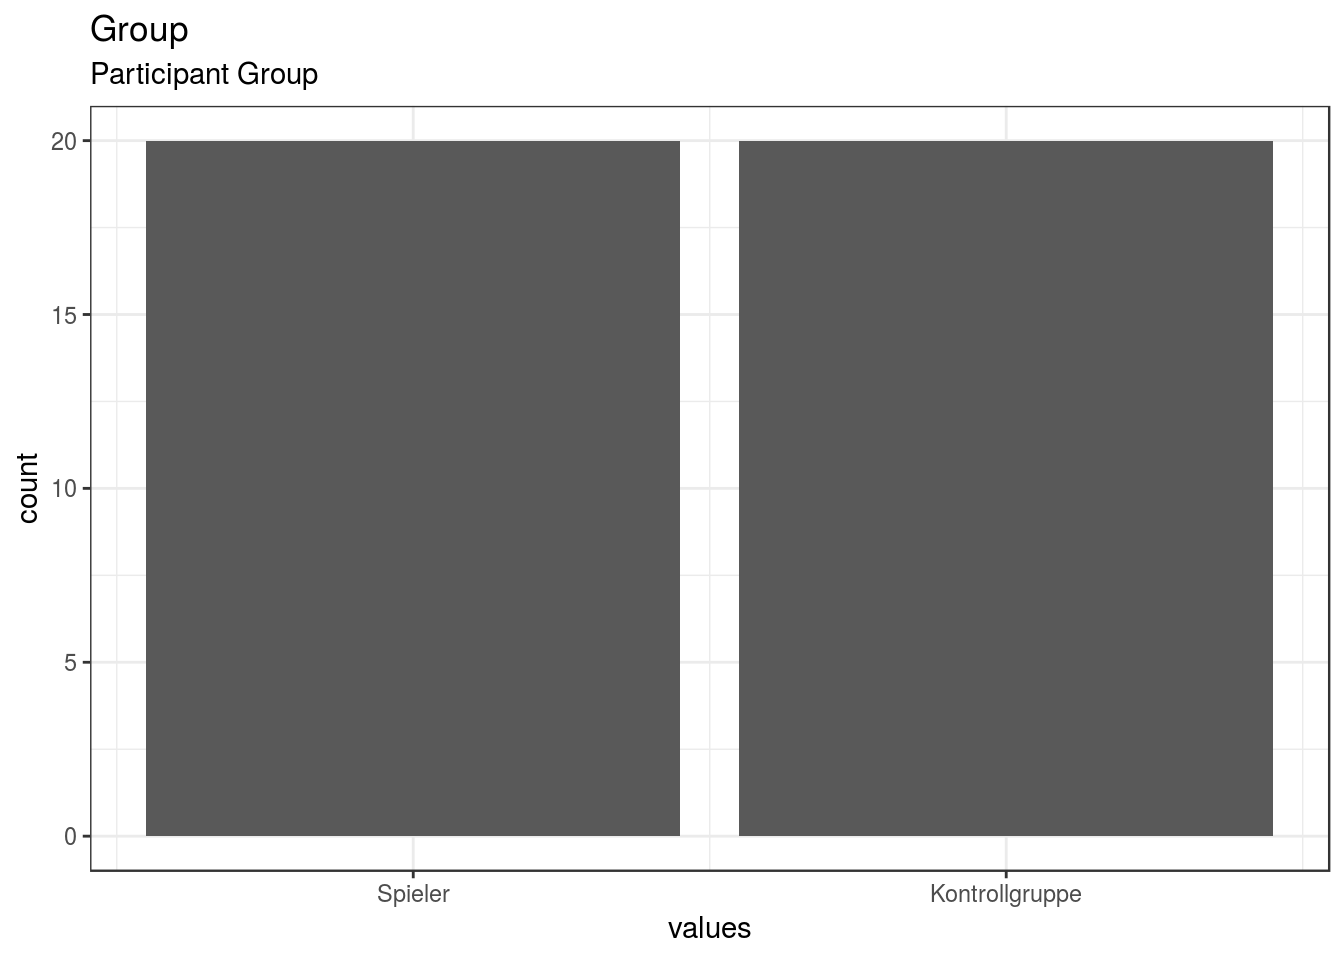
}Group
Participant Group
Distribution
show_missing_values <- FALSE
if (has_labels(item)) {
missing_values <- item[is.na(haven::zap_missing(item))]
attributes(missing_values) <- attributes(item)
if (!is.null(attributes(item)$labels)) {
attributes(missing_values)$labels <- attributes(missing_values)$labels[is.na(attributes(missing_values)$labels)]
attributes(item)$labels <- attributes(item)$labels[!is.na(attributes(item)$labels)]
}
if (is.double(item)) {
show_missing_values <- length(unique(haven::na_tag(missing_values))) > 1
item <- haven::zap_missing(item)
}
if (length(item_attributes$labels) == 0 && is.numeric(item)) {
item <- haven::zap_labels(item)
}
}
item_nomiss <- item[!is.na(item)]
# unnest mc_multiple and so on
if (
is.character(item_nomiss) &&
stringr::str_detect(item_nomiss, stringr::fixed(", ")) &&
(exists("type", item_info) &&
stringr::str_detect(item_info$type, pattern = stringr::fixed("multiple")))
) {
item_nomiss <- unlist(stringr::str_split(item_nomiss, pattern = stringr::fixed(", ")))
}
attributes(item_nomiss) <- attributes(item)
old_height <- knitr::opts_chunk$get("fig.height")
non_missing_choices <- item_attributes[["labels"]]
many_labels <- length(non_missing_choices) > 7
go_vertical <- !is.numeric(item_nomiss) || many_labels
if ( go_vertical ) {
# numeric items are plotted horizontally (because that's what usually expected)
# categorical items are plotted vertically because we can use the screen real estate better this way
if (is.null(choices) ||
dplyr::n_distinct(item_nomiss) > length(non_missing_choices)) {
non_missing_choices <- unique(item_nomiss)
names(non_missing_choices) <- non_missing_choices
}
choice_multiplier <- old_height/6.5
new_height <- 2 + choice_multiplier * length(non_missing_choices)
new_height <- ifelse(new_height > 20, 20, new_height)
new_height <- ifelse(new_height < 1, 1, new_height)
knitr::opts_chunk$set(fig.height = new_height)
}
wrap_at <- knitr::opts_chunk$get("fig.width") * 10# todo: if there are free-text choices mingled in with the pre-defined ones, don't show
# todo: show rare items if they are pre-defined
# todo: bin rare responses into "other category"
if (!length(item_nomiss)) {
cat("No non-missing values to show.")
} else if (is.numeric(item_nomiss) || dplyr::n_distinct(item_nomiss) < 20) {
plot_labelled(item_nomiss, item_name, wrap_at, go_vertical)
} else {
cat(dplyr::n_distinct(item_nomiss), " unique, categorical values, so not shown.")
}
knitr::opts_chunk$set(fig.height = old_height)0 missing values.
Summary statistics
attributes(item) <- item_attributes
df = data.frame(item, stringsAsFactors = FALSE)
names(df) = html_item_name
escaped_table(codebook_table(df))| name | label | data_type | value_labels | missing | complete | n | mean | sd | p0 | p25 | p50 | p75 | p100 | hist | format.spss | display_width |
|---|---|---|---|---|---|---|---|---|---|---|---|---|---|---|---|---|
| Group | Participant Group | numeric | 1. Spieler, 2. Kontrollgruppe |
0 | 40 | 40 | 1.5 | 0.51 | 1 | 1 | 1.5 | 2 | 2 | ▇▁▁▁▁▁▁▇ | F6.2 | 27 |
if (show_missing_values) {
plot_labelled(missing_values, item_name, wrap_at)
}if (!is.null(item_info)) {
# don't show choices again, if they're basically same thing as value labels
if (!is.null(choices) && !is.null(item_info$choices) &&
all(names(na.omit(choices)) == item_info$choices) &&
all(na.omit(choices) == names(item_info$choices))) {
item_info$choices <- NULL
}
item_info$label_parsed <-
item_info$choice_list <- item_info$study_id <- item_info$id <- NULL
pander::pander(item_info)
}Value labels
if (!is.null(choices) && length(choices) && length(choices) < 30) {
    pander::pander(as.list(choices))
}- Spieler: 1
- Kontrollgruppe: 2
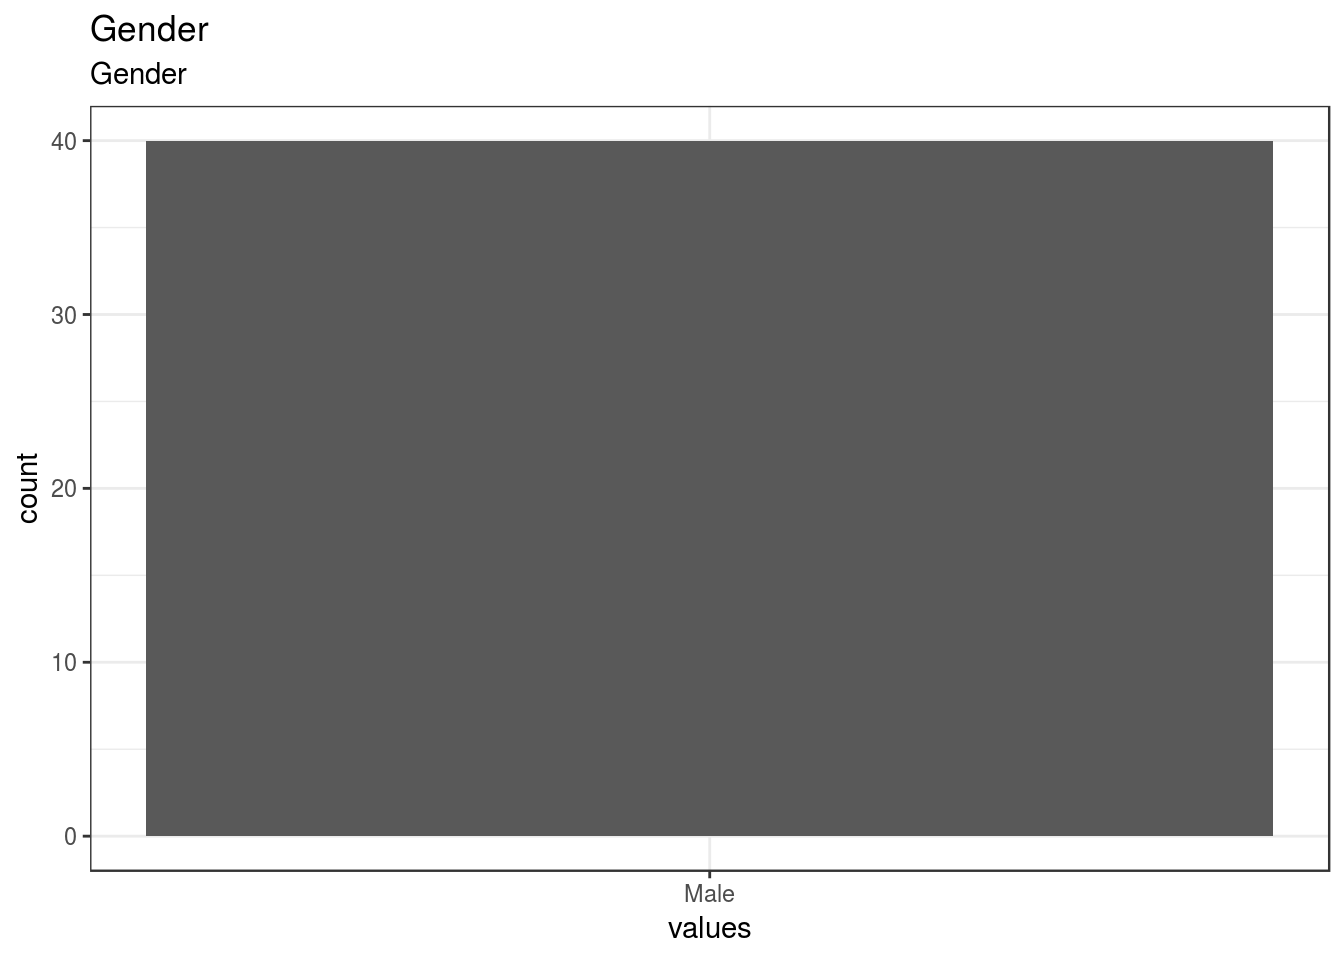
Gender
Gender
Distribution
show_missing_values <- FALSE
if (has_labels(item)) {
  missing_values <- item[is.na(haven::zap_missing(item))]
  attributes(missing_values) <- attributes(item)
  if (!is.null(attributes(item)$labels)) {
    attributes(missing_values)$labels <- attributes(missing_values)$labels[is.na(attributes(missing_values)$labels)]
    attributes(item)$labels <- attributes(item)$labels[!is.na(attributes(item)$labels)]
  }
  if (is.double(item)) {
    show_missing_values <- length(unique(haven::na_tag(missing_values))) > 1
    item <- haven::zap_missing(item)
  }
  if (length(item_attributes$labels) == 0 && is.numeric(item)) {
    item <- haven::zap_labels(item)
  }
}
item_nomiss <- item[!is.na(item)]

# unnest mc_multiple and so on
if (
  is.character(item_nomiss) &&
  stringr::str_detect(item_nomiss, stringr::fixed(", ")) &&
  (exists("type", item_info) &&
    stringr::str_detect(item_info$type, pattern = stringr::fixed("multiple")))
  ) {
  item_nomiss <- unlist(stringr::str_split(item_nomiss, pattern = stringr::fixed(", ")))
}
attributes(item_nomiss) <- attributes(item)

old_height <- knitr::opts_chunk$get("fig.height")
non_missing_choices <- item_attributes[["labels"]]
many_labels <- length(non_missing_choices) > 7
go_vertical <- !is.numeric(item_nomiss) || many_labels
if ( go_vertical ) {
  # numeric items are plotted horizontally (because that's what usually expected)
  # categorical items are plotted vertically because we can use the screen real estate better this way

    if (is.null(choices) ||
        dplyr::n_distinct(item_nomiss) > length(non_missing_choices)) {
        non_missing_choices <- unique(item_nomiss)
        names(non_missing_choices) <- non_missing_choices
    }
  choice_multiplier <- old_height/6.5
    new_height <- 2 + choice_multiplier * length(non_missing_choices)
    new_height <- ifelse(new_height > 20, 20, new_height)
    new_height <- ifelse(new_height < 1, 1, new_height)
    knitr::opts_chunk$set(fig.height = new_height)
}

wrap_at <- knitr::opts_chunk$get("fig.width") * 10
# todo: if there are free-text choices mingled in with the pre-defined ones, don't show
# todo: show rare items if they are pre-defined
# todo: bin rare responses into "other category"
if (!length(item_nomiss)) {
cat("No non-missing values to show.")
} else if (is.numeric(item_nomiss) || dplyr::n_distinct(item_nomiss) < 20) {
plot_labelled(item_nomiss, item_name, wrap_at, go_vertical)
} else {
cat(dplyr::n_distinct(item_nomiss), " unique, categorical values, so not shown.")
}
knitr::opts_chunk$set(fig.height = old_height)0 missing values.
Summary statistics
attributes(item) <- item_attributes
df = data.frame(item, stringsAsFactors = FALSE)
names(df) = html_item_name
escaped_table(codebook_table(df))| name | label | data_type | value_labels | missing | complete | n | mean | sd | p0 | p25 | p50 | p75 | p100 | hist | format.spss |
|---|---|---|---|---|---|---|---|---|---|---|---|---|---|---|---|
| Gender | Gender | numeric | 1. Male, NA. [2] Female |
0 | 40 | 40 | 1 | 0 | 1 | 1 | 1 | 1 | 1 | ▁▁▁▇▁▁▁▁ | F8.2 |
if (show_missing_values) {
  plot_labelled(missing_values, item_name, wrap_at)
}
if (!is.null(item_info)) {
# don't show choices again, if they're basically same thing as value labels
if (!is.null(choices) && !is.null(item_info$choices) &&
all(names(na.omit(choices)) == item_info$choices) &&
all(na.omit(choices) == names(item_info$choices))) {
item_info$choices <- NULL
}
item_info$label_parsed <-
item_info$choice_list <- item_info$study_id <- item_info$id <- NULL
pander::pander(item_info)
}Value labels
if (!is.null(choices) && length(choices) && length(choices) < 30) {
    pander::pander(as.list(choices))
}- Male: 1
- [2] Female: NA
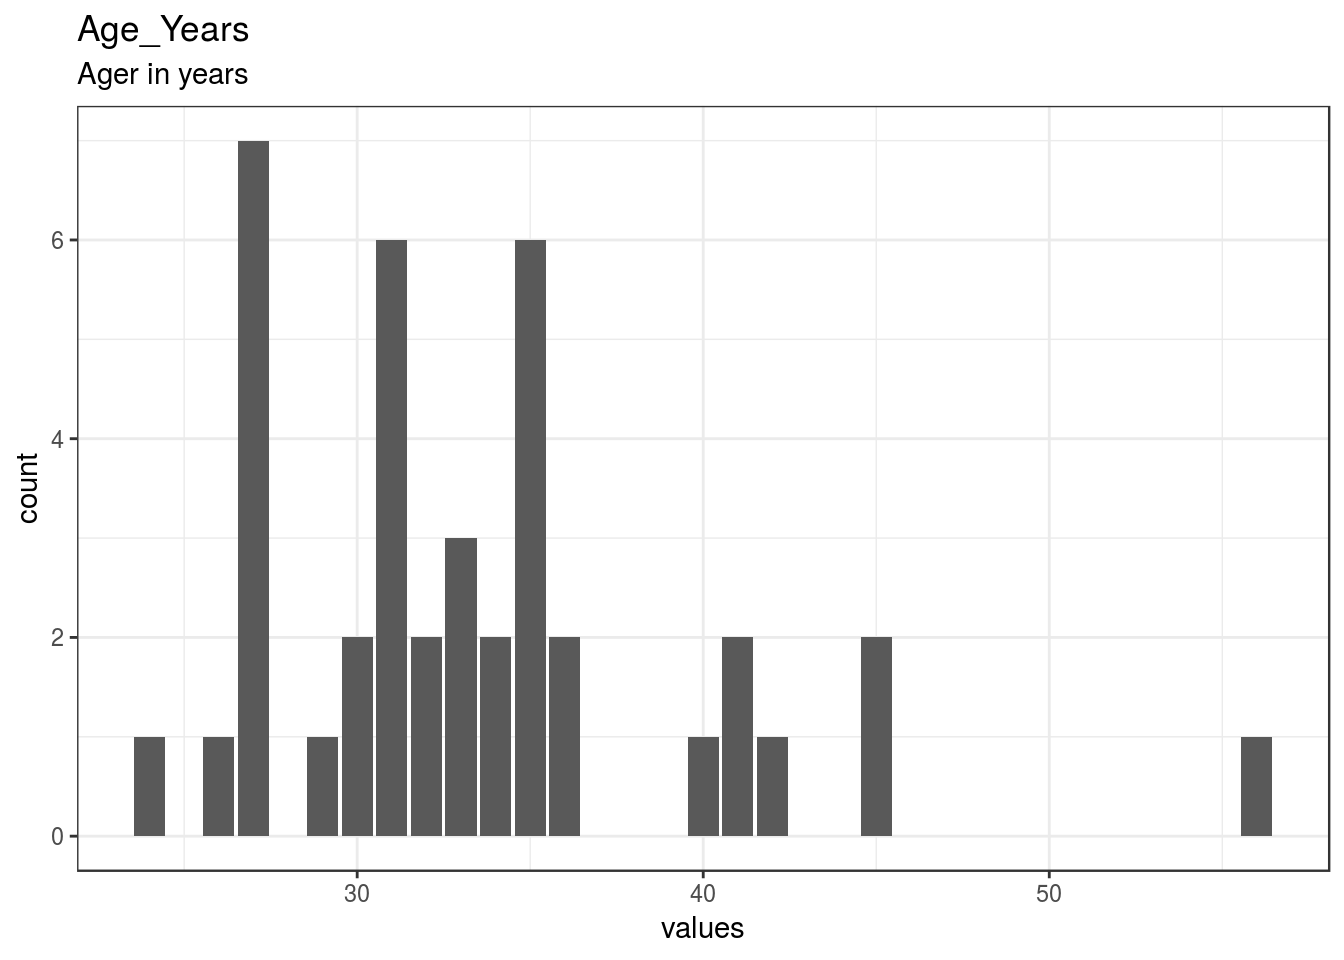
Age_Years
Ager in years
Distribution
show_missing_values <- FALSE
if (has_labels(item)) {
  missing_values <- item[is.na(haven::zap_missing(item))]
  attributes(missing_values) <- attributes(item)
  if (!is.null(attributes(item)$labels)) {
    attributes(missing_values)$labels <- attributes(missing_values)$labels[is.na(attributes(missing_values)$labels)]
    attributes(item)$labels <- attributes(item)$labels[!is.na(attributes(item)$labels)]
  }
  if (is.double(item)) {
    show_missing_values <- length(unique(haven::na_tag(missing_values))) > 1
    item <- haven::zap_missing(item)
  }
  if (length(item_attributes$labels) == 0 && is.numeric(item)) {
    item <- haven::zap_labels(item)
  }
}
item_nomiss <- item[!is.na(item)]

# unnest mc_multiple and so on
if (
  is.character(item_nomiss) &&
  stringr::str_detect(item_nomiss, stringr::fixed(", ")) &&
  (exists("type", item_info) &&
    stringr::str_detect(item_info$type, pattern = stringr::fixed("multiple")))
  ) {
  item_nomiss <- unlist(stringr::str_split(item_nomiss, pattern = stringr::fixed(", ")))
}
attributes(item_nomiss) <- attributes(item)

old_height <- knitr::opts_chunk$get("fig.height")
non_missing_choices <- item_attributes[["labels"]]
many_labels <- length(non_missing_choices) > 7
go_vertical <- !is.numeric(item_nomiss) || many_labels
if ( go_vertical ) {
  # numeric items are plotted horizontally (because that's what usually expected)
  # categorical items are plotted vertically because we can use the screen real estate better this way

    if (is.null(choices) ||
        dplyr::n_distinct(item_nomiss) > length(non_missing_choices)) {
        non_missing_choices <- unique(item_nomiss)
        names(non_missing_choices) <- non_missing_choices
    }
  choice_multiplier <- old_height/6.5
    new_height <- 2 + choice_multiplier * length(non_missing_choices)
    new_height <- ifelse(new_height > 20, 20, new_height)
    new_height <- ifelse(new_height < 1, 1, new_height)
    knitr::opts_chunk$set(fig.height = new_height)
}

wrap_at <- knitr::opts_chunk$get("fig.width") * 10
# todo: if there are free-text choices mingled in with the pre-defined ones, don't show
# todo: show rare items if they are pre-defined
# todo: bin rare responses into "other category"
if (!length(item_nomiss)) {
cat("No non-missing values to show.")
} else if (is.numeric(item_nomiss) || dplyr::n_distinct(item_nomiss) < 20) {
plot_labelled(item_nomiss, item_name, wrap_at, go_vertical)
} else {
cat(dplyr::n_distinct(item_nomiss), " unique, categorical values, so not shown.")
}
knitr::opts_chunk$set(fig.height = old_height)0 missing values.
Summary statistics
attributes(item) <- item_attributes
df = data.frame(item, stringsAsFactors = FALSE)
names(df) = html_item_name
escaped_table(codebook_table(df))| name | label | data_type | missing | complete | n | mean | sd | p0 | p25 | p50 | p75 | p100 | hist | format.spss | display_width |
|---|---|---|---|---|---|---|---|---|---|---|---|---|---|---|---|
| Age_Years | Ager in years | numeric | 0 | 40 | 40 | 33.42 | 6.31 | 24 | 29.75 | 32.5 | 35 | 56 | ▆▇▇▁▂▁▁▁ | F6.0 | 6 |
if (show_missing_values) {
  plot_labelled(missing_values, item_name, wrap_at)
}
if (!is.null(item_info)) {
# don't show choices again, if they're basically same thing as value labels
if (!is.null(choices) && !is.null(item_info$choices) &&
all(names(na.omit(choices)) == item_info$choices) &&
all(na.omit(choices) == names(item_info$choices))) {
item_info$choices <- NULL
}
item_info$label_parsed <-
item_info$choice_list <- item_info$study_id <- item_info$id <- NULL
pander::pander(item_info)
}if (!is.null(choices) && length(choices) && length(choices) < 30) {
pander::pander(as.list(choices))
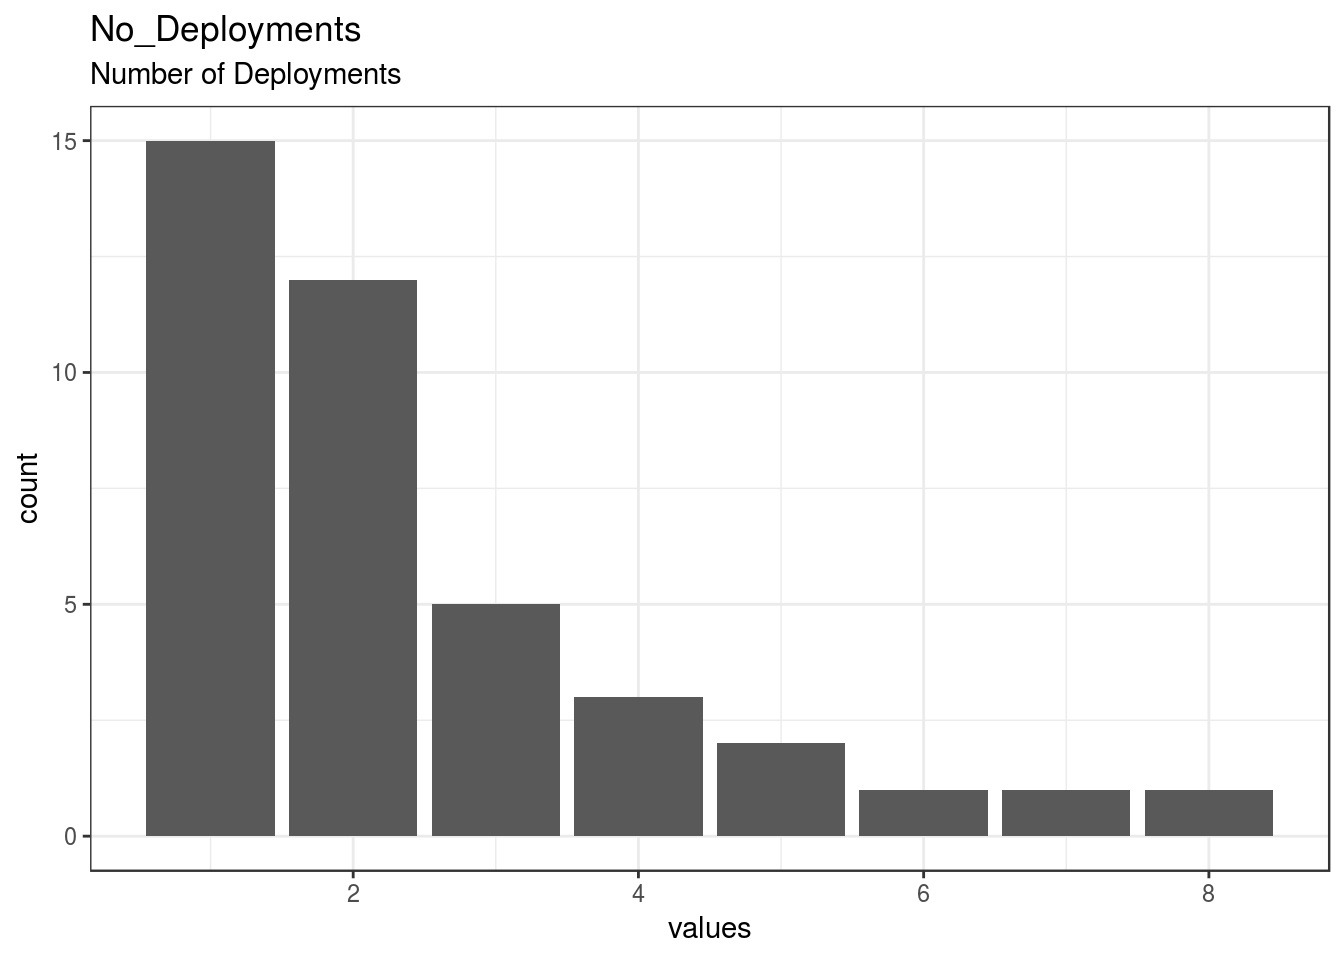
}No_Deployments
Number of Deployments
Distribution
show_missing_values <- FALSE
if (has_labels(item)) {
missing_values <- item[is.na(haven::zap_missing(item))]
attributes(missing_values) <- attributes(item)
if (!is.null(attributes(item)$labels)) {
attributes(missing_values)$labels <- attributes(missing_values)$labels[is.na(attributes(missing_values)$labels)]
attributes(item)$labels <- attributes(item)$labels[!is.na(attributes(item)$labels)]
}
if (is.double(item)) {
show_missing_values <- length(unique(haven::na_tag(missing_values))) > 1
item <- haven::zap_missing(item)
}
if (length(item_attributes$labels) == 0 && is.numeric(item)) {
item <- haven::zap_labels(item)
}
}
item_nomiss <- item[!is.na(item)]
# unnest mc_multiple and so on
if (
is.character(item_nomiss) &&
stringr::str_detect(item_nomiss, stringr::fixed(", ")) &&
(exists("type", item_info) &&
stringr::str_detect(item_info$type, pattern = stringr::fixed("multiple")))
) {
item_nomiss <- unlist(stringr::str_split(item_nomiss, pattern = stringr::fixed(", ")))
}
attributes(item_nomiss) <- attributes(item)
old_height <- knitr::opts_chunk$get("fig.height")
non_missing_choices <- item_attributes[["labels"]]
many_labels <- length(non_missing_choices) > 7
go_vertical <- !is.numeric(item_nomiss) || many_labels
if ( go_vertical ) {
# numeric items are plotted horizontally (because that's what usually expected)
# categorical items are plotted vertically because we can use the screen real estate better this way
if (is.null(choices) ||
dplyr::n_distinct(item_nomiss) > length(non_missing_choices)) {
non_missing_choices <- unique(item_nomiss)
names(non_missing_choices) <- non_missing_choices
}
choice_multiplier <- old_height/6.5
new_height <- 2 + choice_multiplier * length(non_missing_choices)
new_height <- ifelse(new_height > 20, 20, new_height)
new_height <- ifelse(new_height < 1, 1, new_height)
knitr::opts_chunk$set(fig.height = new_height)
}
wrap_at <- knitr::opts_chunk$get("fig.width") * 10# todo: if there are free-text choices mingled in with the pre-defined ones, don't show
# todo: show rare items if they are pre-defined
# todo: bin rare responses into "other category"
if (!length(item_nomiss)) {
cat("No non-missing values to show.")
} else if (is.numeric(item_nomiss) || dplyr::n_distinct(item_nomiss) < 20) {
plot_labelled(item_nomiss, item_name, wrap_at, go_vertical)
} else {
cat(dplyr::n_distinct(item_nomiss), " unique, categorical values, so not shown.")
}
knitr::opts_chunk$set(fig.height = old_height)0 missing values.
Summary statistics
attributes(item) <- item_attributes
df = data.frame(item, stringsAsFactors = FALSE)
names(df) = html_item_name
escaped_table(codebook_table(df))| name | label | data_type | missing | complete | n | mean | sd | p0 | p25 | p50 | p75 | p100 | hist | format.spss | display_width |
|---|---|---|---|---|---|---|---|---|---|---|---|---|---|---|---|
| No_Deployments | Number of Deployments | numeric | 0 | 40 | 40 | 2.42 | 1.75 | 1 | 1 | 2 | 3 | 8 | ▇▆▂▂▁▁▁▁ | F6.0 | 15 |
if (show_missing_values) {
plot_labelled(missing_values, item_name, wrap_at)
}if (!is.null(item_info)) {
# don't show choices again, if they're basically same thing as value labels
if (!is.null(choices) && !is.null(item_info$choices) &&
all(names(na.omit(choices)) == item_info$choices) &&
all(na.omit(choices) == names(item_info$choices))) {
item_info$choices <- NULL
}
item_info$label_parsed <-
item_info$choice_list <- item_info$study_id <- item_info$id <- NULL
pander::pander(item_info)
}if (!is.null(choices) && length(choices) && length(choices) < 30) {
pander::pander(as.list(choices))
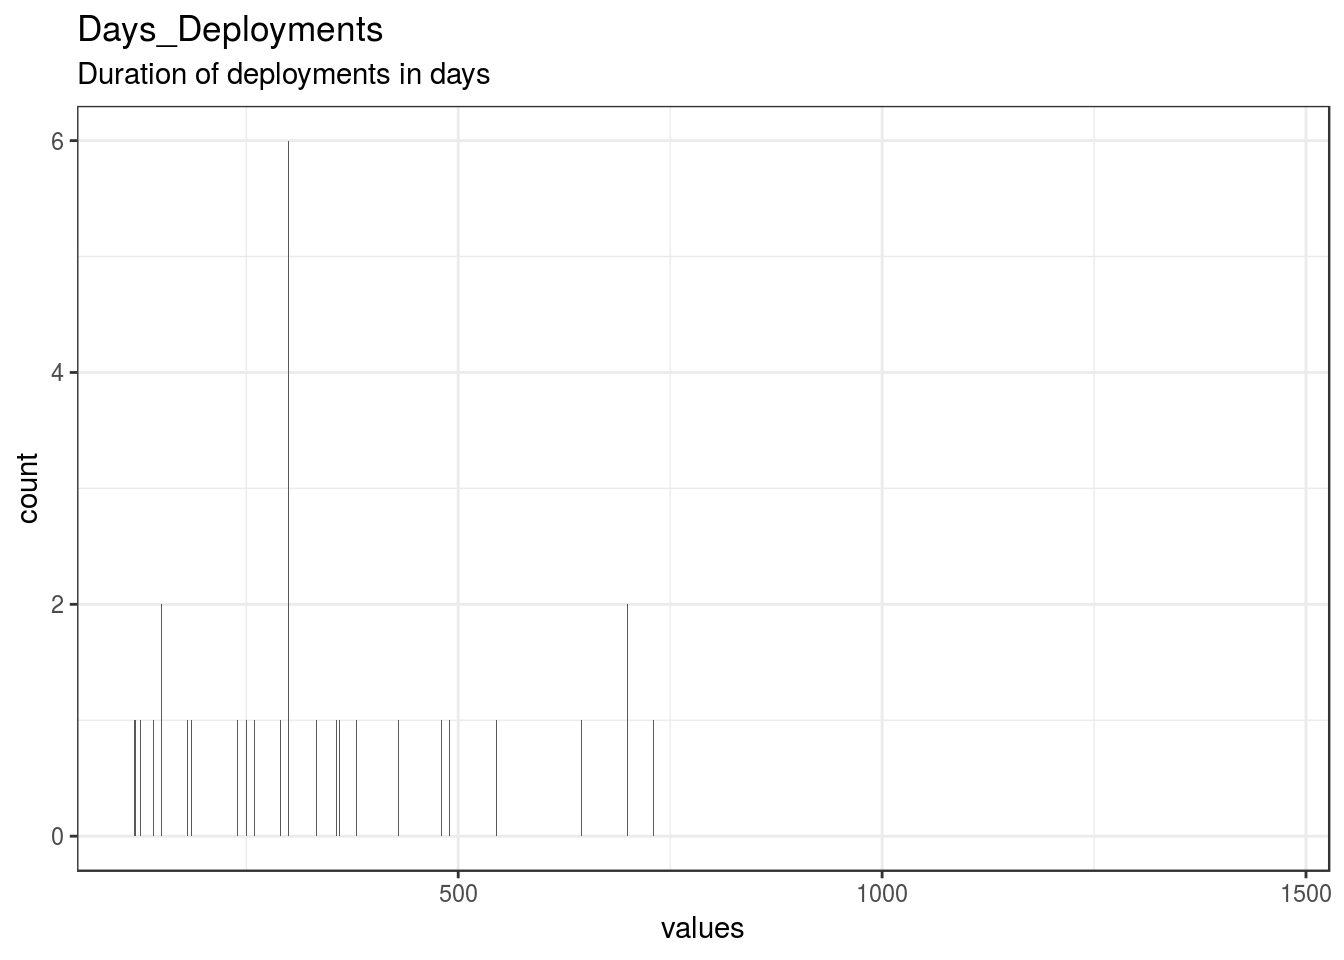
}Days_Deployments
Duration of deployments in days
Distribution
show_missing_values <- FALSE
if (has_labels(item)) {
missing_values <- item[is.na(haven::zap_missing(item))]
attributes(missing_values) <- attributes(item)
if (!is.null(attributes(item)$labels)) {
attributes(missing_values)$labels <- attributes(missing_values)$labels[is.na(attributes(missing_values)$labels)]
attributes(item)$labels <- attributes(item)$labels[!is.na(attributes(item)$labels)]
}
if (is.double(item)) {
show_missing_values <- length(unique(haven::na_tag(missing_values))) > 1
item <- haven::zap_missing(item)
}
if (length(item_attributes$labels) == 0 && is.numeric(item)) {
item <- haven::zap_labels(item)
}
}
item_nomiss <- item[!is.na(item)]
# unnest mc_multiple and so on
if (
is.character(item_nomiss) &&
stringr::str_detect(item_nomiss, stringr::fixed(", ")) &&
(exists("type", item_info) &&
stringr::str_detect(item_info$type, pattern = stringr::fixed("multiple")))
) {
item_nomiss <- unlist(stringr::str_split(item_nomiss, pattern = stringr::fixed(", ")))
}
attributes(item_nomiss) <- attributes(item)
old_height <- knitr::opts_chunk$get("fig.height")
non_missing_choices <- item_attributes[["labels"]]
many_labels <- length(non_missing_choices) > 7
go_vertical <- !is.numeric(item_nomiss) || many_labels
if ( go_vertical ) {
# numeric items are plotted horizontally (because that's what usually expected)
# categorical items are plotted vertically because we can use the screen real estate better this way
if (is.null(choices) ||
dplyr::n_distinct(item_nomiss) > length(non_missing_choices)) {
non_missing_choices <- unique(item_nomiss)
names(non_missing_choices) <- non_missing_choices
}
choice_multiplier <- old_height/6.5
new_height <- 2 + choice_multiplier * length(non_missing_choices)
new_height <- ifelse(new_height > 20, 20, new_height)
new_height <- ifelse(new_height < 1, 1, new_height)
knitr::opts_chunk$set(fig.height = new_height)
}
wrap_at <- knitr::opts_chunk$get("fig.width") * 10# todo: if there are free-text choices mingled in with the pre-defined ones, don't show
# todo: show rare items if they are pre-defined
# todo: bin rare responses into "other category"
if (!length(item_nomiss)) {
cat("No non-missing values to show.")
} else if (is.numeric(item_nomiss) || dplyr::n_distinct(item_nomiss) < 20) {
plot_labelled(item_nomiss, item_name, wrap_at, go_vertical)
} else {
cat(dplyr::n_distinct(item_nomiss), " unique, categorical values, so not shown.")
}
knitr::opts_chunk$set(fig.height = old_height)0 missing values.
Summary statistics
attributes(item) <- item_attributes
df = data.frame(item, stringsAsFactors = FALSE)
names(df) = html_item_name
escaped_table(codebook_table(df))| name | label | data_type | missing | complete | n | mean | sd | p0 | p25 | p50 | p75 | p100 | hist | format.spss | display_width |
|---|---|---|---|---|---|---|---|---|---|---|---|---|---|---|---|
| Days_Deployments | Duration of deployments in days | numeric | 0 | 40 | 40 | 350.4 | 260.52 | 118 | 180 | 300 | 404.5 | 1460 | ▇▆▁▂▁▁▁▁ | F6.0 | 6 |
if (show_missing_values) {
plot_labelled(missing_values, item_name, wrap_at)
}if (!is.null(item_info)) {
# don't show choices again, if they're basically same thing as value labels
if (!is.null(choices) && !is.null(item_info$choices) &&
all(names(na.omit(choices)) == item_info$choices) &&
all(na.omit(choices) == names(item_info$choices))) {
item_info$choices <- NULL
}
item_info$label_parsed <-
item_info$choice_list <- item_info$study_id <- item_info$id <- NULL
pander::pander(item_info)
}if (!is.null(choices) && length(choices) && length(choices) < 30) {
pander::pander(as.list(choices))
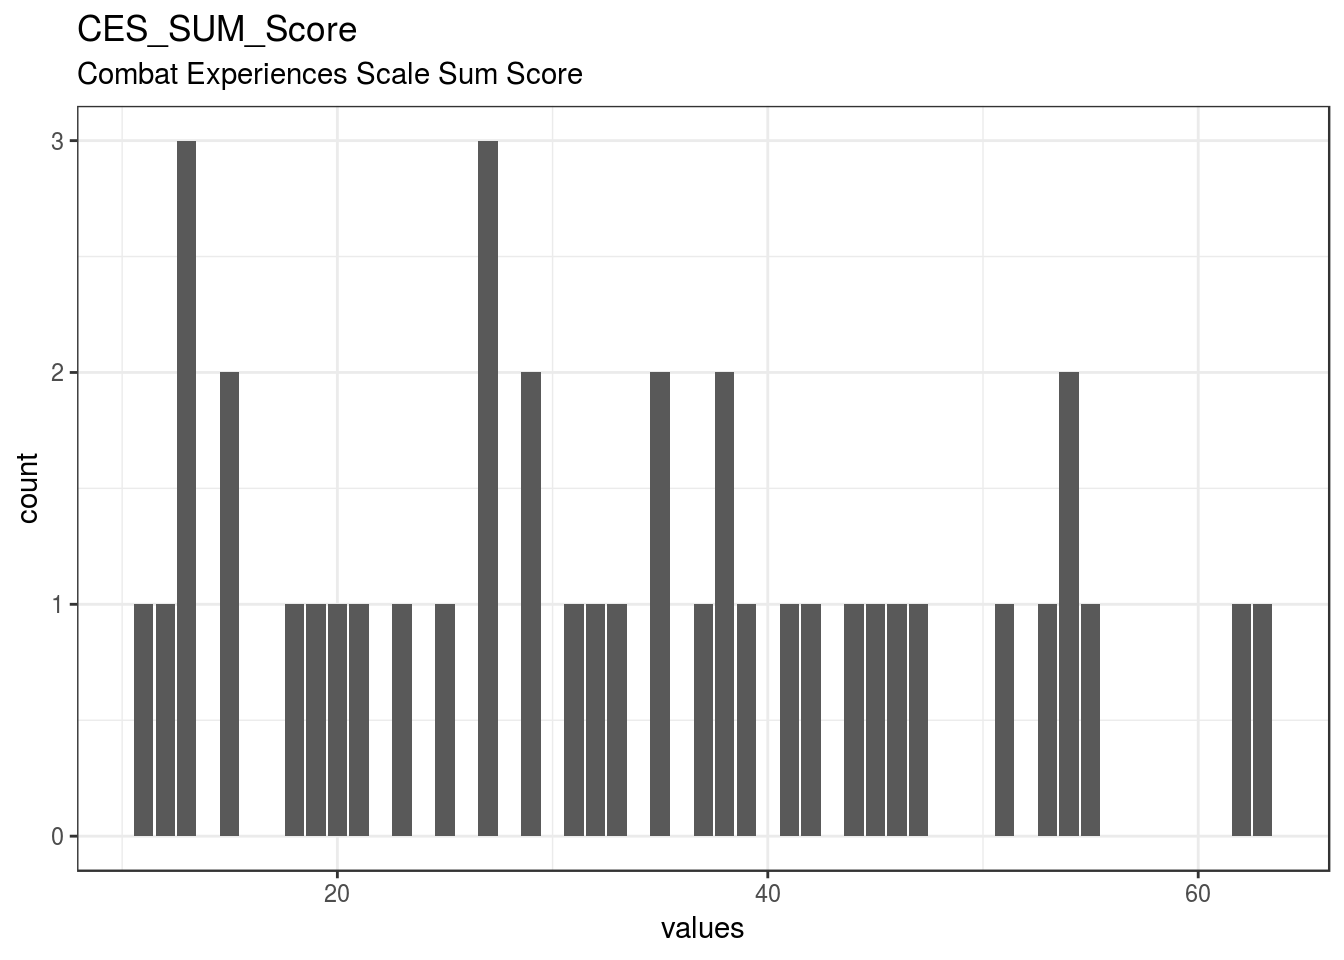
}CES_SUM_Score
Combat Experiences Scale Sum Score
Distribution
show_missing_values <- FALSE
if (has_labels(item)) {
missing_values <- item[is.na(haven::zap_missing(item))]
attributes(missing_values) <- attributes(item)
if (!is.null(attributes(item)$labels)) {
attributes(missing_values)$labels <- attributes(missing_values)$labels[is.na(attributes(missing_values)$labels)]
attributes(item)$labels <- attributes(item)$labels[!is.na(attributes(item)$labels)]
}
if (is.double(item)) {
show_missing_values <- length(unique(haven::na_tag(missing_values))) > 1
item <- haven::zap_missing(item)
}
if (length(item_attributes$labels) == 0 && is.numeric(item)) {
item <- haven::zap_labels(item)
}
}
item_nomiss <- item[!is.na(item)]
# unnest mc_multiple and so on
if (
is.character(item_nomiss) &&
stringr::str_detect(item_nomiss, stringr::fixed(", ")) &&
(exists("type", item_info) &&
stringr::str_detect(item_info$type, pattern = stringr::fixed("multiple")))
) {
item_nomiss <- unlist(stringr::str_split(item_nomiss, pattern = stringr::fixed(", ")))
}
attributes(item_nomiss) <- attributes(item)
old_height <- knitr::opts_chunk$get("fig.height")
non_missing_choices <- item_attributes[["labels"]]
many_labels <- length(non_missing_choices) > 7
go_vertical <- !is.numeric(item_nomiss) || many_labels
if ( go_vertical ) {
# numeric items are plotted horizontally (because that's what usually expected)
# categorical items are plotted vertically because we can use the screen real estate better this way
if (is.null(choices) ||
dplyr::n_distinct(item_nomiss) > length(non_missing_choices)) {
non_missing_choices <- unique(item_nomiss)
names(non_missing_choices) <- non_missing_choices
}
choice_multiplier <- old_height/6.5
new_height <- 2 + choice_multiplier * length(non_missing_choices)
new_height <- ifelse(new_height > 20, 20, new_height)
new_height <- ifelse(new_height < 1, 1, new_height)
knitr::opts_chunk$set(fig.height = new_height)
}
wrap_at <- knitr::opts_chunk$get("fig.width") * 10# todo: if there are free-text choices mingled in with the pre-defined ones, don't show
# todo: show rare items if they are pre-defined
# todo: bin rare responses into "other category"
if (!length(item_nomiss)) {
cat("No non-missing values to show.")
} else if (is.numeric(item_nomiss) || dplyr::n_distinct(item_nomiss) < 20) {
plot_labelled(item_nomiss, item_name, wrap_at, go_vertical)
} else {
cat(dplyr::n_distinct(item_nomiss), " unique, categorical values, so not shown.")
}
knitr::opts_chunk$set(fig.height = old_height)0 missing values.
Summary statistics
attributes(item) <- item_attributes
df = data.frame(item, stringsAsFactors = FALSE)
names(df) = html_item_name
escaped_table(codebook_table(df))| name | label | data_type | missing | complete | n | mean | sd | p0 | p25 | p50 | p75 | p100 | hist | format.spss | display_width |
|---|---|---|---|---|---|---|---|---|---|---|---|---|---|---|---|
| CES_SUM_Score | Combat Experiences Scale Sum Score | numeric | 0 | 40 | 40 | 33.3 | 14.79 | 11 | 20.75 | 32.5 | 44.25 | 63 | ▇▆▇▇▆▅▆▂ | F8.2 | 10 |
if (show_missing_values) {
plot_labelled(missing_values, item_name, wrap_at)
}if (!is.null(item_info)) {
# don't show choices again, if they're basically same thing as value labels
if (!is.null(choices) && !is.null(item_info$choices) &&
all(names(na.omit(choices)) == item_info$choices) &&
all(na.omit(choices) == names(item_info$choices))) {
item_info$choices <- NULL
}
item_info$label_parsed <-
item_info$choice_list <- item_info$study_id <- item_info$id <- NULL
pander::pander(item_info)
}if (!is.null(choices) && length(choices) && length(choices) < 30) {
pander::pander(as.list(choices))
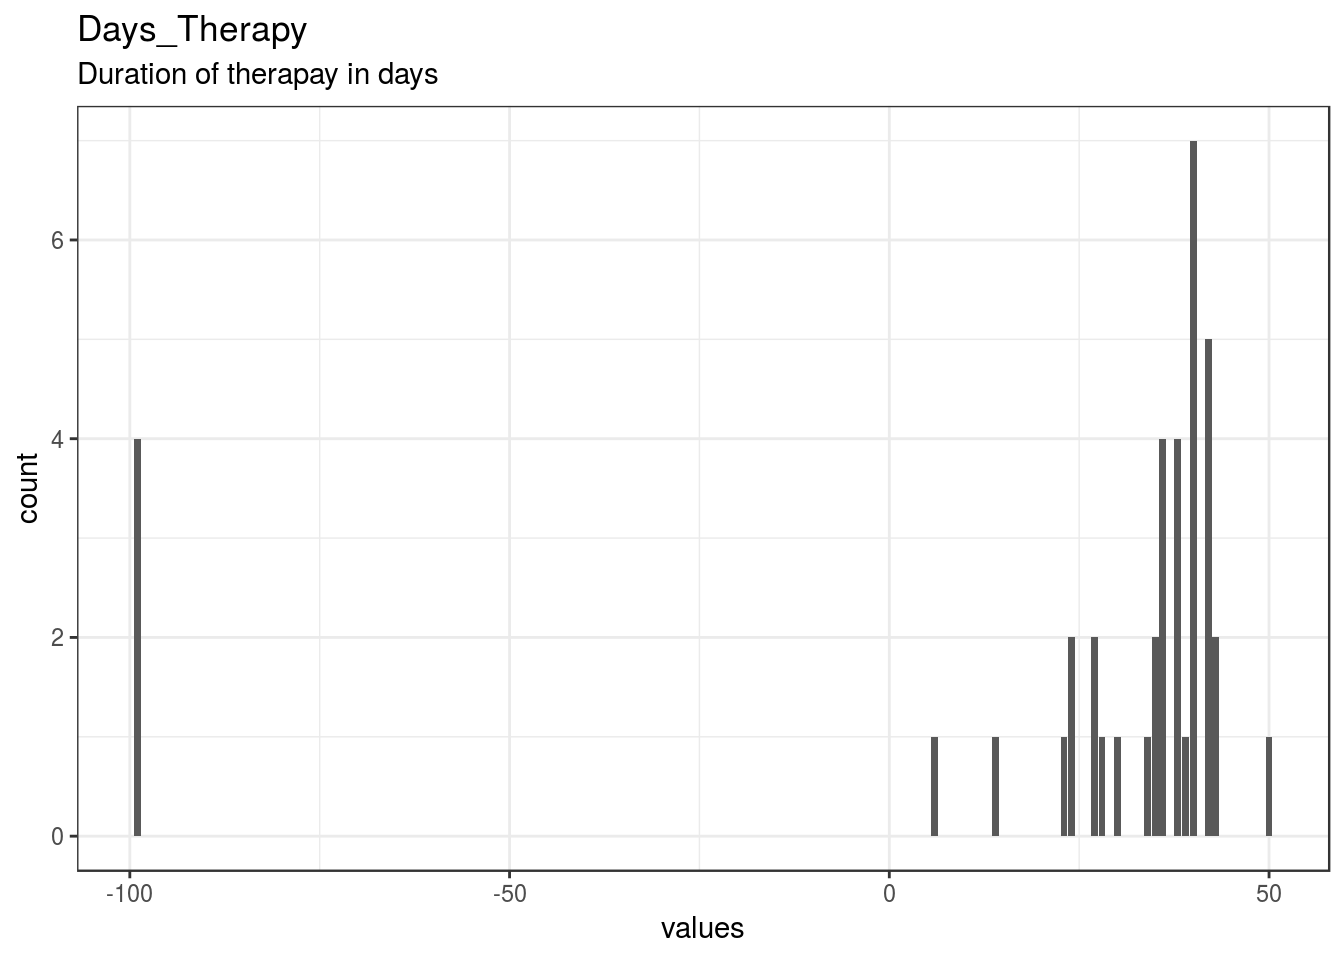
}Days_Therapy
Duration of therapay in days
Distribution
show_missing_values <- FALSE
if (has_labels(item)) {
missing_values <- item[is.na(haven::zap_missing(item))]
attributes(missing_values) <- attributes(item)
if (!is.null(attributes(item)$labels)) {
attributes(missing_values)$labels <- attributes(missing_values)$labels[is.na(attributes(missing_values)$labels)]
attributes(item)$labels <- attributes(item)$labels[!is.na(attributes(item)$labels)]
}
if (is.double(item)) {
show_missing_values <- length(unique(haven::na_tag(missing_values))) > 1
item <- haven::zap_missing(item)
}
if (length(item_attributes$labels) == 0 && is.numeric(item)) {
item <- haven::zap_labels(item)
}
}
item_nomiss <- item[!is.na(item)]
# unnest mc_multiple and so on
if (
is.character(item_nomiss) &&
stringr::str_detect(item_nomiss, stringr::fixed(", ")) &&
(exists("type", item_info) &&
stringr::str_detect(item_info$type, pattern = stringr::fixed("multiple")))
) {
item_nomiss <- unlist(stringr::str_split(item_nomiss, pattern = stringr::fixed(", ")))
}
attributes(item_nomiss) <- attributes(item)
old_height <- knitr::opts_chunk$get("fig.height")
non_missing_choices <- item_attributes[["labels"]]
many_labels <- length(non_missing_choices) > 7
go_vertical <- !is.numeric(item_nomiss) || many_labels
if ( go_vertical ) {
# numeric items are plotted horizontally (because that's what usually expected)
# categorical items are plotted vertically because we can use the screen real estate better this way
if (is.null(choices) ||
dplyr::n_distinct(item_nomiss) > length(non_missing_choices)) {
non_missing_choices <- unique(item_nomiss)
names(non_missing_choices) <- non_missing_choices
}
choice_multiplier <- old_height/6.5
new_height <- 2 + choice_multiplier * length(non_missing_choices)
new_height <- ifelse(new_height > 20, 20, new_height)
new_height <- ifelse(new_height < 1, 1, new_height)
knitr::opts_chunk$set(fig.height = new_height)
}
wrap_at <- knitr::opts_chunk$get("fig.width") * 10# todo: if there are free-text choices mingled in with the pre-defined ones, don't show
# todo: show rare items if they are pre-defined
# todo: bin rare responses into "other category"
if (!length(item_nomiss)) {
cat("No non-missing values to show.")
} else if (is.numeric(item_nomiss) || dplyr::n_distinct(item_nomiss) < 20) {
plot_labelled(item_nomiss, item_name, wrap_at, go_vertical)
} else {
cat(dplyr::n_distinct(item_nomiss), " unique, categorical values, so not shown.")
}
knitr::opts_chunk$set(fig.height = old_height)0 missing values.
Summary statistics
attributes(item) <- item_attributes
df = data.frame(item, stringsAsFactors = FALSE)
names(df) = html_item_name
escaped_table(codebook_table(df))| name | label | data_type | missing | complete | n | mean | sd | p0 | p25 | p50 | p75 | p100 | hist | format.spss |
|---|---|---|---|---|---|---|---|---|---|---|---|---|---|---|
| Days_Therapy | Duration of therapay in days | numeric | 0 | 40 | 40 | 21.8 | 41.62 | -99 | 27 | 37 | 40 | 50 | ▁▁▁▁▁▁▂▇ | F8.2 |
if (show_missing_values) {
plot_labelled(missing_values, item_name, wrap_at)
}if (!is.null(item_info)) {
# don't show choices again, if they're basically same thing as value labels
if (!is.null(choices) && !is.null(item_info$choices) &&
all(names(na.omit(choices)) == item_info$choices) &&
all(na.omit(choices) == names(item_info$choices))) {
item_info$choices <- NULL
}
item_info$label_parsed <-
item_info$choice_list <- item_info$study_id <- item_info$id <- NULL
pander::pander(item_info)
}if (!is.null(choices) && length(choices) && length(choices) < 30) {
pander::pander(as.list(choices))
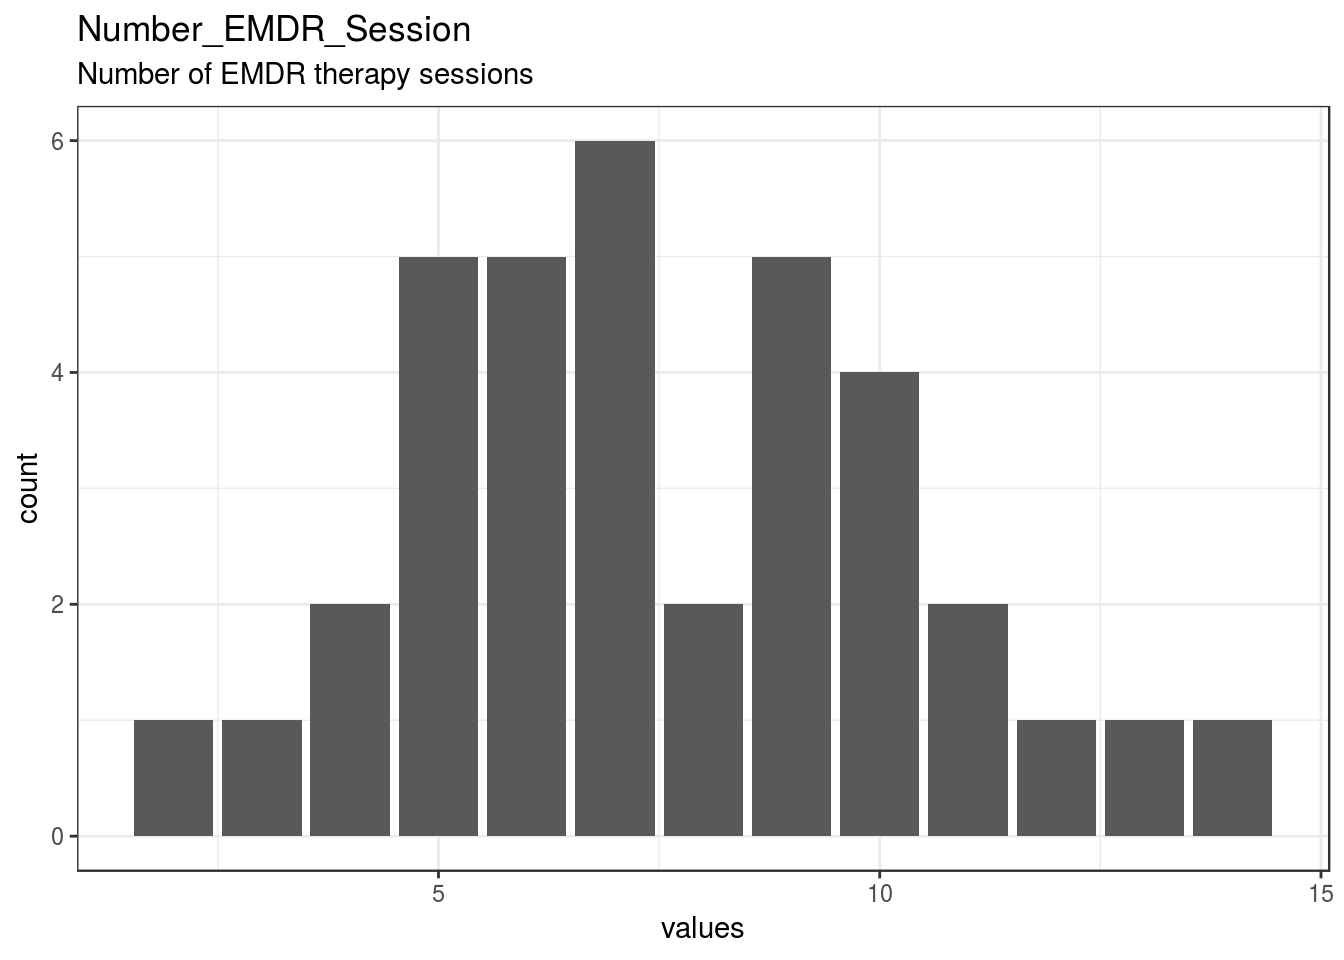
}Number_EMDR_Session
Number of EMDR therapy sessions
Distribution
show_missing_values <- FALSE
if (has_labels(item)) {
missing_values <- item[is.na(haven::zap_missing(item))]
attributes(missing_values) <- attributes(item)
if (!is.null(attributes(item)$labels)) {
attributes(missing_values)$labels <- attributes(missing_values)$labels[is.na(attributes(missing_values)$labels)]
attributes(item)$labels <- attributes(item)$labels[!is.na(attributes(item)$labels)]
}
if (is.double(item)) {
show_missing_values <- length(unique(haven::na_tag(missing_values))) > 1
item <- haven::zap_missing(item)
}
if (length(item_attributes$labels) == 0 && is.numeric(item)) {
item <- haven::zap_labels(item)
}
}
item_nomiss <- item[!is.na(item)]
# unnest mc_multiple and so on
if (
is.character(item_nomiss) &&
stringr::str_detect(item_nomiss, stringr::fixed(", ")) &&
(exists("type", item_info) &&
stringr::str_detect(item_info$type, pattern = stringr::fixed("multiple")))
) {
item_nomiss <- unlist(stringr::str_split(item_nomiss, pattern = stringr::fixed(", ")))
}
attributes(item_nomiss) <- attributes(item)
old_height <- knitr::opts_chunk$get("fig.height")
non_missing_choices <- item_attributes[["labels"]]
many_labels <- length(non_missing_choices) > 7
go_vertical <- !is.numeric(item_nomiss) || many_labels
if ( go_vertical ) {
# numeric items are plotted horizontally (because that's what usually expected)
# categorical items are plotted vertically because we can use the screen real estate better this way
if (is.null(choices) ||
dplyr::n_distinct(item_nomiss) > length(non_missing_choices)) {
non_missing_choices <- unique(item_nomiss)
names(non_missing_choices) <- non_missing_choices
}
choice_multiplier <- old_height/6.5
new_height <- 2 + choice_multiplier * length(non_missing_choices)
new_height <- ifelse(new_height > 20, 20, new_height)
new_height <- ifelse(new_height < 1, 1, new_height)
knitr::opts_chunk$set(fig.height = new_height)
}
wrap_at <- knitr::opts_chunk$get("fig.width") * 10# todo: if there are free-text choices mingled in with the pre-defined ones, don't show
# todo: show rare items if they are pre-defined
# todo: bin rare responses into "other category"
if (!length(item_nomiss)) {
cat("No non-missing values to show.")
} else if (is.numeric(item_nomiss) || dplyr::n_distinct(item_nomiss) < 20) {
plot_labelled(item_nomiss, item_name, wrap_at, go_vertical)
} else {
cat(dplyr::n_distinct(item_nomiss), " unique, categorical values, so not shown.")
}
knitr::opts_chunk$set(fig.height = old_height)4 missing values.
Summary statistics
attributes(item) <- item_attributes
df = data.frame(item, stringsAsFactors = FALSE)
names(df) = html_item_name
escaped_table(codebook_table(df))| name | label | data_type | missing | complete | n | mean | sd | p0 | p25 | p50 | p75 | p100 | hist | format.spss | display_width |
|---|---|---|---|---|---|---|---|---|---|---|---|---|---|---|---|
| Number_EMDR_Session | Number of EMDR therapy sessions | numeric | 4 | 36 | 40 | 7.56 | 2.79 | 2 | 5.75 | 7 | 9.25 | 14 | ▂▇▅▇▅▆▁▂ | F8.2 | 13 |
if (show_missing_values) {
plot_labelled(missing_values, item_name, wrap_at)
}if (!is.null(item_info)) {
# don't show choices again, if they're basically same thing as value labels
if (!is.null(choices) && !is.null(item_info$choices) &&
all(names(na.omit(choices)) == item_info$choices) &&
all(na.omit(choices) == names(item_info$choices))) {
item_info$choices <- NULL
}
item_info$label_parsed <-
item_info$choice_list <- item_info$study_id <- item_info$id <- NULL
pander::pander(item_info)
}if (!is.null(choices) && length(choices) && length(choices) < 30) {
pander::pander(as.list(choices))
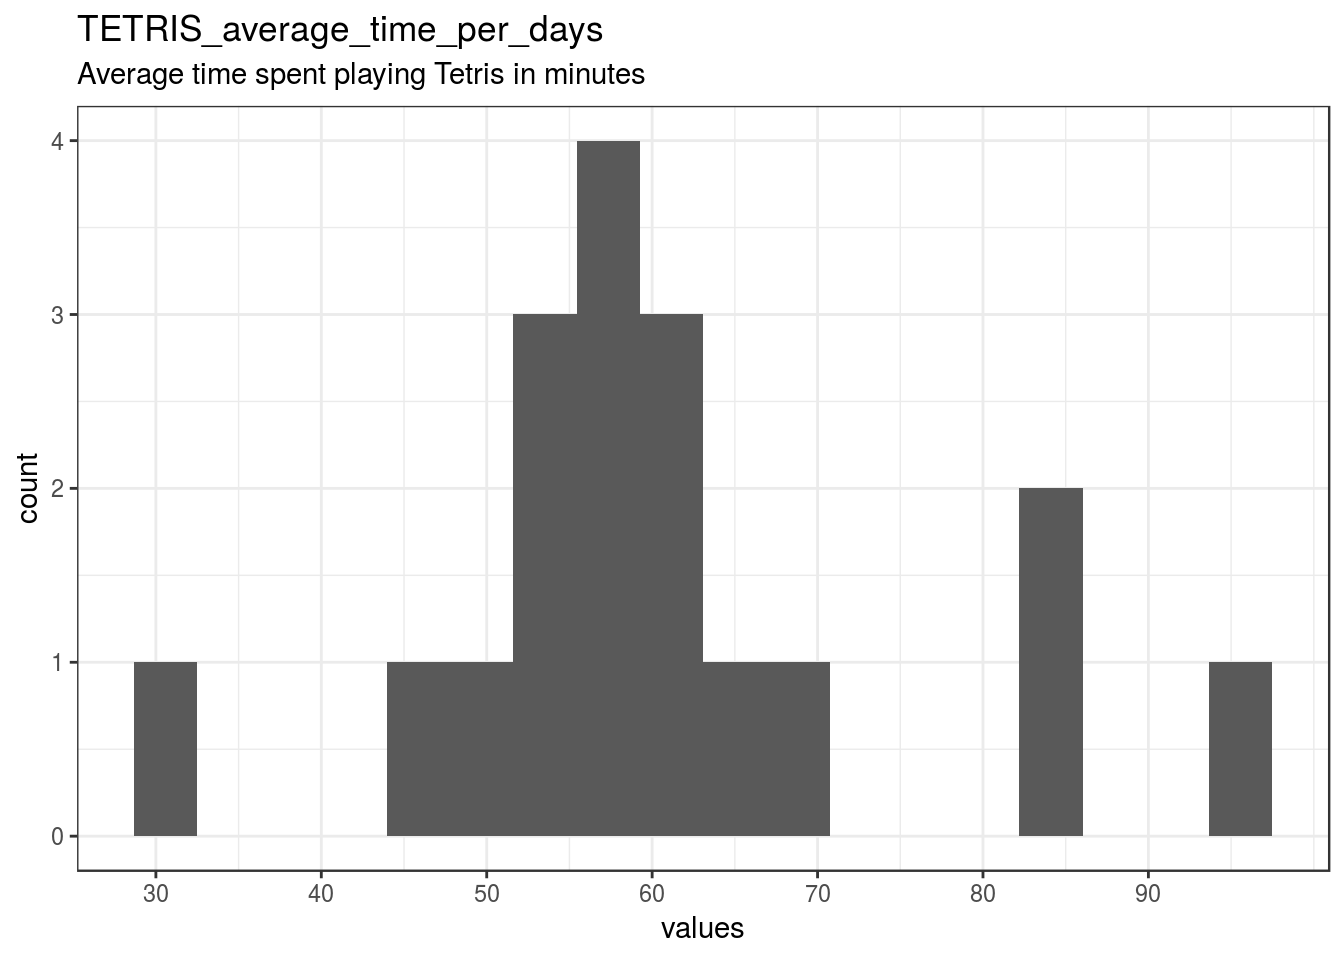
}TETRIS_average_time_per_days
Average time spent playing Tetris in minutes
Distribution
show_missing_values <- FALSE
if (has_labels(item)) {
missing_values <- item[is.na(haven::zap_missing(item))]
attributes(missing_values) <- attributes(item)
if (!is.null(attributes(item)$labels)) {
attributes(missing_values)$labels <- attributes(missing_values)$labels[is.na(attributes(missing_values)$labels)]
attributes(item)$labels <- attributes(item)$labels[!is.na(attributes(item)$labels)]
}
if (is.double(item)) {
show_missing_values <- length(unique(haven::na_tag(missing_values))) > 1
item <- haven::zap_missing(item)
}
if (length(item_attributes$labels) == 0 && is.numeric(item)) {
item <- haven::zap_labels(item)
}
}
item_nomiss <- item[!is.na(item)]
# unnest mc_multiple and so on
if (
is.character(item_nomiss) &&
stringr::str_detect(item_nomiss, stringr::fixed(", ")) &&
(exists("type", item_info) &&
stringr::str_detect(item_info$type, pattern = stringr::fixed("multiple")))
) {
item_nomiss <- unlist(stringr::str_split(item_nomiss, pattern = stringr::fixed(", ")))
}
attributes(item_nomiss) <- attributes(item)
old_height <- knitr::opts_chunk$get("fig.height")
non_missing_choices <- item_attributes[["labels"]]
many_labels <- length(non_missing_choices) > 7
go_vertical <- !is.numeric(item_nomiss) || many_labels
if ( go_vertical ) {
# numeric items are plotted horizontally (because that's what usually expected)
# categorical items are plotted vertically because we can use the screen real estate better this way
if (is.null(choices) ||
dplyr::n_distinct(item_nomiss) > length(non_missing_choices)) {
non_missing_choices <- unique(item_nomiss)
names(non_missing_choices) <- non_missing_choices
}
choice_multiplier <- old_height/6.5
new_height <- 2 + choice_multiplier * length(non_missing_choices)
new_height <- ifelse(new_height > 20, 20, new_height)
new_height <- ifelse(new_height < 1, 1, new_height)
knitr::opts_chunk$set(fig.height = new_height)
}
wrap_at <- knitr::opts_chunk$get("fig.width") * 10# todo: if there are free-text choices mingled in with the pre-defined ones, don't show
# todo: show rare items if they are pre-defined
# todo: bin rare responses into "other category"
if (!length(item_nomiss)) {
cat("No non-missing values to show.")
} else if (is.numeric(item_nomiss) || dplyr::n_distinct(item_nomiss) < 20) {
plot_labelled(item_nomiss, item_name, wrap_at, go_vertical)
} else {
cat(dplyr::n_distinct(item_nomiss), " unique, categorical values, so not shown.")
}
knitr::opts_chunk$set(fig.height = old_height)22 missing values.
Summary statistics
attributes(item) <- item_attributes
df = data.frame(item, stringsAsFactors = FALSE)
names(df) = html_item_name
escaped_table(codebook_table(df))| name | label | data_type | value_labels | missing | complete | n | mean | sd | p0 | p25 | p50 | p75 | p100 | hist | format.spss | display_width |
|---|---|---|---|---|---|---|---|---|---|---|---|---|---|---|---|---|
| TETRIS_average_time_per_days | Average time spent playing Tetris in minutes | numeric | NA. [-99] Missing, NA. [-88] Not Relevant |
22 | 18 | 40 | 61.22 | 14.56 | 32.03 | 53.3 | 59.16 | 63.48 | 95 | ▁▁▅▇▂▁▂▁ | F8.2 | 16 |
if (show_missing_values) {
plot_labelled(missing_values, item_name, wrap_at)
}if (!is.null(item_info)) {
# don't show choices again, if they're basically same thing as value labels
if (!is.null(choices) && !is.null(item_info$choices) &&
all(names(na.omit(choices)) == item_info$choices) &&
all(na.omit(choices) == names(item_info$choices))) {
item_info$choices <- NULL
}
item_info$label_parsed <-
item_info$choice_list <- item_info$study_id <- item_info$id <- NULL
pander::pander(item_info)
}Value labels
if (!is.null(choices) && length(choices) && length(choices) < 30) {
    pander::pander(as.list(choices))
}- [-99] Missing: NA
- [-88] Not Relevant: NA
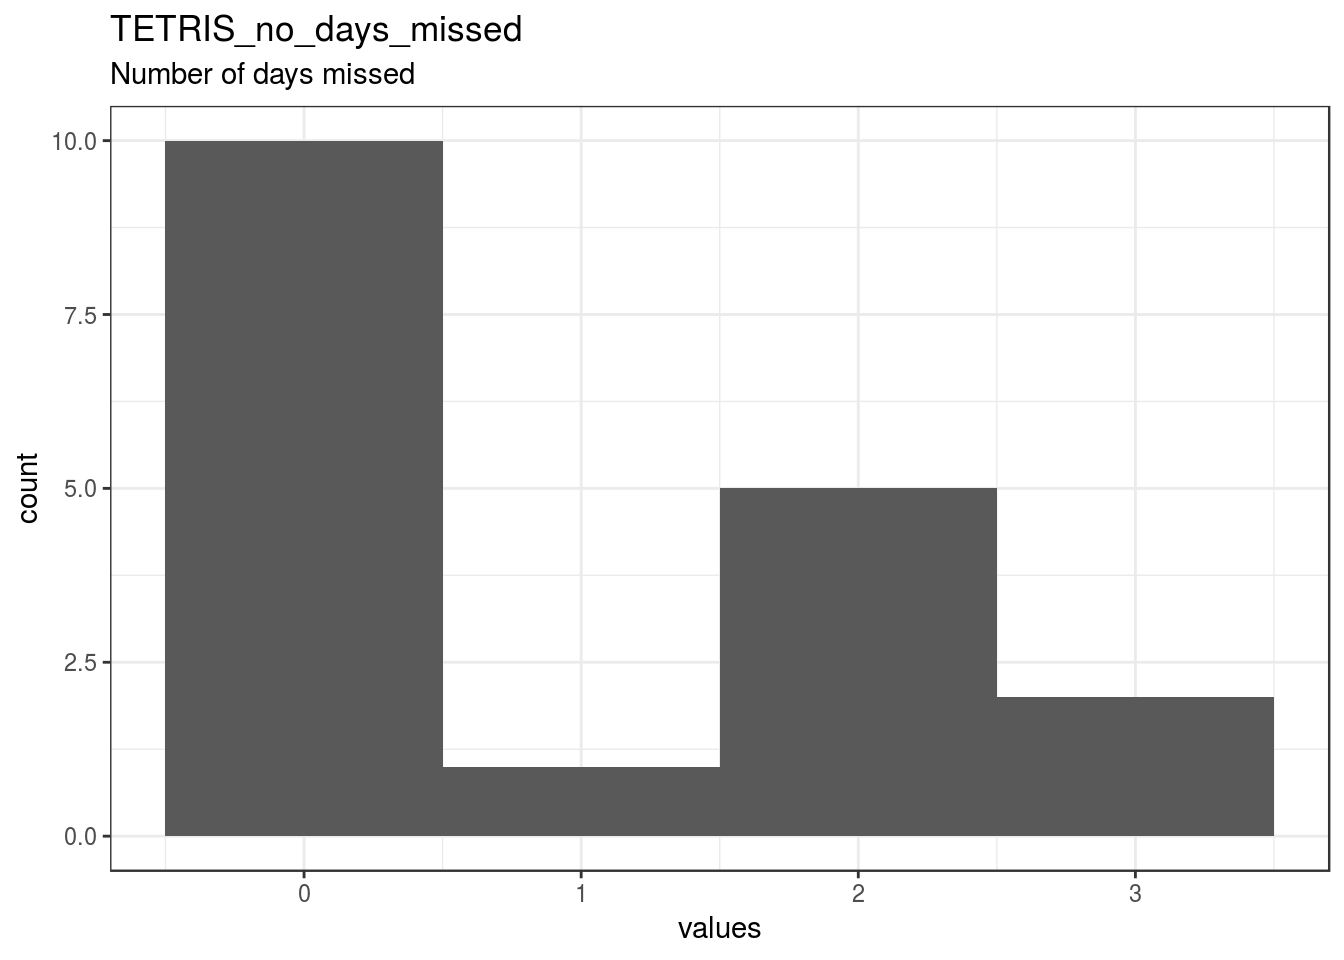
TETRIS_no_days_missed
Number of days missed
Distribution
show_missing_values <- FALSE
if (has_labels(item)) {
  missing_values <- item[is.na(haven::zap_missing(item))]
  attributes(missing_values) <- attributes(item)
  if (!is.null(attributes(item)$labels)) {
    attributes(missing_values)$labels <- attributes(missing_values)$labels[is.na(attributes(missing_values)$labels)]
    attributes(item)$labels <- attributes(item)$labels[!is.na(attributes(item)$labels)]
  }
  if (is.double(item)) {
    show_missing_values <- length(unique(haven::na_tag(missing_values))) > 1
    item <- haven::zap_missing(item)
  }
  if (length(item_attributes$labels) == 0 && is.numeric(item)) {
    item <- haven::zap_labels(item)
  }
}
item_nomiss <- item[!is.na(item)]

# unnest mc_multiple and so on
if (
  is.character(item_nomiss) &&
  stringr::str_detect(item_nomiss, stringr::fixed(", ")) &&
  (exists("type", item_info) &&
    stringr::str_detect(item_info$type, pattern = stringr::fixed("multiple")))
  ) {
  item_nomiss <- unlist(stringr::str_split(item_nomiss, pattern = stringr::fixed(", ")))
}
attributes(item_nomiss) <- attributes(item)

old_height <- knitr::opts_chunk$get("fig.height")
non_missing_choices <- item_attributes[["labels"]]
many_labels <- length(non_missing_choices) > 7
go_vertical <- !is.numeric(item_nomiss) || many_labels
if ( go_vertical ) {
  # numeric items are plotted horizontally (because that's what usually expected)
  # categorical items are plotted vertically because we can use the screen real estate better this way

    if (is.null(choices) ||
        dplyr::n_distinct(item_nomiss) > length(non_missing_choices)) {
        non_missing_choices <- unique(item_nomiss)
        names(non_missing_choices) <- non_missing_choices
    }
  choice_multiplier <- old_height/6.5
    new_height <- 2 + choice_multiplier * length(non_missing_choices)
    new_height <- ifelse(new_height > 20, 20, new_height)
    new_height <- ifelse(new_height < 1, 1, new_height)
    knitr::opts_chunk$set(fig.height = new_height)
}

wrap_at <- knitr::opts_chunk$get("fig.width") * 10
# todo: if there are free-text choices mingled in with the pre-defined ones, don't show
# todo: show rare items if they are pre-defined
# todo: bin rare responses into "other category"
if (!length(item_nomiss)) {
cat("No non-missing values to show.")
} else if (is.numeric(item_nomiss) || dplyr::n_distinct(item_nomiss) < 20) {
plot_labelled(item_nomiss, item_name, wrap_at, go_vertical)
} else {
cat(dplyr::n_distinct(item_nomiss), " unique, categorical values, so not shown.")
}
knitr::opts_chunk$set(fig.height = old_height)22 missing values.
Summary statistics
attributes(item) <- item_attributes
df = data.frame(item, stringsAsFactors = FALSE)
names(df) = html_item_name
escaped_table(codebook_table(df))| name | label | data_type | value_labels | missing | complete | n | mean | sd | p0 | p25 | p50 | p75 | p100 | hist | format.spss |
|---|---|---|---|---|---|---|---|---|---|---|---|---|---|---|---|
| TETRIS_no_days_missed | Number of days missed | numeric | NA. [-99] Missing, NA. [-88] Not relevant |
22 | 18 | 40 | 0.94 | 1.16 | 0 | 0 | 0 | 2 | 3 | ▇▁▁▁▁▃▁▂ | F8.2 |
if (show_missing_values) {
  plot_labelled(missing_values, item_name, wrap_at)
}
if (!is.null(item_info)) {
# don't show choices again, if they're basically same thing as value labels
if (!is.null(choices) && !is.null(item_info$choices) &&
all(names(na.omit(choices)) == item_info$choices) &&
all(na.omit(choices) == names(item_info$choices))) {
item_info$choices <- NULL
}
item_info$label_parsed <-
item_info$choice_list <- item_info$study_id <- item_info$id <- NULL
pander::pander(item_info)
}Value labels
if (!is.null(choices) && length(choices) && length(choices) < 30) {
    pander::pander(as.list(choices))
}- [-99] Missing: NA
- [-88] Not relevant: NA
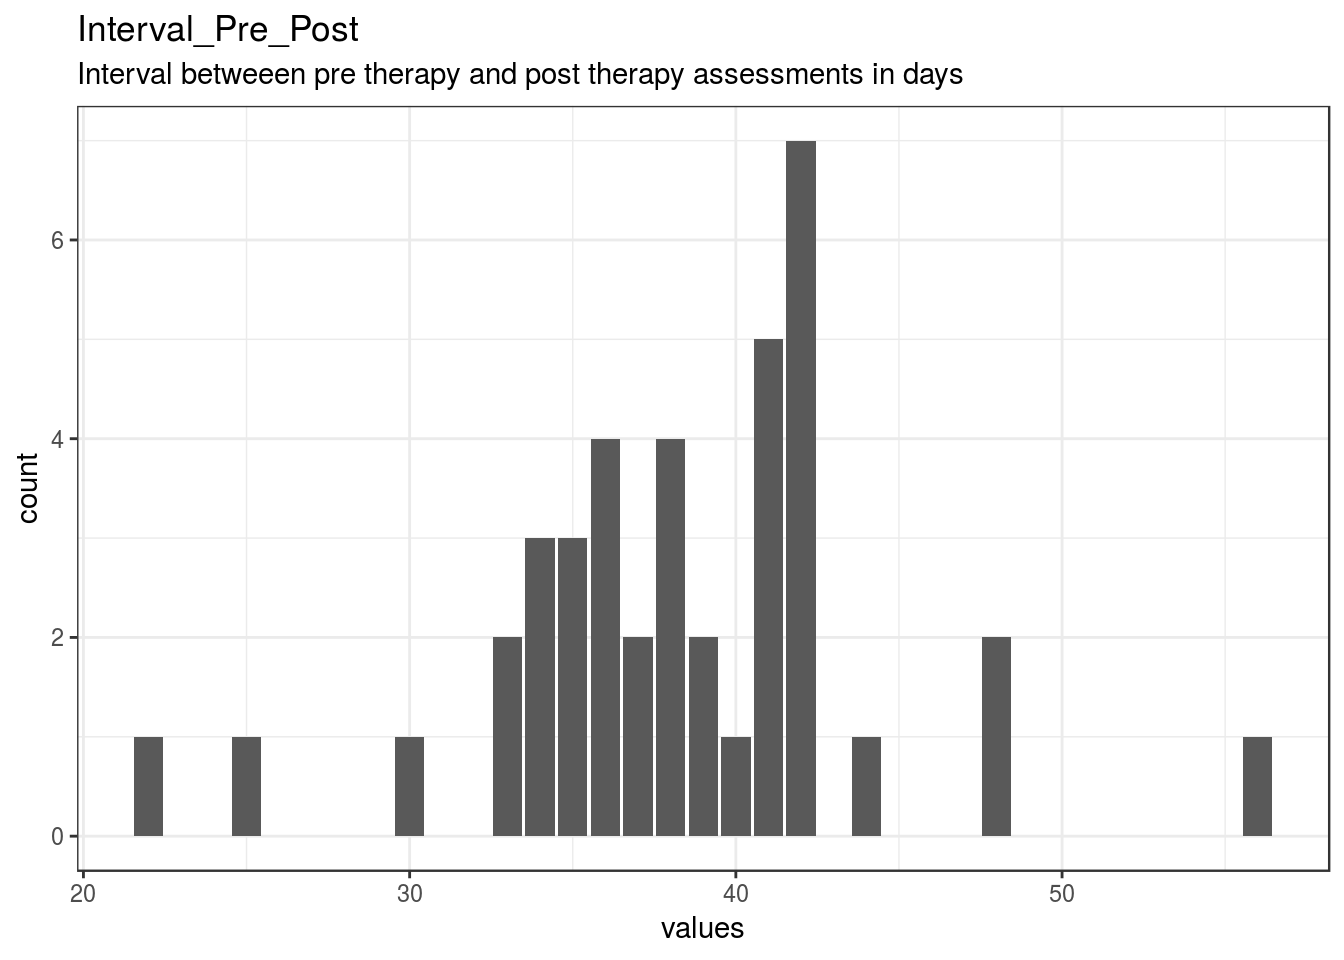
Interval_Pre_Post
Interval betweeen pre therapy and post therapy assessments in days
Distribution
show_missing_values <- FALSE
if (has_labels(item)) {
  missing_values <- item[is.na(haven::zap_missing(item))]
  attributes(missing_values) <- attributes(item)
  if (!is.null(attributes(item)$labels)) {
    attributes(missing_values)$labels <- attributes(missing_values)$labels[is.na(attributes(missing_values)$labels)]
    attributes(item)$labels <- attributes(item)$labels[!is.na(attributes(item)$labels)]
  }
  if (is.double(item)) {
    show_missing_values <- length(unique(haven::na_tag(missing_values))) > 1
    item <- haven::zap_missing(item)
  }
  if (length(item_attributes$labels) == 0 && is.numeric(item)) {
    item <- haven::zap_labels(item)
  }
}
item_nomiss <- item[!is.na(item)]

# unnest mc_multiple and so on
if (
  is.character(item_nomiss) &&
  stringr::str_detect(item_nomiss, stringr::fixed(", ")) &&
  (exists("type", item_info) &&
    stringr::str_detect(item_info$type, pattern = stringr::fixed("multiple")))
  ) {
  item_nomiss <- unlist(stringr::str_split(item_nomiss, pattern = stringr::fixed(", ")))
}
attributes(item_nomiss) <- attributes(item)

old_height <- knitr::opts_chunk$get("fig.height")
non_missing_choices <- item_attributes[["labels"]]
many_labels <- length(non_missing_choices) > 7
go_vertical <- !is.numeric(item_nomiss) || many_labels
if ( go_vertical ) {
  # numeric items are plotted horizontally (because that's what usually expected)
  # categorical items are plotted vertically because we can use the screen real estate better this way

    if (is.null(choices) ||
        dplyr::n_distinct(item_nomiss) > length(non_missing_choices)) {
        non_missing_choices <- unique(item_nomiss)
        names(non_missing_choices) <- non_missing_choices
    }
  choice_multiplier <- old_height/6.5
    new_height <- 2 + choice_multiplier * length(non_missing_choices)
    new_height <- ifelse(new_height > 20, 20, new_height)
    new_height <- ifelse(new_height < 1, 1, new_height)
    knitr::opts_chunk$set(fig.height = new_height)
}

wrap_at <- knitr::opts_chunk$get("fig.width") * 10
# todo: if there are free-text choices mingled in with the pre-defined ones, don't show
# todo: show rare items if they are pre-defined
# todo: bin rare responses into "other category"
if (!length(item_nomiss)) {
cat("No non-missing values to show.")
} else if (is.numeric(item_nomiss) || dplyr::n_distinct(item_nomiss) < 20) {
plot_labelled(item_nomiss, item_name, wrap_at, go_vertical)
} else {
cat(dplyr::n_distinct(item_nomiss), " unique, categorical values, so not shown.")
}
knitr::opts_chunk$set(fig.height = old_height)0 missing values.
Summary statistics
attributes(item) <- item_attributes
df = data.frame(item, stringsAsFactors = FALSE)
names(df) = html_item_name
escaped_table(codebook_table(df))| name | label | data_type | missing | complete | n | mean | sd | p0 | p25 | p50 | p75 | p100 | hist | format.spss | display_width |
|---|---|---|---|---|---|---|---|---|---|---|---|---|---|---|---|
| Interval_Pre_Post | Interval betweeen pre therapy and post therapy assessments in days | numeric | 0 | 40 | 40 | 38.33 | 5.89 | 22 | 35 | 38 | 42 | 56 | ▁▁▂▇▇▁▁▁ | F8.2 | 19 |
if (show_missing_values) {
  plot_labelled(missing_values, item_name, wrap_at)
}
if (!is.null(item_info)) {
# don't show choices again, if they're basically same thing as value labels
if (!is.null(choices) && !is.null(item_info$choices) &&
all(names(na.omit(choices)) == item_info$choices) &&
all(na.omit(choices) == names(item_info$choices))) {
item_info$choices <- NULL
}
item_info$label_parsed <-
item_info$choice_list <- item_info$study_id <- item_info$id <- NULL
pander::pander(item_info)
}if (!is.null(choices) && length(choices) && length(choices) < 30) {
pander::pander(as.list(choices))
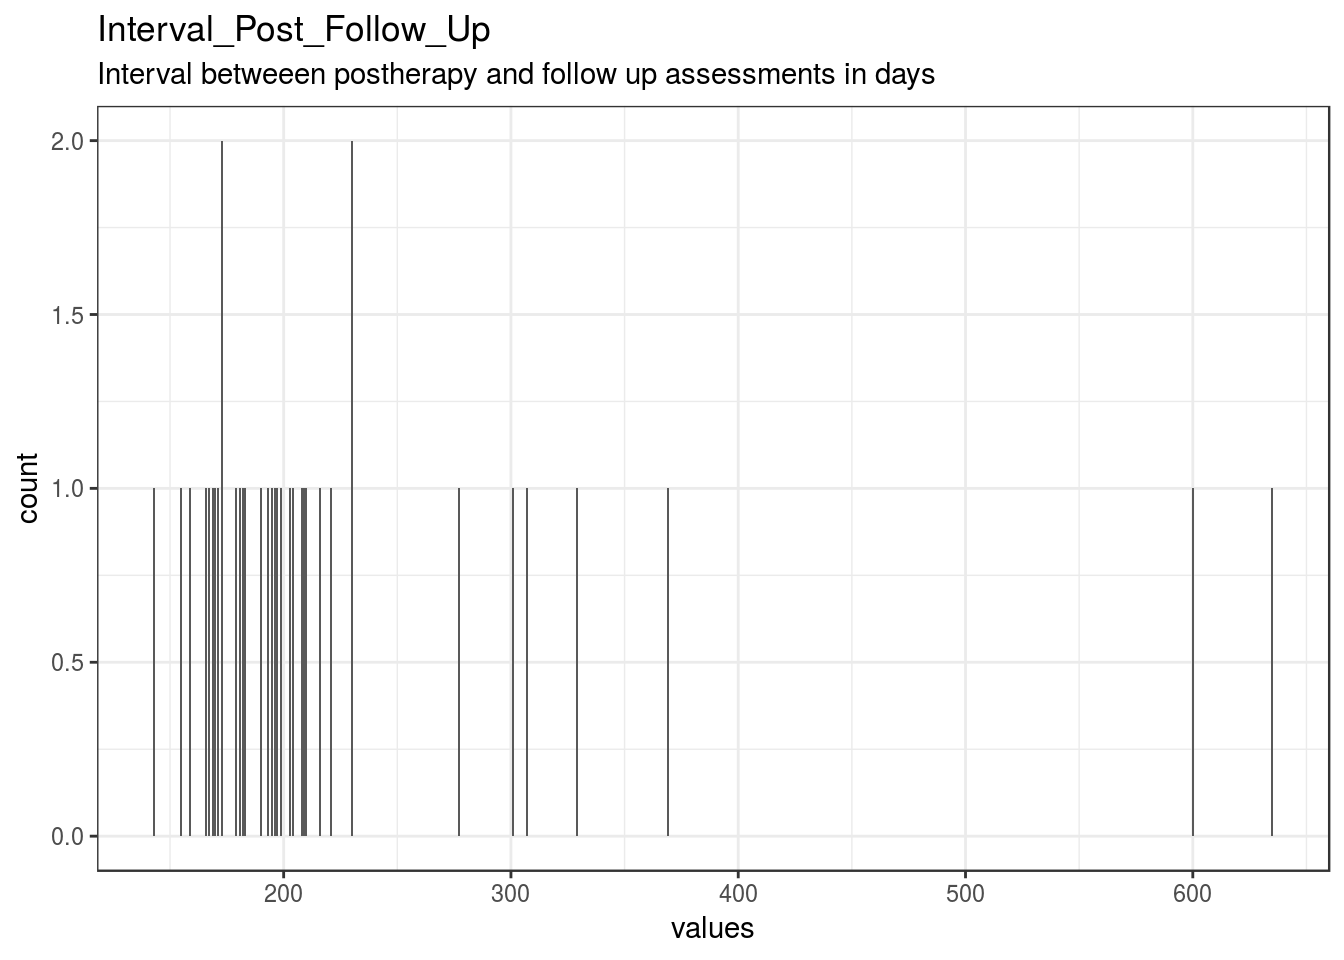
}Interval_Post_Follow_Up
Interval betweeen postherapy and follow up assessments in days
Distribution
show_missing_values <- FALSE
if (has_labels(item)) {
  missing_values <- item[is.na(haven::zap_missing(item))]
  attributes(missing_values) <- attributes(item)
  if (!is.null(attributes(item)$labels)) {
    attributes(missing_values)$labels <- attributes(missing_values)$labels[is.na(attributes(missing_values)$labels)]
    attributes(item)$labels <- attributes(item)$labels[!is.na(attributes(item)$labels)]
  }
  if (is.double(item)) {
    show_missing_values <- length(unique(haven::na_tag(missing_values))) > 1
    item <- haven::zap_missing(item)
  }
  if (length(item_attributes$labels) == 0 && is.numeric(item)) {
    item <- haven::zap_labels(item)
  }
}
item_nomiss <- item[!is.na(item)]

# unnest mc_multiple and so on
if (
  is.character(item_nomiss) &&
  stringr::str_detect(item_nomiss, stringr::fixed(", ")) &&
  (exists("type", item_info) &&
    stringr::str_detect(item_info$type, pattern = stringr::fixed("multiple")))
  ) {
  item_nomiss <- unlist(stringr::str_split(item_nomiss, pattern = stringr::fixed(", ")))
}
attributes(item_nomiss) <- attributes(item)

old_height <- knitr::opts_chunk$get("fig.height")
non_missing_choices <- item_attributes[["labels"]]
many_labels <- length(non_missing_choices) > 7
go_vertical <- !is.numeric(item_nomiss) || many_labels
if ( go_vertical ) {
  # numeric items are plotted horizontally (because that's what usually expected)
  # categorical items are plotted vertically because we can use the screen real estate better this way

    if (is.null(choices) ||
        dplyr::n_distinct(item_nomiss) > length(non_missing_choices)) {
        non_missing_choices <- unique(item_nomiss)
        names(non_missing_choices) <- non_missing_choices
    }
  choice_multiplier <- old_height/6.5
    new_height <- 2 + choice_multiplier * length(non_missing_choices)
    new_height <- ifelse(new_height > 20, 20, new_height)
    new_height <- ifelse(new_height < 1, 1, new_height)
    knitr::opts_chunk$set(fig.height = new_height)
}

wrap_at <- knitr::opts_chunk$get("fig.width") * 10
# todo: if there are free-text choices mingled in with the pre-defined ones, don't show
# todo: show rare items if they are pre-defined
# todo: bin rare responses into "other category"
if (!length(item_nomiss)) {
cat("No non-missing values to show.")
} else if (is.numeric(item_nomiss) || dplyr::n_distinct(item_nomiss) < 20) {
plot_labelled(item_nomiss, item_name, wrap_at, go_vertical)
} else {
cat(dplyr::n_distinct(item_nomiss), " unique, categorical values, so not shown.")
}
knitr::opts_chunk$set(fig.height = old_height)4 missing values.
Summary statistics
attributes(item) <- item_attributes
df = data.frame(item, stringsAsFactors = FALSE)
names(df) = html_item_name
escaped_table(codebook_table(df))| name | label | data_type | missing | complete | n | mean | sd | p0 | p25 | p50 | p75 | p100 | hist | format.spss | display_width |
|---|---|---|---|---|---|---|---|---|---|---|---|---|---|---|---|
| Interval_Post_Follow_Up | Interval betweeen postherapy and follow up assessments in days | numeric | 4 | 36 | 40 | 230.28 | 107.8 | 143 | 173 | 196.5 | 223.25 | 635 | ▇▂▁▁▁▁▁▁ | F8.2 | 25 |
if (show_missing_values) {
  plot_labelled(missing_values, item_name, wrap_at)
}
if (!is.null(item_info)) {
# don't show choices again, if they're basically same thing as value labels
if (!is.null(choices) && !is.null(item_info$choices) &&
all(names(na.omit(choices)) == item_info$choices) &&
all(na.omit(choices) == names(item_info$choices))) {
item_info$choices <- NULL
}
item_info$label_parsed <-
item_info$choice_list <- item_info$study_id <- item_info$id <- NULL
pander::pander(item_info)
}if (!is.null(choices) && length(choices) && length(choices) < 30) {
pander::pander(as.list(choices))
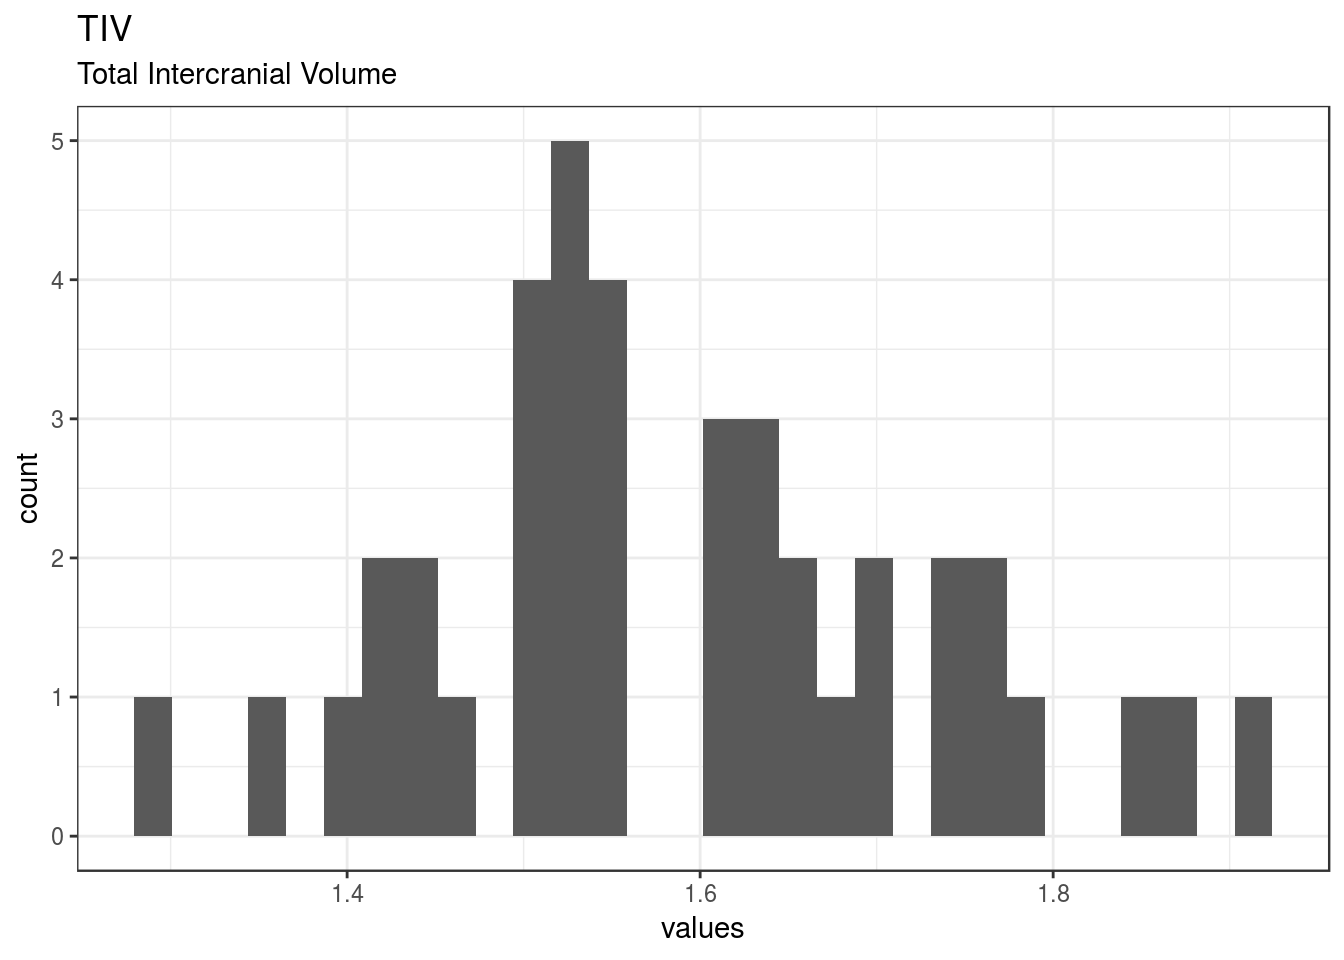
}TIV
Total Intercranial Volume
Distribution
show_missing_values <- FALSE
if (has_labels(item)) {
  missing_values <- item[is.na(haven::zap_missing(item))]
  attributes(missing_values) <- attributes(item)
  if (!is.null(attributes(item)$labels)) {
    attributes(missing_values)$labels <- attributes(missing_values)$labels[is.na(attributes(missing_values)$labels)]
    attributes(item)$labels <- attributes(item)$labels[!is.na(attributes(item)$labels)]
  }
  if (is.double(item)) {
    show_missing_values <- length(unique(haven::na_tag(missing_values))) > 1
    item <- haven::zap_missing(item)
  }
  if (length(item_attributes$labels) == 0 && is.numeric(item)) {
    item <- haven::zap_labels(item)
  }
}
item_nomiss <- item[!is.na(item)]

# unnest mc_multiple and so on
if (
  is.character(item_nomiss) &&
  stringr::str_detect(item_nomiss, stringr::fixed(", ")) &&
  (exists("type", item_info) &&
    stringr::str_detect(item_info$type, pattern = stringr::fixed("multiple")))
  ) {
  item_nomiss <- unlist(stringr::str_split(item_nomiss, pattern = stringr::fixed(", ")))
}
attributes(item_nomiss) <- attributes(item)

old_height <- knitr::opts_chunk$get("fig.height")
non_missing_choices <- item_attributes[["labels"]]
many_labels <- length(non_missing_choices) > 7
go_vertical <- !is.numeric(item_nomiss) || many_labels
if ( go_vertical ) {
  # numeric items are plotted horizontally (because that's what usually expected)
  # categorical items are plotted vertically because we can use the screen real estate better this way

    if (is.null(choices) ||
        dplyr::n_distinct(item_nomiss) > length(non_missing_choices)) {
        non_missing_choices <- unique(item_nomiss)
        names(non_missing_choices) <- non_missing_choices
    }
  choice_multiplier <- old_height/6.5
    new_height <- 2 + choice_multiplier * length(non_missing_choices)
    new_height <- ifelse(new_height > 20, 20, new_height)
    new_height <- ifelse(new_height < 1, 1, new_height)
    knitr::opts_chunk$set(fig.height = new_height)
}

wrap_at <- knitr::opts_chunk$get("fig.width") * 10
# todo: if there are free-text choices mingled in with the pre-defined ones, don't show
# todo: show rare items if they are pre-defined
# todo: bin rare responses into "other category"
if (!length(item_nomiss)) {
cat("No non-missing values to show.")
} else if (is.numeric(item_nomiss) || dplyr::n_distinct(item_nomiss) < 20) {
plot_labelled(item_nomiss, item_name, wrap_at, go_vertical)
} else {
cat(dplyr::n_distinct(item_nomiss), " unique, categorical values, so not shown.")
}
knitr::opts_chunk$set(fig.height = old_height)0 missing values.
Summary statistics
attributes(item) <- item_attributes
df = data.frame(item, stringsAsFactors = FALSE)
names(df) = html_item_name
escaped_table(codebook_table(df))| name | label | data_type | missing | complete | n | mean | sd | p0 | p25 | p50 | p75 | p100 | hist | format.spss |
|---|---|---|---|---|---|---|---|---|---|---|---|---|---|---|
| TIV | Total Intercranial Volume | numeric | 0 | 40 | 40 | 1.59 | 0.14 | 1.3 | 1.5 | 1.55 | 1.69 | 1.92 | ▂▅▇▅▇▃▂▂ | F8.2 |
if (show_missing_values) {
  plot_labelled(missing_values, item_name, wrap_at)
}
if (!is.null(item_info)) {
# don't show choices again, if they're basically same thing as value labels
if (!is.null(choices) && !is.null(item_info$choices) &&
all(names(na.omit(choices)) == item_info$choices) &&
all(na.omit(choices) == names(item_info$choices))) {
item_info$choices <- NULL
}
item_info$label_parsed <-
item_info$choice_list <- item_info$study_id <- item_info$id <- NULL
pander::pander(item_info)
}if (!is.null(choices) && length(choices) && length(choices) < 30) {
pander::pander(as.list(choices))
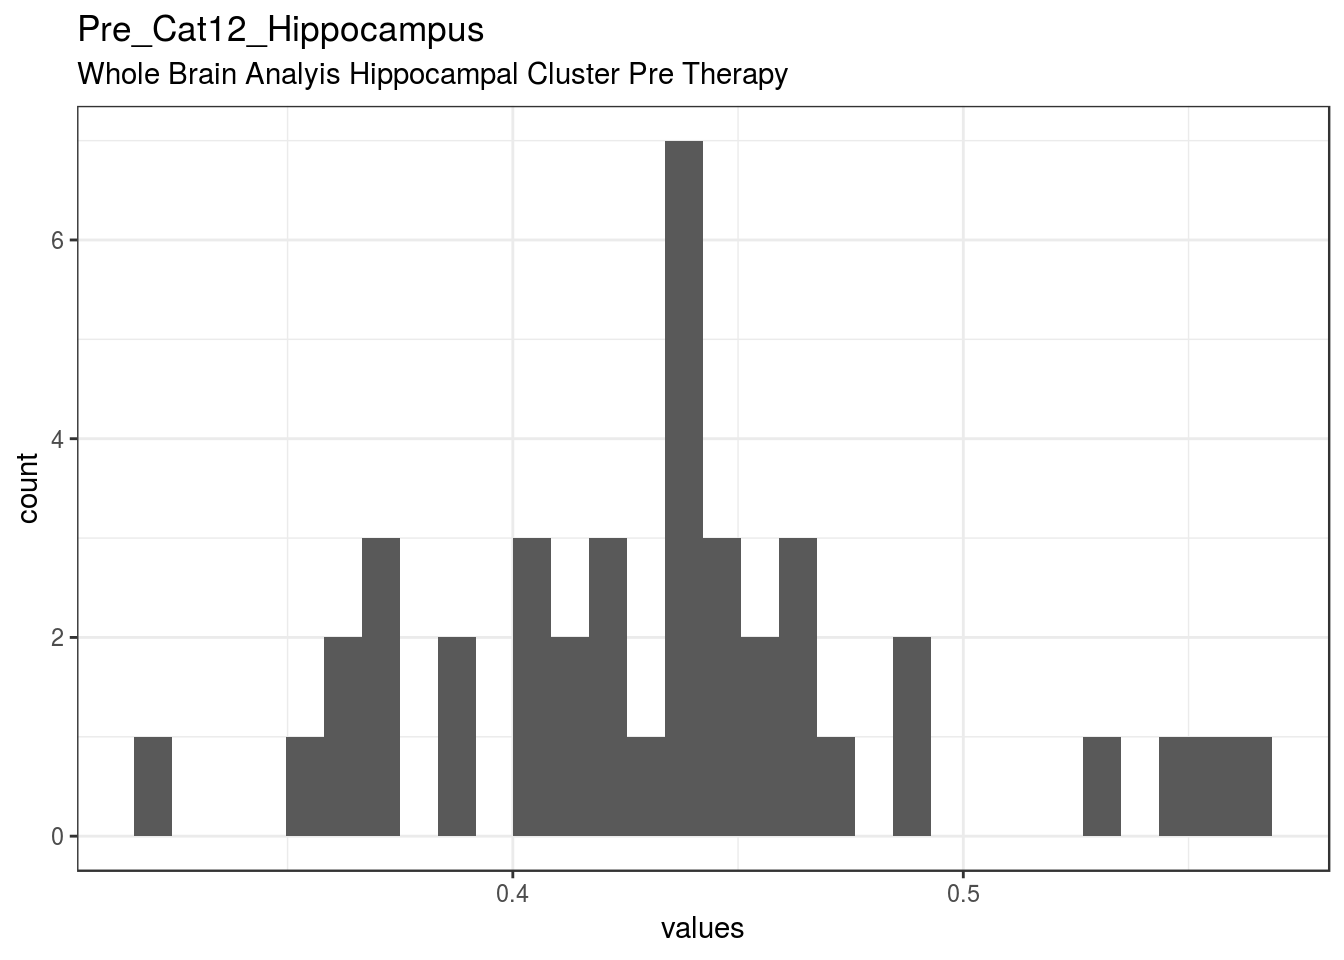
}Pre_Cat12_Hippocampus
Whole Brain Analyis Hippocampal Cluster Pre Therapy
Distribution
show_missing_values <- FALSE
if (has_labels(item)) {
  missing_values <- item[is.na(haven::zap_missing(item))]
  attributes(missing_values) <- attributes(item)
  if (!is.null(attributes(item)$labels)) {
    attributes(missing_values)$labels <- attributes(missing_values)$labels[is.na(attributes(missing_values)$labels)]
    attributes(item)$labels <- attributes(item)$labels[!is.na(attributes(item)$labels)]
  }
  if (is.double(item)) {
    show_missing_values <- length(unique(haven::na_tag(missing_values))) > 1
    item <- haven::zap_missing(item)
  }
  if (length(item_attributes$labels) == 0 && is.numeric(item)) {
    item <- haven::zap_labels(item)
  }
}
item_nomiss <- item[!is.na(item)]

# unnest mc_multiple and so on
if (
  is.character(item_nomiss) &&
  stringr::str_detect(item_nomiss, stringr::fixed(", ")) &&
  (exists("type", item_info) &&
    stringr::str_detect(item_info$type, pattern = stringr::fixed("multiple")))
  ) {
  item_nomiss <- unlist(stringr::str_split(item_nomiss, pattern = stringr::fixed(", ")))
}
attributes(item_nomiss) <- attributes(item)

old_height <- knitr::opts_chunk$get("fig.height")
non_missing_choices <- item_attributes[["labels"]]
many_labels <- length(non_missing_choices) > 7
go_vertical <- !is.numeric(item_nomiss) || many_labels
if ( go_vertical ) {
  # numeric items are plotted horizontally (because that's what usually expected)
  # categorical items are plotted vertically because we can use the screen real estate better this way

    if (is.null(choices) ||
        dplyr::n_distinct(item_nomiss) > length(non_missing_choices)) {
        non_missing_choices <- unique(item_nomiss)
        names(non_missing_choices) <- non_missing_choices
    }
  choice_multiplier <- old_height/6.5
    new_height <- 2 + choice_multiplier * length(non_missing_choices)
    new_height <- ifelse(new_height > 20, 20, new_height)
    new_height <- ifelse(new_height < 1, 1, new_height)
    knitr::opts_chunk$set(fig.height = new_height)
}

wrap_at <- knitr::opts_chunk$get("fig.width") * 10
# todo: if there are free-text choices mingled in with the pre-defined ones, don't show
# todo: show rare items if they are pre-defined
# todo: bin rare responses into "other category"
if (!length(item_nomiss)) {
cat("No non-missing values to show.")
} else if (is.numeric(item_nomiss) || dplyr::n_distinct(item_nomiss) < 20) {
plot_labelled(item_nomiss, item_name, wrap_at, go_vertical)
} else {
cat(dplyr::n_distinct(item_nomiss), " unique, categorical values, so not shown.")
}
knitr::opts_chunk$set(fig.height = old_height)0 missing values.
Summary statistics
attributes(item) <- item_attributes
df = data.frame(item, stringsAsFactors = FALSE)
names(df) = html_item_name
escaped_table(codebook_table(df))| name | label | data_type | missing | complete | n | mean | sd | p0 | p25 | p50 | p75 | p100 | hist | format.spss | display_width |
|---|---|---|---|---|---|---|---|---|---|---|---|---|---|---|---|
| Pre_Cat12_Hippocampus | Whole Brain Analyis Hippocampal Cluster Pre Therapy | numeric | 0 | 40 | 40 | 0.43 | 0.054 | 0.32 | 0.4 | 0.44 | 0.46 | 0.56 | ▁▃▃▇▆▁▁▂ | F17.4 | 11 |
if (show_missing_values) {
  plot_labelled(missing_values, item_name, wrap_at)
}
if (!is.null(item_info)) {
# don't show choices again, if they're basically same thing as value labels
if (!is.null(choices) && !is.null(item_info$choices) &&
all(names(na.omit(choices)) == item_info$choices) &&
all(na.omit(choices) == names(item_info$choices))) {
item_info$choices <- NULL
}
item_info$label_parsed <-
item_info$choice_list <- item_info$study_id <- item_info$id <- NULL
pander::pander(item_info)
}if (!is.null(choices) && length(choices) && length(choices) < 30) {
pander::pander(as.list(choices))
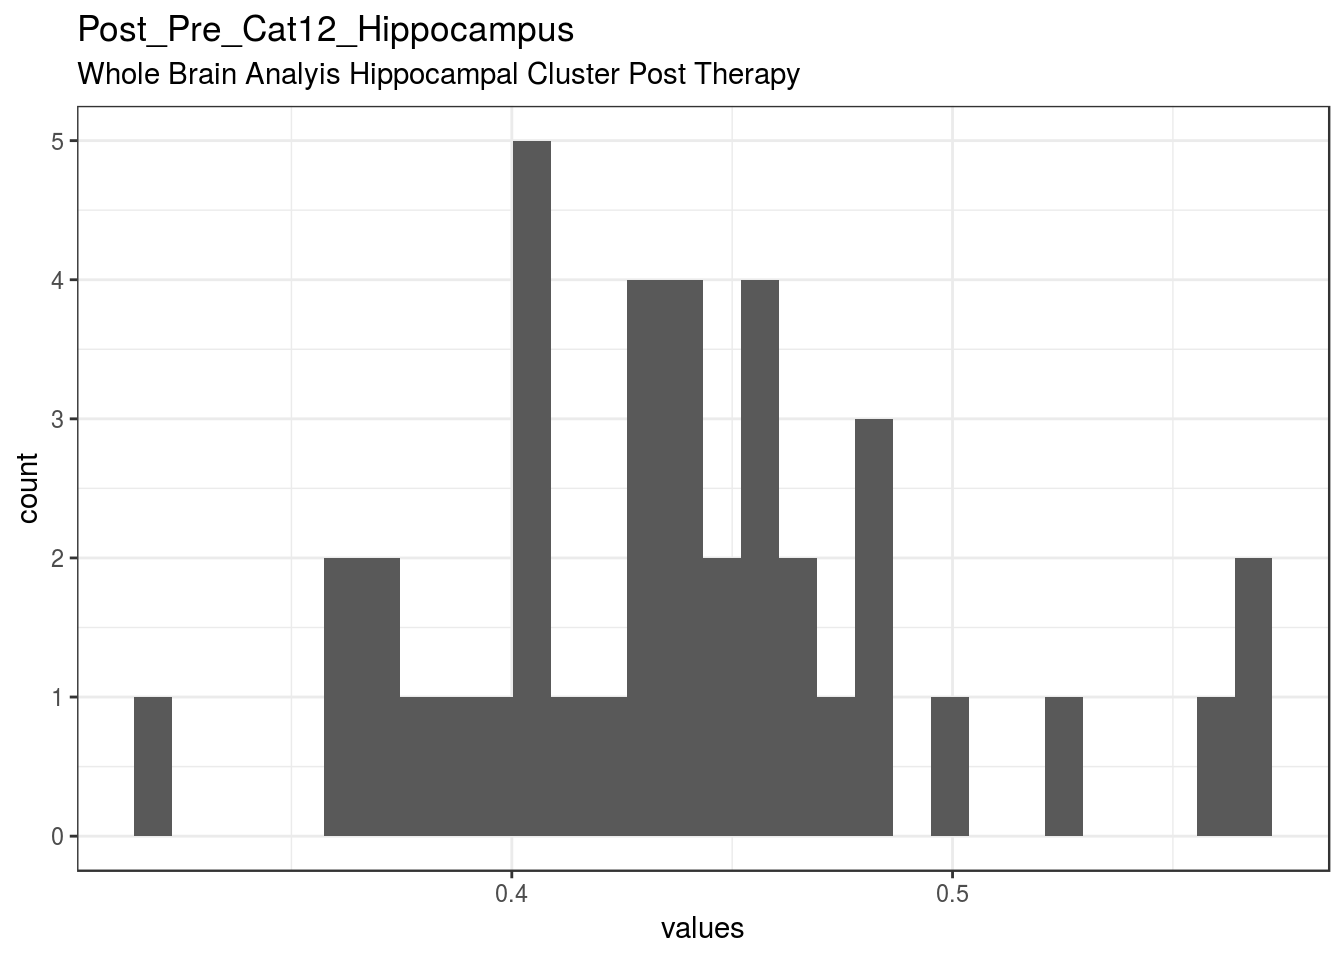
}Post_Pre_Cat12_Hippocampus
Whole Brain Analyis Hippocampal Cluster Post Therapy
Distribution
show_missing_values <- FALSE
if (has_labels(item)) {
  missing_values <- item[is.na(haven::zap_missing(item))]
  attributes(missing_values) <- attributes(item)
  if (!is.null(attributes(item)$labels)) {
    attributes(missing_values)$labels <- attributes(missing_values)$labels[is.na(attributes(missing_values)$labels)]
    attributes(item)$labels <- attributes(item)$labels[!is.na(attributes(item)$labels)]
  }
  if (is.double(item)) {
    show_missing_values <- length(unique(haven::na_tag(missing_values))) > 1
    item <- haven::zap_missing(item)
  }
  if (length(item_attributes$labels) == 0 && is.numeric(item)) {
    item <- haven::zap_labels(item)
  }
}
item_nomiss <- item[!is.na(item)]

# unnest mc_multiple and so on
if (
  is.character(item_nomiss) &&
  stringr::str_detect(item_nomiss, stringr::fixed(", ")) &&
  (exists("type", item_info) &&
    stringr::str_detect(item_info$type, pattern = stringr::fixed("multiple")))
  ) {
  item_nomiss <- unlist(stringr::str_split(item_nomiss, pattern = stringr::fixed(", ")))
}
attributes(item_nomiss) <- attributes(item)

old_height <- knitr::opts_chunk$get("fig.height")
non_missing_choices <- item_attributes[["labels"]]
many_labels <- length(non_missing_choices) > 7
go_vertical <- !is.numeric(item_nomiss) || many_labels
if ( go_vertical ) {
  # numeric items are plotted horizontally (because that's what usually expected)
  # categorical items are plotted vertically because we can use the screen real estate better this way

    if (is.null(choices) ||
        dplyr::n_distinct(item_nomiss) > length(non_missing_choices)) {
        non_missing_choices <- unique(item_nomiss)
        names(non_missing_choices) <- non_missing_choices
    }
  choice_multiplier <- old_height/6.5
    new_height <- 2 + choice_multiplier * length(non_missing_choices)
    new_height <- ifelse(new_height > 20, 20, new_height)
    new_height <- ifelse(new_height < 1, 1, new_height)
    knitr::opts_chunk$set(fig.height = new_height)
}

wrap_at <- knitr::opts_chunk$get("fig.width") * 10
# todo: if there are free-text choices mingled in with the pre-defined ones, don't show
# todo: show rare items if they are pre-defined
# todo: bin rare responses into "other category"
if (!length(item_nomiss)) {
cat("No non-missing values to show.")
} else if (is.numeric(item_nomiss) || dplyr::n_distinct(item_nomiss) < 20) {
plot_labelled(item_nomiss, item_name, wrap_at, go_vertical)
} else {
cat(dplyr::n_distinct(item_nomiss), " unique, categorical values, so not shown.")
}
knitr::opts_chunk$set(fig.height = old_height)0 missing values.
Summary statistics
attributes(item) <- item_attributes
df = data.frame(item, stringsAsFactors = FALSE)
names(df) = html_item_name
escaped_table(codebook_table(df))| name | label | data_type | missing | complete | n | mean | sd | p0 | p25 | p50 | p75 | p100 | hist | format.spss | display_width |
|---|---|---|---|---|---|---|---|---|---|---|---|---|---|---|---|
| Post_Pre_Cat12_Hippocampus | Whole Brain Analyis Hippocampal Cluster Post Therapy | numeric | 0 | 40 | 40 | 0.44 | 0.055 | 0.32 | 0.4 | 0.44 | 0.47 | 0.57 | ▁▃▆▇▆▂▁▂ | F17.4 | 11 |
if (show_missing_values) {
  plot_labelled(missing_values, item_name, wrap_at)
}
if (!is.null(item_info)) {
# don't show choices again, if they're basically same thing as value labels
if (!is.null(choices) && !is.null(item_info$choices) &&
all(names(na.omit(choices)) == item_info$choices) &&
all(na.omit(choices) == names(item_info$choices))) {
item_info$choices <- NULL
}
item_info$label_parsed <-
item_info$choice_list <- item_info$study_id <- item_info$id <- NULL
pander::pander(item_info)
}if (!is.null(choices) && length(choices) && length(choices) < 30) {
pander::pander(as.list(choices))
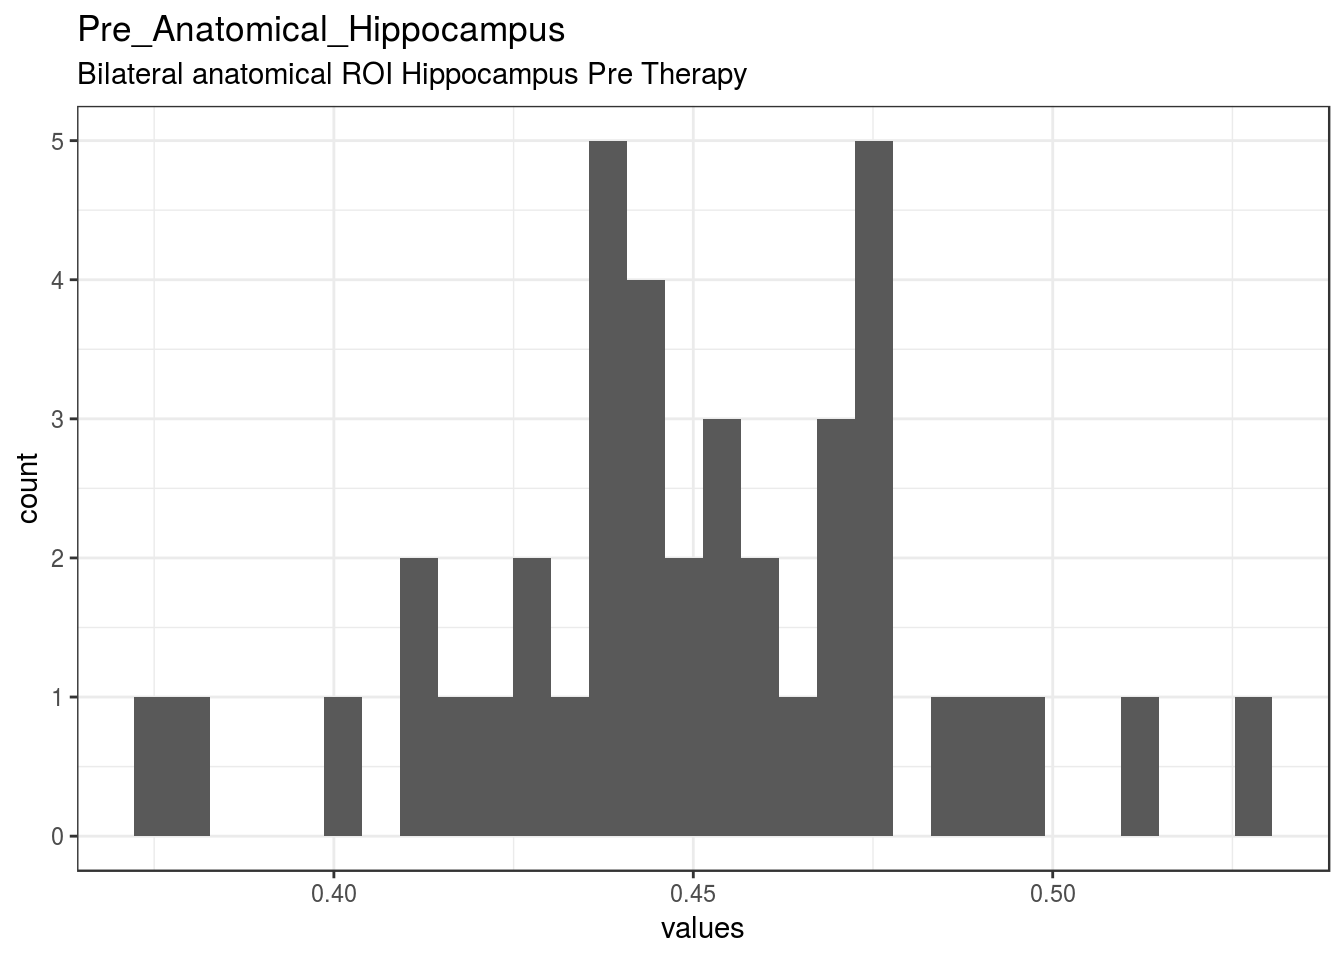
}Pre_Anatomical_Hippocampus
Bilateral anatomical ROI Hippocampus Pre Therapy
Distribution
show_missing_values <- FALSE
if (has_labels(item)) {
  missing_values <- item[is.na(haven::zap_missing(item))]
  attributes(missing_values) <- attributes(item)
  if (!is.null(attributes(item)$labels)) {
    attributes(missing_values)$labels <- attributes(missing_values)$labels[is.na(attributes(missing_values)$labels)]
    attributes(item)$labels <- attributes(item)$labels[!is.na(attributes(item)$labels)]
  }
  if (is.double(item)) {
    show_missing_values <- length(unique(haven::na_tag(missing_values))) > 1
    item <- haven::zap_missing(item)
  }
  if (length(item_attributes$labels) == 0 && is.numeric(item)) {
    item <- haven::zap_labels(item)
  }
}
item_nomiss <- item[!is.na(item)]

# unnest mc_multiple and so on
if (
  is.character(item_nomiss) &&
  stringr::str_detect(item_nomiss, stringr::fixed(", ")) &&
  (exists("type", item_info) &&
    stringr::str_detect(item_info$type, pattern = stringr::fixed("multiple")))
  ) {
  item_nomiss <- unlist(stringr::str_split(item_nomiss, pattern = stringr::fixed(", ")))
}
attributes(item_nomiss) <- attributes(item)

old_height <- knitr::opts_chunk$get("fig.height")
non_missing_choices <- item_attributes[["labels"]]
many_labels <- length(non_missing_choices) > 7
go_vertical <- !is.numeric(item_nomiss) || many_labels
if ( go_vertical ) {
  # numeric items are plotted horizontally (because that's what usually expected)
  # categorical items are plotted vertically because we can use the screen real estate better this way

    if (is.null(choices) ||
        dplyr::n_distinct(item_nomiss) > length(non_missing_choices)) {
        non_missing_choices <- unique(item_nomiss)
        names(non_missing_choices) <- non_missing_choices
    }
  choice_multiplier <- old_height/6.5
    new_height <- 2 + choice_multiplier * length(non_missing_choices)
    new_height <- ifelse(new_height > 20, 20, new_height)
    new_height <- ifelse(new_height < 1, 1, new_height)
    knitr::opts_chunk$set(fig.height = new_height)
}

wrap_at <- knitr::opts_chunk$get("fig.width") * 10
# todo: if there are free-text choices mingled in with the pre-defined ones, don't show
# todo: show rare items if they are pre-defined
# todo: bin rare responses into "other category"
if (!length(item_nomiss)) {
cat("No non-missing values to show.")
} else if (is.numeric(item_nomiss) || dplyr::n_distinct(item_nomiss) < 20) {
plot_labelled(item_nomiss, item_name, wrap_at, go_vertical)
} else {
cat(dplyr::n_distinct(item_nomiss), " unique, categorical values, so not shown.")
}
knitr::opts_chunk$set(fig.height = old_height)0 missing values.
Summary statistics
attributes(item) <- item_attributes
df = data.frame(item, stringsAsFactors = FALSE)
names(df) = html_item_name
escaped_table(codebook_table(df))| name | label | data_type | missing | complete | n | mean | sd | p0 | p25 | p50 | p75 | p100 | hist | format.spss | display_width |
|---|---|---|---|---|---|---|---|---|---|---|---|---|---|---|---|
| Pre_Anatomical_Hippocampus | Bilateral anatomical ROI Hippocampus Pre Therapy | numeric | 0 | 40 | 40 | 0.45 | 0.032 | 0.38 | 0.43 | 0.45 | 0.47 | 0.53 | ▁▂▃▇▅▃▁▁ | F8.2 | 17 |
if (show_missing_values) {
  plot_labelled(missing_values, item_name, wrap_at)
}
if (!is.null(item_info)) {
# don't show choices again, if they're basically same thing as value labels
if (!is.null(choices) && !is.null(item_info$choices) &&
all(names(na.omit(choices)) == item_info$choices) &&
all(na.omit(choices) == names(item_info$choices))) {
item_info$choices <- NULL
}
item_info$label_parsed <-
item_info$choice_list <- item_info$study_id <- item_info$id <- NULL
pander::pander(item_info)
}if (!is.null(choices) && length(choices) && length(choices) < 30) {
pander::pander(as.list(choices))
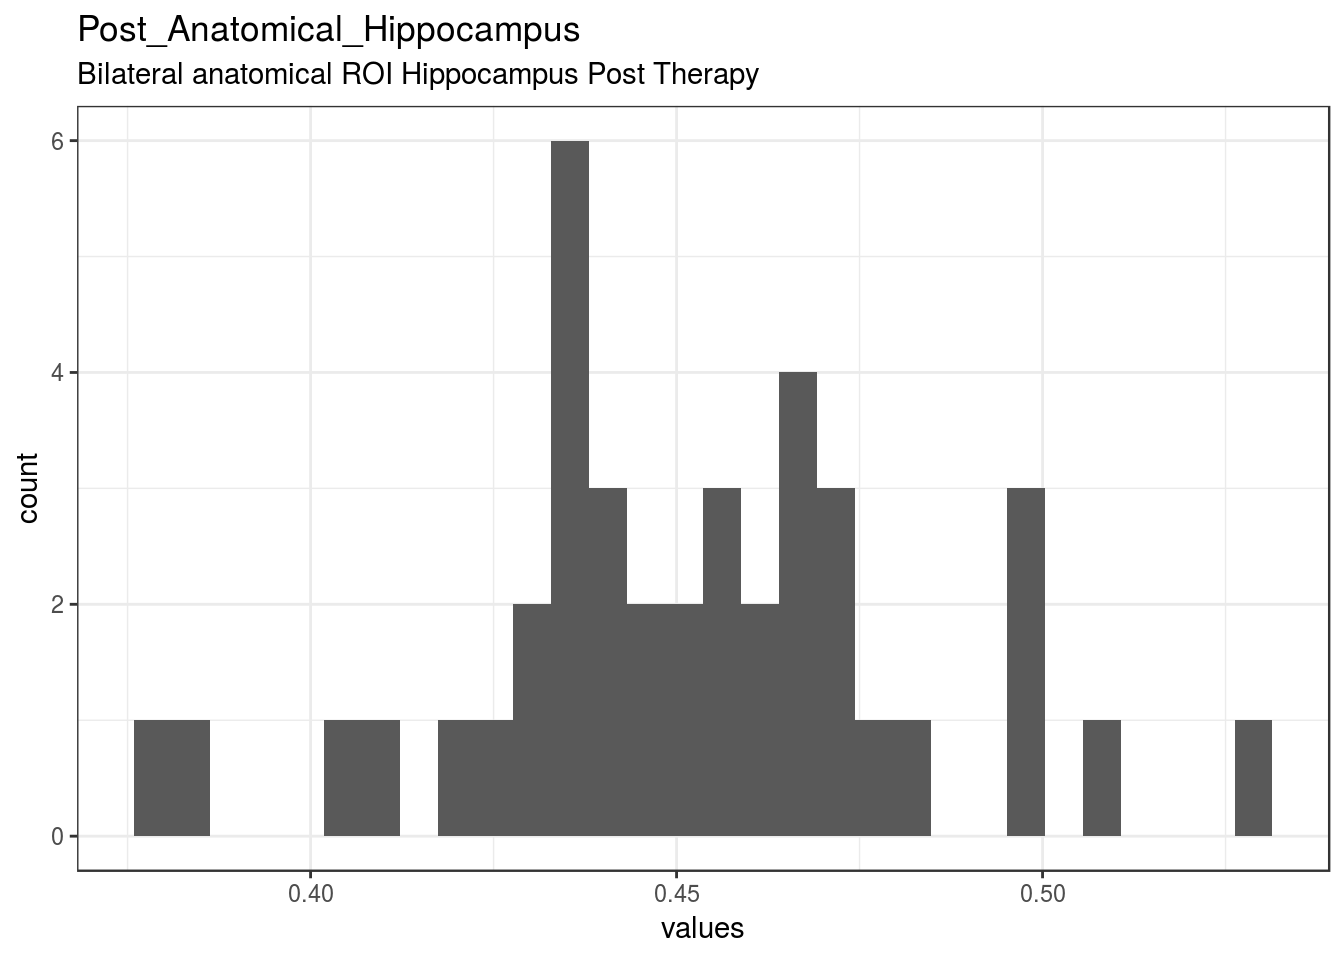
}Post_Anatomical_Hippocampus
Bilateral anatomical ROI Hippocampus Post Therapy
Distribution
show_missing_values <- FALSE
if (has_labels(item)) {
  missing_values <- item[is.na(haven::zap_missing(item))]
  attributes(missing_values) <- attributes(item)
  if (!is.null(attributes(item)$labels)) {
    attributes(missing_values)$labels <- attributes(missing_values)$labels[is.na(attributes(missing_values)$labels)]
    attributes(item)$labels <- attributes(item)$labels[!is.na(attributes(item)$labels)]
  }
  if (is.double(item)) {
    show_missing_values <- length(unique(haven::na_tag(missing_values))) > 1
    item <- haven::zap_missing(item)
  }
  if (length(item_attributes$labels) == 0 && is.numeric(item)) {
    item <- haven::zap_labels(item)
  }
}
item_nomiss <- item[!is.na(item)]

# unnest mc_multiple and so on
if (
  is.character(item_nomiss) &&
  stringr::str_detect(item_nomiss, stringr::fixed(", ")) &&
  (exists("type", item_info) &&
    stringr::str_detect(item_info$type, pattern = stringr::fixed("multiple")))
  ) {
  item_nomiss <- unlist(stringr::str_split(item_nomiss, pattern = stringr::fixed(", ")))
}
attributes(item_nomiss) <- attributes(item)

old_height <- knitr::opts_chunk$get("fig.height")
non_missing_choices <- item_attributes[["labels"]]
many_labels <- length(non_missing_choices) > 7
go_vertical <- !is.numeric(item_nomiss) || many_labels
if ( go_vertical ) {
  # numeric items are plotted horizontally (because that's what usually expected)
  # categorical items are plotted vertically because we can use the screen real estate better this way

    if (is.null(choices) ||
        dplyr::n_distinct(item_nomiss) > length(non_missing_choices)) {
        non_missing_choices <- unique(item_nomiss)
        names(non_missing_choices) <- non_missing_choices
    }
  choice_multiplier <- old_height/6.5
    new_height <- 2 + choice_multiplier * length(non_missing_choices)
    new_height <- ifelse(new_height > 20, 20, new_height)
    new_height <- ifelse(new_height < 1, 1, new_height)
    knitr::opts_chunk$set(fig.height = new_height)
}

wrap_at <- knitr::opts_chunk$get("fig.width") * 10
# todo: if there are free-text choices mingled in with the pre-defined ones, don't show
# todo: show rare items if they are pre-defined
# todo: bin rare responses into "other category"
if (!length(item_nomiss)) {
cat("No non-missing values to show.")
} else if (is.numeric(item_nomiss) || dplyr::n_distinct(item_nomiss) < 20) {
plot_labelled(item_nomiss, item_name, wrap_at, go_vertical)
} else {
cat(dplyr::n_distinct(item_nomiss), " unique, categorical values, so not shown.")
}
knitr::opts_chunk$set(fig.height = old_height)0 missing values.
Summary statistics
attributes(item) <- item_attributes
df = data.frame(item, stringsAsFactors = FALSE)
names(df) = html_item_name
escaped_table(codebook_table(df))| name | label | data_type | missing | complete | n | mean | sd | p0 | p25 | p50 | p75 | p100 | hist | format.spss | display_width |
|---|---|---|---|---|---|---|---|---|---|---|---|---|---|---|---|
| Post_Anatomical_Hippocampus | Bilateral anatomical ROI Hippocampus Post Therapy | numeric | 0 | 40 | 40 | 0.45 | 0.031 | 0.38 | 0.44 | 0.45 | 0.47 | 0.53 | ▂▂▆▇▇▂▃▁ | F8.2 | 18 |
if (show_missing_values) {
  plot_labelled(missing_values, item_name, wrap_at)
}
if (!is.null(item_info)) {
# don't show choices again, if they're basically same thing as value labels
if (!is.null(choices) && !is.null(item_info$choices) &&
all(names(na.omit(choices)) == item_info$choices) &&
all(na.omit(choices) == names(item_info$choices))) {
item_info$choices <- NULL
}
item_info$label_parsed <-
item_info$choice_list <- item_info$study_id <- item_info$id <- NULL
pander::pander(item_info)
}if (!is.null(choices) && length(choices) && length(choices) < 30) {
pander::pander(as.list(choices))
}Pre_MetaAnalysis_Hippocampus
PTSD Meta Analysis Hippocampal Cluster Pre Therapy
Distribution
show_missing_values <- FALSE
if (has_labels(item)) {
  missing_values <- item[is.na(haven::zap_missing(item))]
  attributes(missing_values) <- attributes(item)
  if (!is.null(attributes(item)$labels)) {
    attributes(missing_values)$labels <- attributes(missing_values)$labels[is.na(attributes(missing_values)$labels)]
    attributes(item)$labels <- attributes(item)$labels[!is.na(attributes(item)$labels)]
  }
  if (is.double(item)) {
    show_missing_values <- length(unique(haven::na_tag(missing_values))) > 1
    item <- haven::zap_missing(item)
  }
  if (length(item_attributes$labels) == 0 && is.numeric(item)) {
    item <- haven::zap_labels(item)
  }
}
item_nomiss <- item[!is.na(item)]

# unnest mc_multiple and so on
if (
  is.character(item_nomiss) &&
  stringr::str_detect(item_nomiss, stringr::fixed(", ")) &&
  (exists("type", item_info) &&
    stringr::str_detect(item_info$type, pattern = stringr::fixed("multiple")))
  ) {
  item_nomiss <- unlist(stringr::str_split(item_nomiss, pattern = stringr::fixed(", ")))
}
attributes(item_nomiss) <- attributes(item)

old_height <- knitr::opts_chunk$get("fig.height")
non_missing_choices <- item_attributes[["labels"]]
many_labels <- length(non_missing_choices) > 7
go_vertical <- !is.numeric(item_nomiss) || many_labels
if ( go_vertical ) {
  # numeric items are plotted horizontally (because that's what usually expected)
  # categorical items are plotted vertically because we can use the screen real estate better this way

    if (is.null(choices) ||
        dplyr::n_distinct(item_nomiss) > length(non_missing_choices)) {
        non_missing_choices <- unique(item_nomiss)
        names(non_missing_choices) <- non_missing_choices
    }
  choice_multiplier <- old_height/6.5
    new_height <- 2 + choice_multiplier * length(non_missing_choices)
    new_height <- ifelse(new_height > 20, 20, new_height)
    new_height <- ifelse(new_height < 1, 1, new_height)
    knitr::opts_chunk$set(fig.height = new_height)
}

wrap_at <- knitr::opts_chunk$get("fig.width") * 10
# todo: if there are free-text choices mingled in with the pre-defined ones, don't show
# todo: show rare items if they are pre-defined
# todo: bin rare responses into "other category"
if (!length(item_nomiss)) {
cat("No non-missing values to show.")
} else if (is.numeric(item_nomiss) || dplyr::n_distinct(item_nomiss) < 20) {
plot_labelled(item_nomiss, item_name, wrap_at, go_vertical)
} else {
cat(dplyr::n_distinct(item_nomiss), " unique, categorical values, so not shown.")
}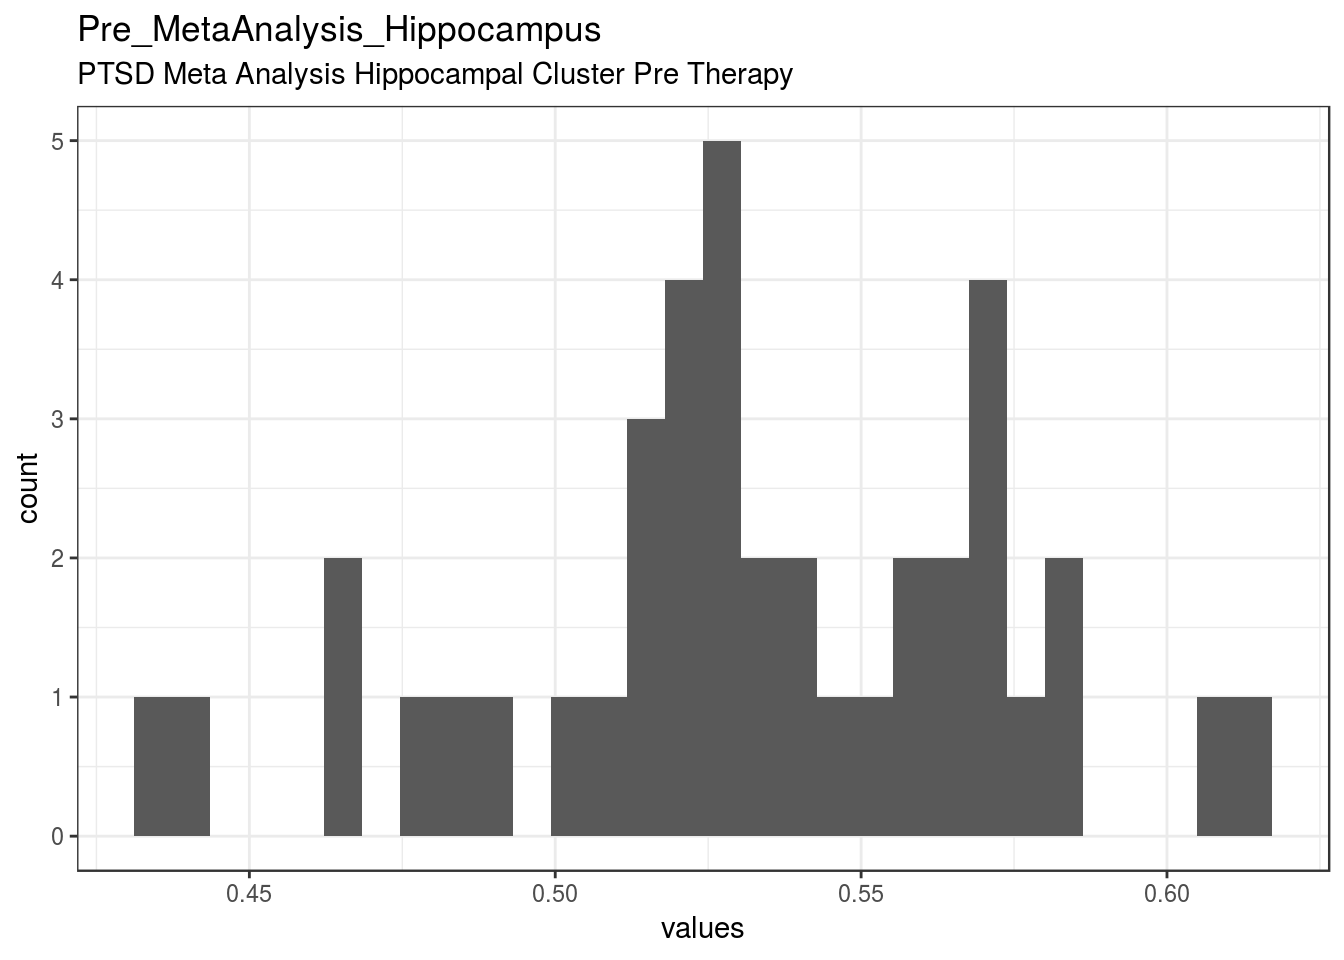
knitr::opts_chunk$set(fig.height = old_height)0 missing values.
Summary statistics
attributes(item) <- item_attributes
df = data.frame(item, stringsAsFactors = FALSE)
names(df) = html_item_name
escaped_table(codebook_table(df))| name | label | data_type | missing | complete | n | mean | sd | p0 | p25 | p50 | p75 | p100 | hist | format.spss | display_width |
|---|---|---|---|---|---|---|---|---|---|---|---|---|---|---|---|
| Pre_MetaAnalysis_Hippocampus | PTSD Meta Analysis Hippocampal Cluster Pre Therapy | numeric | 0 | 40 | 40 | 0.53 | 0.041 | 0.44 | 0.51 | 0.53 | 0.56 | 0.62 | ▂▂▂▇▇▆▅▂ | F17.4 | 11 |
if (show_missing_values) {
  plot_labelled(missing_values, item_name, wrap_at)
}
if (!is.null(item_info)) {
# don't show choices again, if they're basically same thing as value labels
if (!is.null(choices) && !is.null(item_info$choices) &&
all(names(na.omit(choices)) == item_info$choices) &&
all(na.omit(choices) == names(item_info$choices))) {
item_info$choices <- NULL
}
item_info$label_parsed <-
item_info$choice_list <- item_info$study_id <- item_info$id <- NULL
pander::pander(item_info)
}if (!is.null(choices) && length(choices) && length(choices) < 30) {
pander::pander(as.list(choices))
}Post_MetaAnalysis_Hippocampus
PTSD Meta Analysis Hippocampal Cluster Post Therapy
Distribution
show_missing_values <- FALSE
if (has_labels(item)) {
  missing_values <- item[is.na(haven::zap_missing(item))]
  attributes(missing_values) <- attributes(item)
  if (!is.null(attributes(item)$labels)) {
    attributes(missing_values)$labels <- attributes(missing_values)$labels[is.na(attributes(missing_values)$labels)]
    attributes(item)$labels <- attributes(item)$labels[!is.na(attributes(item)$labels)]
  }
  if (is.double(item)) {
    show_missing_values <- length(unique(haven::na_tag(missing_values))) > 1
    item <- haven::zap_missing(item)
  }
  if (length(item_attributes$labels) == 0 && is.numeric(item)) {
    item <- haven::zap_labels(item)
  }
}
item_nomiss <- item[!is.na(item)]

# unnest mc_multiple and so on
if (
  is.character(item_nomiss) &&
  stringr::str_detect(item_nomiss, stringr::fixed(", ")) &&
  (exists("type", item_info) &&
    stringr::str_detect(item_info$type, pattern = stringr::fixed("multiple")))
  ) {
  item_nomiss <- unlist(stringr::str_split(item_nomiss, pattern = stringr::fixed(", ")))
}
attributes(item_nomiss) <- attributes(item)

old_height <- knitr::opts_chunk$get("fig.height")
non_missing_choices <- item_attributes[["labels"]]
many_labels <- length(non_missing_choices) > 7
go_vertical <- !is.numeric(item_nomiss) || many_labels
if ( go_vertical ) {
  # numeric items are plotted horizontally (because that's what usually expected)
  # categorical items are plotted vertically because we can use the screen real estate better this way

    if (is.null(choices) ||
        dplyr::n_distinct(item_nomiss) > length(non_missing_choices)) {
        non_missing_choices <- unique(item_nomiss)
        names(non_missing_choices) <- non_missing_choices
    }
  choice_multiplier <- old_height/6.5
    new_height <- 2 + choice_multiplier * length(non_missing_choices)
    new_height <- ifelse(new_height > 20, 20, new_height)
    new_height <- ifelse(new_height < 1, 1, new_height)
    knitr::opts_chunk$set(fig.height = new_height)
}

wrap_at <- knitr::opts_chunk$get("fig.width") * 10
# todo: if there are free-text choices mingled in with the pre-defined ones, don't show
# todo: show rare items if they are pre-defined
# todo: bin rare responses into "other category"
if (!length(item_nomiss)) {
cat("No non-missing values to show.")
} else if (is.numeric(item_nomiss) || dplyr::n_distinct(item_nomiss) < 20) {
plot_labelled(item_nomiss, item_name, wrap_at, go_vertical)
} else {
cat(dplyr::n_distinct(item_nomiss), " unique, categorical values, so not shown.")
}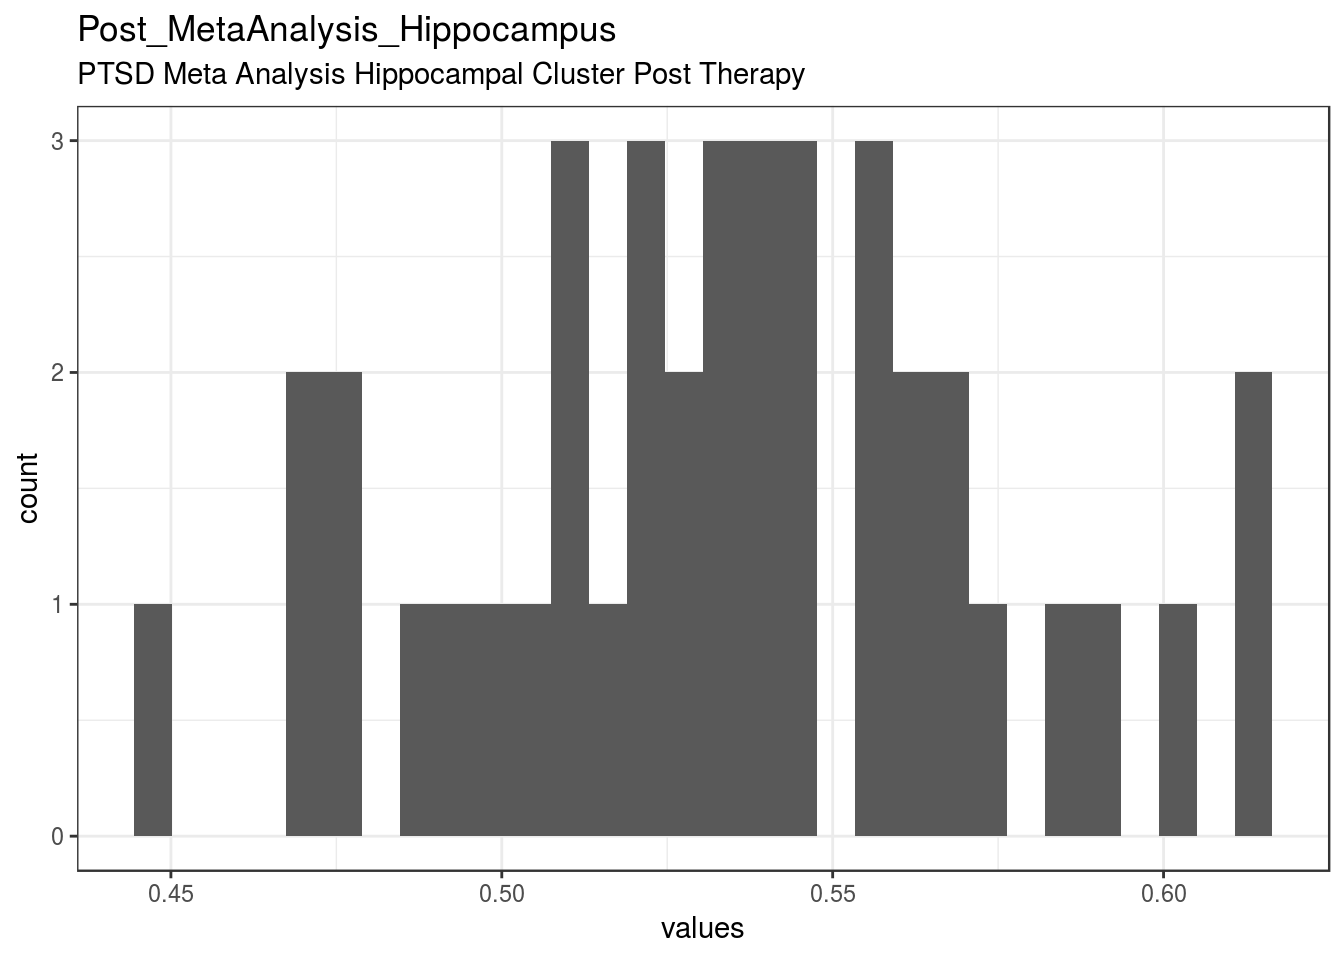
knitr::opts_chunk$set(fig.height = old_height)0 missing values.
Summary statistics
attributes(item) <- item_attributes
df = data.frame(item, stringsAsFactors = FALSE)
names(df) = html_item_name
escaped_table(codebook_table(df))| name | label | data_type | missing | complete | n | mean | sd | p0 | p25 | p50 | p75 | p100 | hist | format.spss | display_width |
|---|---|---|---|---|---|---|---|---|---|---|---|---|---|---|---|
| Post_MetaAnalysis_Hippocampus | PTSD Meta Analysis Hippocampal Cluster Post Therapy | numeric | 0 | 40 | 40 | 0.53 | 0.039 | 0.45 | 0.51 | 0.53 | 0.56 | 0.62 | ▁▃▃▇▆▆▂▂ | F17.4 | 11 |
if (show_missing_values) {
  plot_labelled(missing_values, item_name, wrap_at)
}
if (!is.null(item_info)) {
# don't show choices again, if they're basically same thing as value labels
if (!is.null(choices) && !is.null(item_info$choices) &&
all(names(na.omit(choices)) == item_info$choices) &&
all(na.omit(choices) == names(item_info$choices))) {
item_info$choices <- NULL
}
item_info$label_parsed <-
item_info$choice_list <- item_info$study_id <- item_info$id <- NULL
pander::pander(item_info)
}if (!is.null(choices) && length(choices) && length(choices) < 30) {
pander::pander(as.list(choices))
}Cat12_Hippocampus_Change
Whole Brain Analyis Hippocampal Cluster Change Post therapy minus Pre therapy
Distribution
show_missing_values <- FALSE
if (has_labels(item)) {
  missing_values <- item[is.na(haven::zap_missing(item))]
  attributes(missing_values) <- attributes(item)
  if (!is.null(attributes(item)$labels)) {
    attributes(missing_values)$labels <- attributes(missing_values)$labels[is.na(attributes(missing_values)$labels)]
    attributes(item)$labels <- attributes(item)$labels[!is.na(attributes(item)$labels)]
  }
  if (is.double(item)) {
    show_missing_values <- length(unique(haven::na_tag(missing_values))) > 1
    item <- haven::zap_missing(item)
  }
  if (length(item_attributes$labels) == 0 && is.numeric(item)) {
    item <- haven::zap_labels(item)
  }
}
item_nomiss <- item[!is.na(item)]

# unnest mc_multiple and so on
if (
  is.character(item_nomiss) &&
  stringr::str_detect(item_nomiss, stringr::fixed(", ")) &&
  (exists("type", item_info) &&
    stringr::str_detect(item_info$type, pattern = stringr::fixed("multiple")))
  ) {
  item_nomiss <- unlist(stringr::str_split(item_nomiss, pattern = stringr::fixed(", ")))
}
attributes(item_nomiss) <- attributes(item)

old_height <- knitr::opts_chunk$get("fig.height")
non_missing_choices <- item_attributes[["labels"]]
many_labels <- length(non_missing_choices) > 7
go_vertical <- !is.numeric(item_nomiss) || many_labels
if ( go_vertical ) {
  # numeric items are plotted horizontally (because that's what usually expected)
  # categorical items are plotted vertically because we can use the screen real estate better this way

    if (is.null(choices) ||
        dplyr::n_distinct(item_nomiss) > length(non_missing_choices)) {
        non_missing_choices <- unique(item_nomiss)
        names(non_missing_choices) <- non_missing_choices
    }
  choice_multiplier <- old_height/6.5
    new_height <- 2 + choice_multiplier * length(non_missing_choices)
    new_height <- ifelse(new_height > 20, 20, new_height)
    new_height <- ifelse(new_height < 1, 1, new_height)
    knitr::opts_chunk$set(fig.height = new_height)
}

wrap_at <- knitr::opts_chunk$get("fig.width") * 10
# todo: if there are free-text choices mingled in with the pre-defined ones, don't show
# todo: show rare items if they are pre-defined
# todo: bin rare responses into "other category"
if (!length(item_nomiss)) {
cat("No non-missing values to show.")
} else if (is.numeric(item_nomiss) || dplyr::n_distinct(item_nomiss) < 20) {
plot_labelled(item_nomiss, item_name, wrap_at, go_vertical)
} else {
cat(dplyr::n_distinct(item_nomiss), " unique, categorical values, so not shown.")
}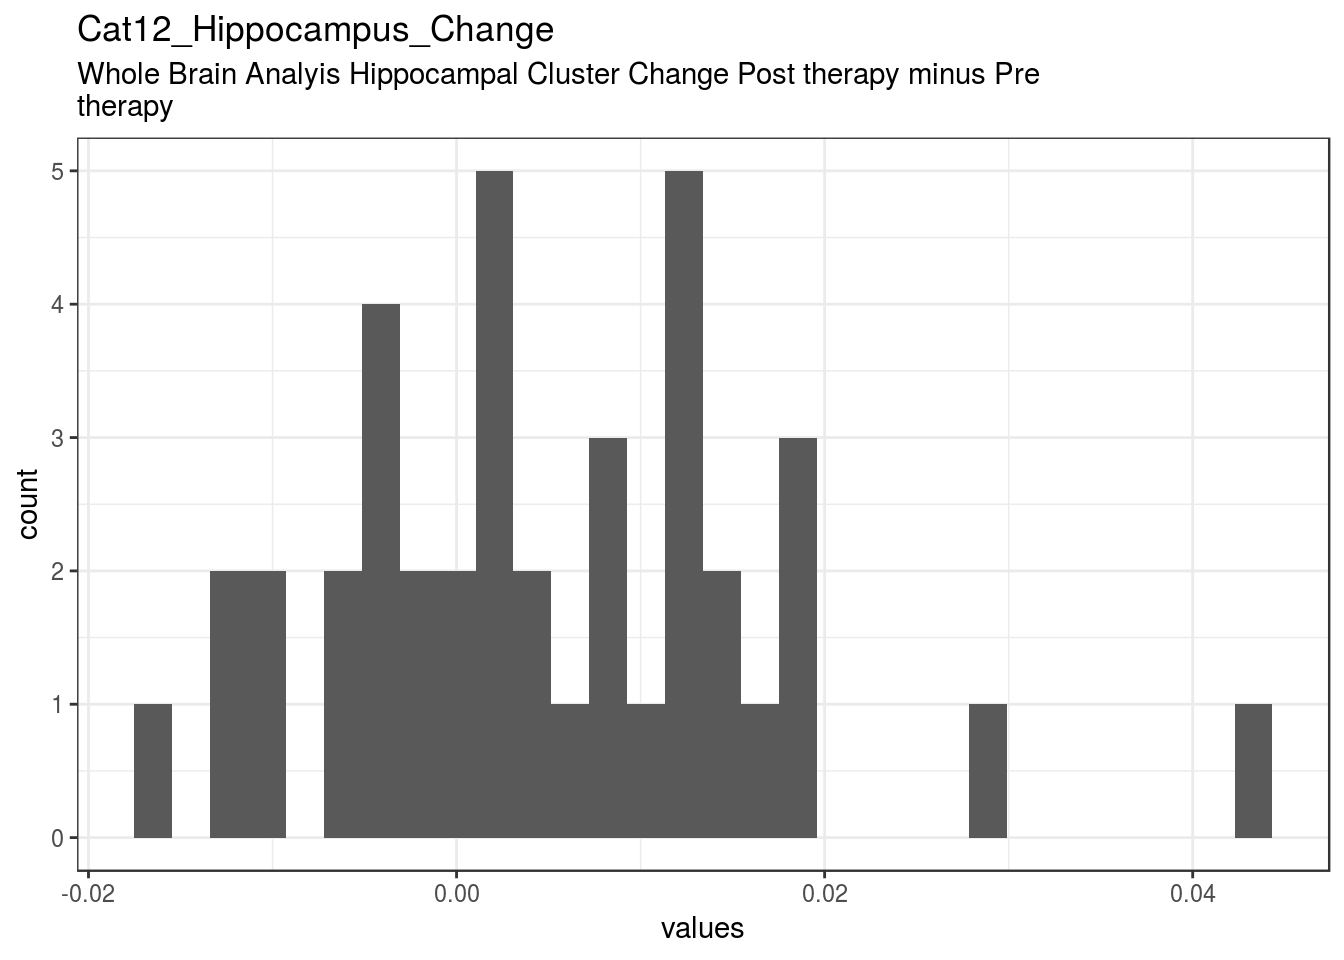
knitr::opts_chunk$set(fig.height = old_height)0 missing values.
Summary statistics
attributes(item) <- item_attributes
df = data.frame(item, stringsAsFactors = FALSE)
names(df) = html_item_name
escaped_table(codebook_table(df))| name | label | data_type | missing | complete | n | mean | sd | p0 | p25 | p50 | p75 | p100 | hist | format.spss | display_width |
|---|---|---|---|---|---|---|---|---|---|---|---|---|---|---|---|
| Cat12_Hippocampus_Change | Whole Brain Analyis Hippocampal Cluster Change Post therapy minus Pre therapy | numeric | 0 | 40 | 40 | 0.0051 | 0.012 | -0.017 | -0.0033 | 0.0036 | 0.013 | 0.043 | ▃▆▇▆▆▁▁▁ | F8.2 | 23 |
if (show_missing_values) {
  plot_labelled(missing_values, item_name, wrap_at)
}
if (!is.null(item_info)) {
# don't show choices again, if they're basically same thing as value labels
if (!is.null(choices) && !is.null(item_info$choices) &&
all(names(na.omit(choices)) == item_info$choices) &&
all(na.omit(choices) == names(item_info$choices))) {
item_info$choices <- NULL
}
item_info$label_parsed <-
item_info$choice_list <- item_info$study_id <- item_info$id <- NULL
pander::pander(item_info)
}if (!is.null(choices) && length(choices) && length(choices) < 30) {
pander::pander(as.list(choices))
}Anatomical_Hippocampus_Change
Bilateral anatomical ROI Hippocampus Change Post therapy minus Pre therapy
Distribution
show_missing_values <- FALSE
if (has_labels(item)) {
  missing_values <- item[is.na(haven::zap_missing(item))]
  attributes(missing_values) <- attributes(item)
  if (!is.null(attributes(item)$labels)) {
    attributes(missing_values)$labels <- attributes(missing_values)$labels[is.na(attributes(missing_values)$labels)]
    attributes(item)$labels <- attributes(item)$labels[!is.na(attributes(item)$labels)]
  }
  if (is.double(item)) {
    show_missing_values <- length(unique(haven::na_tag(missing_values))) > 1
    item <- haven::zap_missing(item)
  }
  if (length(item_attributes$labels) == 0 && is.numeric(item)) {
    item <- haven::zap_labels(item)
  }
}
item_nomiss <- item[!is.na(item)]

# unnest mc_multiple and so on
if (
  is.character(item_nomiss) &&
  stringr::str_detect(item_nomiss, stringr::fixed(", ")) &&
  (exists("type", item_info) &&
    stringr::str_detect(item_info$type, pattern = stringr::fixed("multiple")))
  ) {
  item_nomiss <- unlist(stringr::str_split(item_nomiss, pattern = stringr::fixed(", ")))
}
attributes(item_nomiss) <- attributes(item)

old_height <- knitr::opts_chunk$get("fig.height")
non_missing_choices <- item_attributes[["labels"]]
many_labels <- length(non_missing_choices) > 7
go_vertical <- !is.numeric(item_nomiss) || many_labels
if ( go_vertical ) {
  # numeric items are plotted horizontally (because that's what usually expected)
  # categorical items are plotted vertically because we can use the screen real estate better this way

    if (is.null(choices) ||
        dplyr::n_distinct(item_nomiss) > length(non_missing_choices)) {
        non_missing_choices <- unique(item_nomiss)
        names(non_missing_choices) <- non_missing_choices
    }
  choice_multiplier <- old_height/6.5
    new_height <- 2 + choice_multiplier * length(non_missing_choices)
    new_height <- ifelse(new_height > 20, 20, new_height)
    new_height <- ifelse(new_height < 1, 1, new_height)
    knitr::opts_chunk$set(fig.height = new_height)
}

wrap_at <- knitr::opts_chunk$get("fig.width") * 10
# todo: if there are free-text choices mingled in with the pre-defined ones, don't show
# todo: show rare items if they are pre-defined
# todo: bin rare responses into "other category"
if (!length(item_nomiss)) {
cat("No non-missing values to show.")
} else if (is.numeric(item_nomiss) || dplyr::n_distinct(item_nomiss) < 20) {
plot_labelled(item_nomiss, item_name, wrap_at, go_vertical)
} else {
cat(dplyr::n_distinct(item_nomiss), " unique, categorical values, so not shown.")
}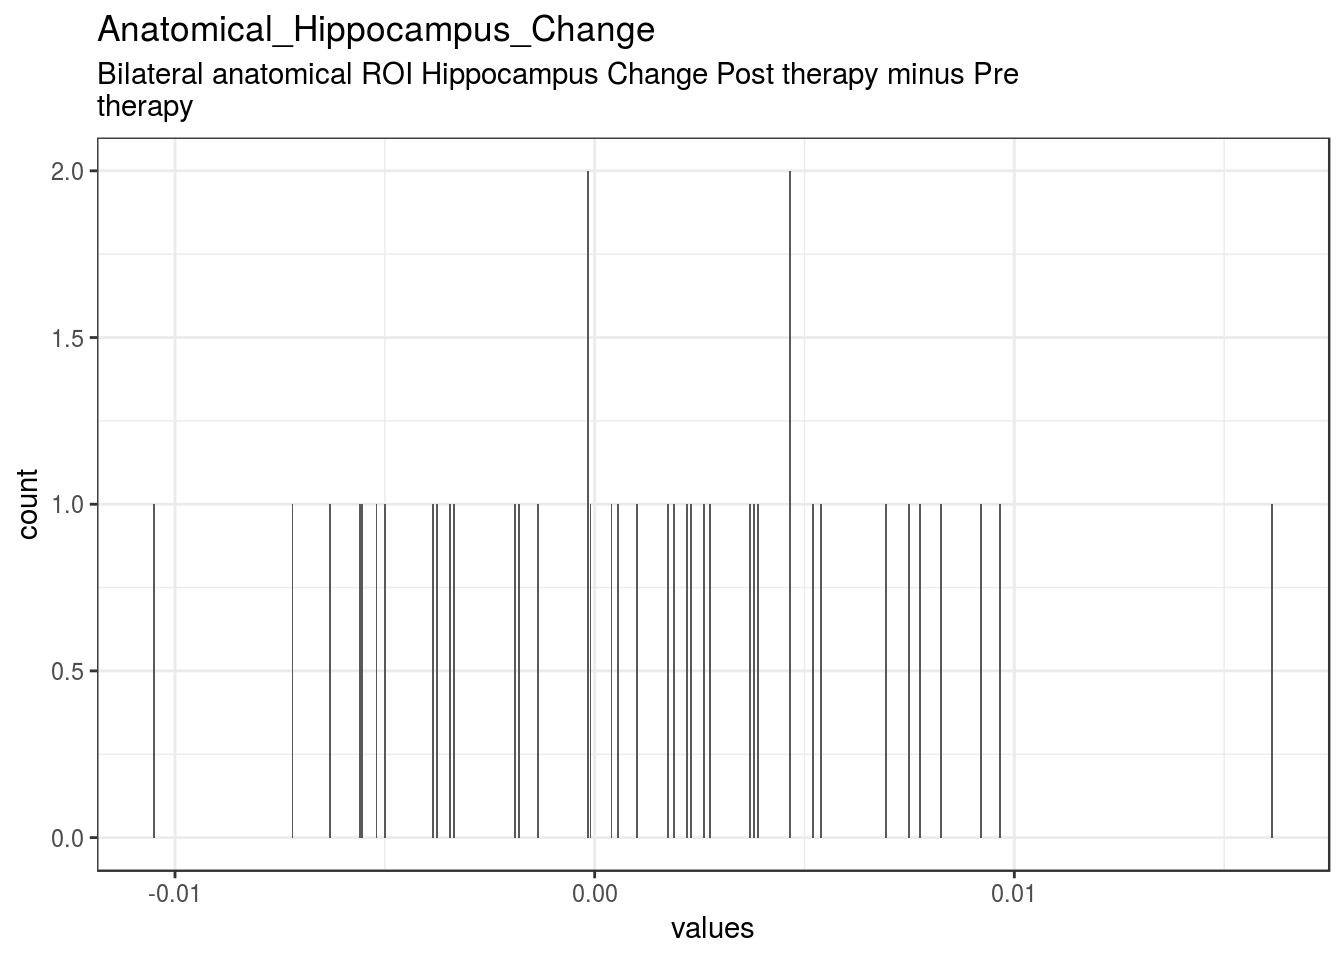
knitr::opts_chunk$set(fig.height = old_height)0 missing values.
Summary statistics
attributes(item) <- item_attributes
df = data.frame(item, stringsAsFactors = FALSE)
names(df) = html_item_name
escaped_table(codebook_table(df))| name | label | data_type | missing | complete | n | mean | sd | p0 | p25 | p50 | p75 | p100 | hist | format.spss | display_width |
|---|---|---|---|---|---|---|---|---|---|---|---|---|---|---|---|
| Anatomical_Hippocampus_Change | Bilateral anatomical ROI Hippocampus Change Post therapy minus Pre therapy | numeric | 0 | 40 | 40 | 0.0012 | 0.0055 | -0.01 | -0.0034 | 0.0014 | 0.0046 | 0.016 | ▁▃▃▇▅▃▁▁ | F8.6 | 20 |
if (show_missing_values) {
  plot_labelled(missing_values, item_name, wrap_at)
}
if (!is.null(item_info)) {
# don't show choices again, if they're basically same thing as value labels
if (!is.null(choices) && !is.null(item_info$choices) &&
all(names(na.omit(choices)) == item_info$choices) &&
all(na.omit(choices) == names(item_info$choices))) {
item_info$choices <- NULL
}
item_info$label_parsed <-
item_info$choice_list <- item_info$study_id <- item_info$id <- NULL
pander::pander(item_info)
}if (!is.null(choices) && length(choices) && length(choices) < 30) {
pander::pander(as.list(choices))
}MetaAnalysis_Hippocampus_Change
PTSD Meta Analysis Hippocampal Cluster Change Post therapy minus Pre therapy
Distribution
show_missing_values <- FALSE
if (has_labels(item)) {
  missing_values <- item[is.na(haven::zap_missing(item))]
  attributes(missing_values) <- attributes(item)
  if (!is.null(attributes(item)$labels)) {
    attributes(missing_values)$labels <- attributes(missing_values)$labels[is.na(attributes(missing_values)$labels)]
    attributes(item)$labels <- attributes(item)$labels[!is.na(attributes(item)$labels)]
  }
  if (is.double(item)) {
    show_missing_values <- length(unique(haven::na_tag(missing_values))) > 1
    item <- haven::zap_missing(item)
  }
  if (length(item_attributes$labels) == 0 && is.numeric(item)) {
    item <- haven::zap_labels(item)
  }
}
item_nomiss <- item[!is.na(item)]

# unnest mc_multiple and so on
if (
  is.character(item_nomiss) &&
  stringr::str_detect(item_nomiss, stringr::fixed(", ")) &&
  (exists("type", item_info) &&
    stringr::str_detect(item_info$type, pattern = stringr::fixed("multiple")))
  ) {
  item_nomiss <- unlist(stringr::str_split(item_nomiss, pattern = stringr::fixed(", ")))
}
attributes(item_nomiss) <- attributes(item)

old_height <- knitr::opts_chunk$get("fig.height")
non_missing_choices <- item_attributes[["labels"]]
many_labels <- length(non_missing_choices) > 7
go_vertical <- !is.numeric(item_nomiss) || many_labels
if ( go_vertical ) {
  # numeric items are plotted horizontally (because that's what usually expected)
  # categorical items are plotted vertically because we can use the screen real estate better this way

    if (is.null(choices) ||
        dplyr::n_distinct(item_nomiss) > length(non_missing_choices)) {
        non_missing_choices <- unique(item_nomiss)
        names(non_missing_choices) <- non_missing_choices
    }
  choice_multiplier <- old_height/6.5
    new_height <- 2 + choice_multiplier * length(non_missing_choices)
    new_height <- ifelse(new_height > 20, 20, new_height)
    new_height <- ifelse(new_height < 1, 1, new_height)
    knitr::opts_chunk$set(fig.height = new_height)
}

wrap_at <- knitr::opts_chunk$get("fig.width") * 10
# todo: if there are free-text choices mingled in with the pre-defined ones, don't show
# todo: show rare items if they are pre-defined
# todo: bin rare responses into "other category"
if (!length(item_nomiss)) {
cat("No non-missing values to show.")
} else if (is.numeric(item_nomiss) || dplyr::n_distinct(item_nomiss) < 20) {
plot_labelled(item_nomiss, item_name, wrap_at, go_vertical)
} else {
cat(dplyr::n_distinct(item_nomiss), " unique, categorical values, so not shown.")
}
knitr::opts_chunk$set(fig.height = old_height)0 missing values.
Summary statistics
attributes(item) <- item_attributes
df = data.frame(item, stringsAsFactors = FALSE)
names(df) = html_item_name
escaped_table(codebook_table(df))| name | label | data_type | missing | complete | n | mean | sd | p0 | p25 | p50 | p75 | p100 | hist | format.spss | display_width |
|---|---|---|---|---|---|---|---|---|---|---|---|---|---|---|---|
| MetaAnalysis_Hippocampus_Change | PTSD Meta Analysis Hippocampal Cluster Change Post therapy minus Pre therapy | numeric | 0 | 40 | 40 | 0.002 | 0.011 | -0.021 | -0.0052 | 0.0021 | 0.0076 | 0.036 | ▂▆▆▇▆▃▁▁ | F8.4 | 22 |
if (show_missing_values) {
  plot_labelled(missing_values, item_name, wrap_at)
}
if (!is.null(item_info)) {
# don't show choices again, if they're basically same thing as value labels
if (!is.null(choices) && !is.null(item_info$choices) &&
all(names(na.omit(choices)) == item_info$choices) &&
all(na.omit(choices) == names(item_info$choices))) {
item_info$choices <- NULL
}
item_info$label_parsed <-
item_info$choice_list <- item_info$study_id <- item_info$id <- NULL
pander::pander(item_info)
}if (!is.null(choices) && length(choices) && length(choices) < 30) {
pander::pander(as.list(choices))
}PDS_Sum_Pre
Posttraumatic Diagnostic Scale Pre Therapy
Distribution
show_missing_values <- FALSE
if (has_labels(item)) {
  missing_values <- item[is.na(haven::zap_missing(item))]
  attributes(missing_values) <- attributes(item)
  if (!is.null(attributes(item)$labels)) {
    attributes(missing_values)$labels <- attributes(missing_values)$labels[is.na(attributes(missing_values)$labels)]
    attributes(item)$labels <- attributes(item)$labels[!is.na(attributes(item)$labels)]
  }
  if (is.double(item)) {
    show_missing_values <- length(unique(haven::na_tag(missing_values))) > 1
    item <- haven::zap_missing(item)
  }
  if (length(item_attributes$labels) == 0 && is.numeric(item)) {
    item <- haven::zap_labels(item)
  }
}
item_nomiss <- item[!is.na(item)]

# unnest mc_multiple and so on
if (
  is.character(item_nomiss) &&
  stringr::str_detect(item_nomiss, stringr::fixed(", ")) &&
  (exists("type", item_info) &&
    stringr::str_detect(item_info$type, pattern = stringr::fixed("multiple")))
  ) {
  item_nomiss <- unlist(stringr::str_split(item_nomiss, pattern = stringr::fixed(", ")))
}
attributes(item_nomiss) <- attributes(item)

old_height <- knitr::opts_chunk$get("fig.height")
non_missing_choices <- item_attributes[["labels"]]
many_labels <- length(non_missing_choices) > 7
go_vertical <- !is.numeric(item_nomiss) || many_labels
if ( go_vertical ) {
  # numeric items are plotted horizontally (because that's what usually expected)
  # categorical items are plotted vertically because we can use the screen real estate better this way

    if (is.null(choices) ||
        dplyr::n_distinct(item_nomiss) > length(non_missing_choices)) {
        non_missing_choices <- unique(item_nomiss)
        names(non_missing_choices) <- non_missing_choices
    }
  choice_multiplier <- old_height/6.5
    new_height <- 2 + choice_multiplier * length(non_missing_choices)
    new_height <- ifelse(new_height > 20, 20, new_height)
    new_height <- ifelse(new_height < 1, 1, new_height)
    knitr::opts_chunk$set(fig.height = new_height)
}

wrap_at <- knitr::opts_chunk$get("fig.width") * 10
# todo: if there are free-text choices mingled in with the pre-defined ones, don't show
# todo: show rare items if they are pre-defined
# todo: bin rare responses into "other category"
if (!length(item_nomiss)) {
cat("No non-missing values to show.")
} else if (is.numeric(item_nomiss) || dplyr::n_distinct(item_nomiss) < 20) {
plot_labelled(item_nomiss, item_name, wrap_at, go_vertical)
} else {
cat(dplyr::n_distinct(item_nomiss), " unique, categorical values, so not shown.")
}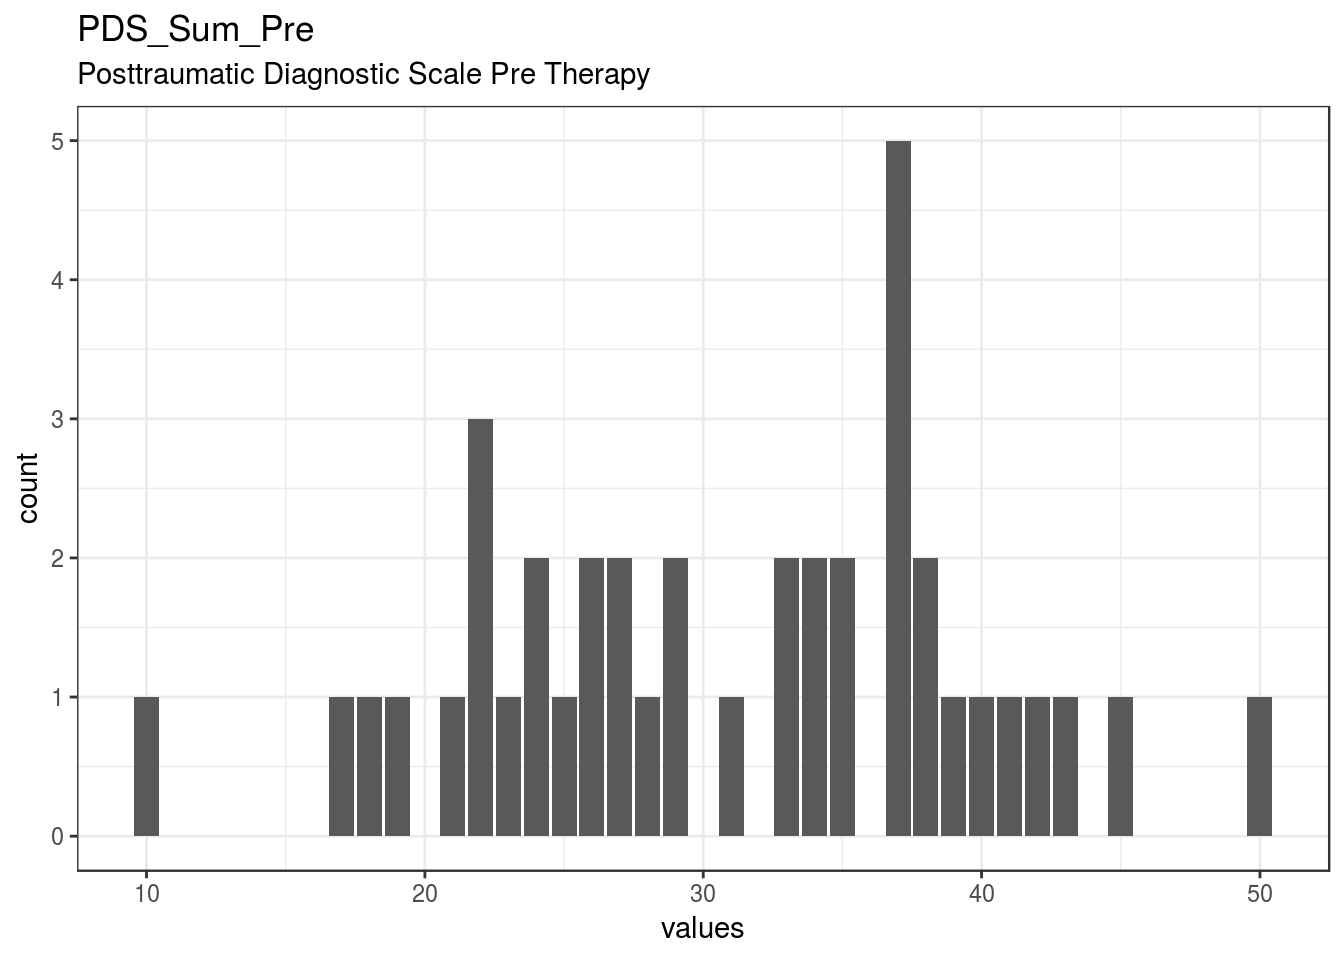
knitr::opts_chunk$set(fig.height = old_height)0 missing values.
Summary statistics
attributes(item) <- item_attributes
df = data.frame(item, stringsAsFactors = FALSE)
names(df) = html_item_name
escaped_table(codebook_table(df))| name | label | data_type | missing | complete | n | mean | sd | p0 | p25 | p50 | p75 | p100 | hist | format.spss | display_width |
|---|---|---|---|---|---|---|---|---|---|---|---|---|---|---|---|
| PDS_Sum_Pre | Posttraumatic Diagnostic Scale Pre Therapy | numeric | 0 | 40 | 40 | 30.88 | 8.76 | 10 | 24 | 32 | 37 | 50 | ▁▂▇▆▆▇▃▁ | F6.0 | 6 |
if (show_missing_values) {
  plot_labelled(missing_values, item_name, wrap_at)
}
if (!is.null(item_info)) {
# don't show choices again, if they're basically same thing as value labels
if (!is.null(choices) && !is.null(item_info$choices) &&
all(names(na.omit(choices)) == item_info$choices) &&
all(na.omit(choices) == names(item_info$choices))) {
item_info$choices <- NULL
}
item_info$label_parsed <-
item_info$choice_list <- item_info$study_id <- item_info$id <- NULL
pander::pander(item_info)
}if (!is.null(choices) && length(choices) && length(choices) < 30) {
pander::pander(as.list(choices))
}PDS_Sum_Post
Posttraumatic Diagnostic Scale Post Therapy
Distribution
show_missing_values <- FALSE
if (has_labels(item)) {
  missing_values <- item[is.na(haven::zap_missing(item))]
  attributes(missing_values) <- attributes(item)
  if (!is.null(attributes(item)$labels)) {
    attributes(missing_values)$labels <- attributes(missing_values)$labels[is.na(attributes(missing_values)$labels)]
    attributes(item)$labels <- attributes(item)$labels[!is.na(attributes(item)$labels)]
  }
  if (is.double(item)) {
    show_missing_values <- length(unique(haven::na_tag(missing_values))) > 1
    item <- haven::zap_missing(item)
  }
  if (length(item_attributes$labels) == 0 && is.numeric(item)) {
    item <- haven::zap_labels(item)
  }
}
item_nomiss <- item[!is.na(item)]

# unnest mc_multiple and so on
if (
  is.character(item_nomiss) &&
  stringr::str_detect(item_nomiss, stringr::fixed(", ")) &&
  (exists("type", item_info) &&
    stringr::str_detect(item_info$type, pattern = stringr::fixed("multiple")))
  ) {
  item_nomiss <- unlist(stringr::str_split(item_nomiss, pattern = stringr::fixed(", ")))
}
attributes(item_nomiss) <- attributes(item)

old_height <- knitr::opts_chunk$get("fig.height")
non_missing_choices <- item_attributes[["labels"]]
many_labels <- length(non_missing_choices) > 7
go_vertical <- !is.numeric(item_nomiss) || many_labels
if ( go_vertical ) {
  # numeric items are plotted horizontally (because that's what usually expected)
  # categorical items are plotted vertically because we can use the screen real estate better this way

    if (is.null(choices) ||
        dplyr::n_distinct(item_nomiss) > length(non_missing_choices)) {
        non_missing_choices <- unique(item_nomiss)
        names(non_missing_choices) <- non_missing_choices
    }
  choice_multiplier <- old_height/6.5
    new_height <- 2 + choice_multiplier * length(non_missing_choices)
    new_height <- ifelse(new_height > 20, 20, new_height)
    new_height <- ifelse(new_height < 1, 1, new_height)
    knitr::opts_chunk$set(fig.height = new_height)
}

wrap_at <- knitr::opts_chunk$get("fig.width") * 10
# todo: if there are free-text choices mingled in with the pre-defined ones, don't show
# todo: show rare items if they are pre-defined
# todo: bin rare responses into "other category"
if (!length(item_nomiss)) {
cat("No non-missing values to show.")
} else if (is.numeric(item_nomiss) || dplyr::n_distinct(item_nomiss) < 20) {
plot_labelled(item_nomiss, item_name, wrap_at, go_vertical)
} else {
cat(dplyr::n_distinct(item_nomiss), " unique, categorical values, so not shown.")
}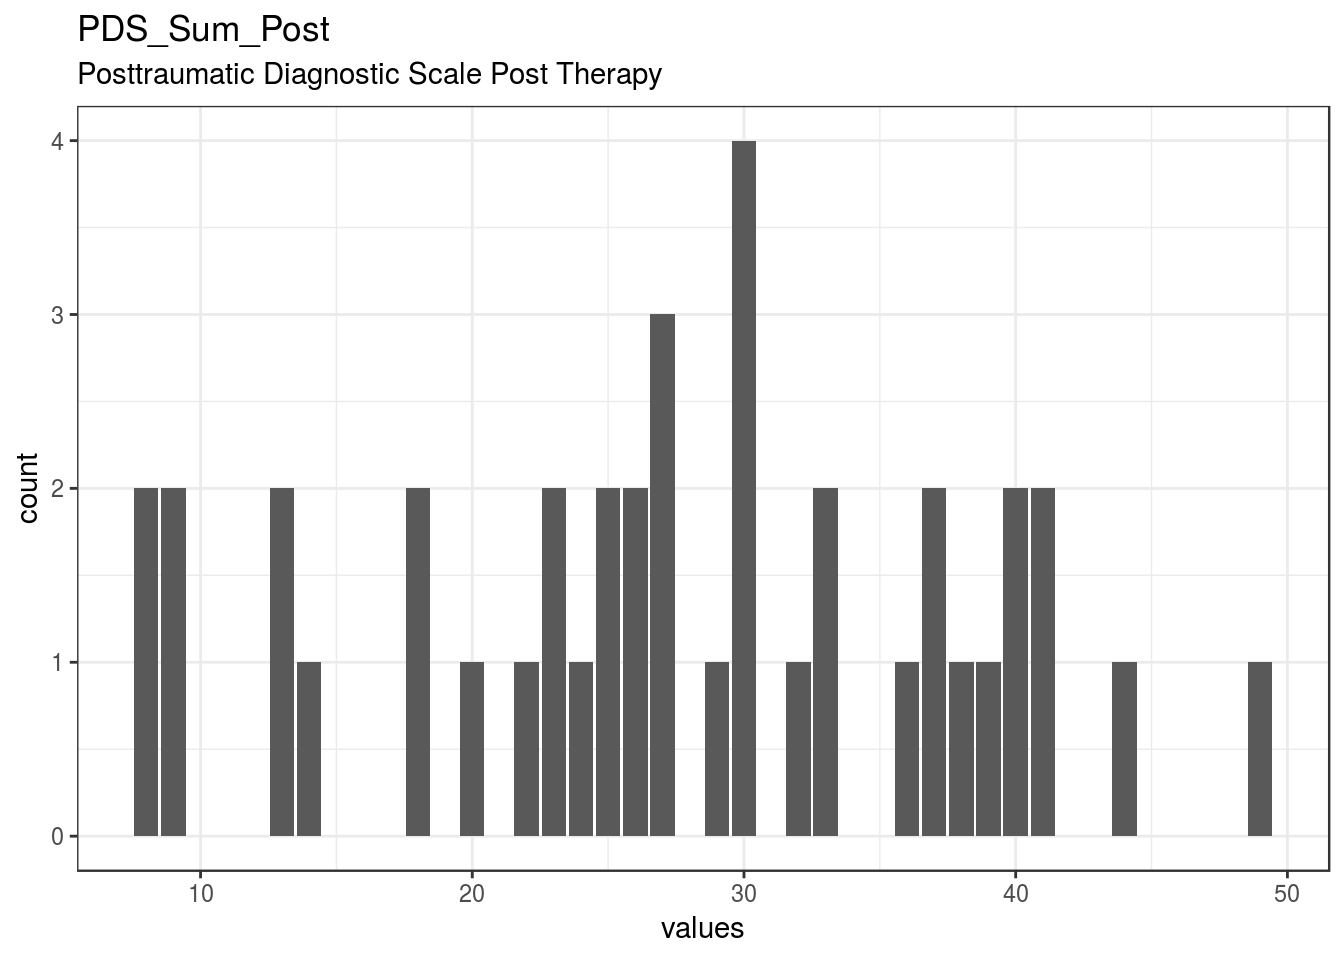
knitr::opts_chunk$set(fig.height = old_height)0 missing values.
Summary statistics
attributes(item) <- item_attributes
df = data.frame(item, stringsAsFactors = FALSE)
names(df) = html_item_name
escaped_table(codebook_table(df))| name | label | data_type | missing | complete | n | mean | sd | p0 | p25 | p50 | p75 | p100 | hist | format.spss | display_width |
|---|---|---|---|---|---|---|---|---|---|---|---|---|---|---|---|
| PDS_Sum_Post | Posttraumatic Diagnostic Scale Post Therapy | numeric | 0 | 40 | 40 | 27.35 | 10.62 | 8 | 21.5 | 27 | 36.25 | 49 | ▆▃▃▇▇▃▅▂ | F6.0 | 6 |
if (show_missing_values) {
  plot_labelled(missing_values, item_name, wrap_at)
}
if (!is.null(item_info)) {
# don't show choices again, if they're basically same thing as value labels
if (!is.null(choices) && !is.null(item_info$choices) &&
all(names(na.omit(choices)) == item_info$choices) &&
all(na.omit(choices) == names(item_info$choices))) {
item_info$choices <- NULL
}
item_info$label_parsed <-
item_info$choice_list <- item_info$study_id <- item_info$id <- NULL
pander::pander(item_info)
}if (!is.null(choices) && length(choices) && length(choices) < 30) {
pander::pander(as.list(choices))
}PDS_Sum_Follow_Up
Posttraumatic Diagnostic Scale Follow Up
Distribution
show_missing_values <- FALSE
if (has_labels(item)) {
  missing_values <- item[is.na(haven::zap_missing(item))]
  attributes(missing_values) <- attributes(item)
  if (!is.null(attributes(item)$labels)) {
    attributes(missing_values)$labels <- attributes(missing_values)$labels[is.na(attributes(missing_values)$labels)]
    attributes(item)$labels <- attributes(item)$labels[!is.na(attributes(item)$labels)]
  }
  if (is.double(item)) {
    show_missing_values <- length(unique(haven::na_tag(missing_values))) > 1
    item <- haven::zap_missing(item)
  }
  if (length(item_attributes$labels) == 0 && is.numeric(item)) {
    item <- haven::zap_labels(item)
  }
}
item_nomiss <- item[!is.na(item)]

# unnest mc_multiple and so on
if (
  is.character(item_nomiss) &&
  stringr::str_detect(item_nomiss, stringr::fixed(", ")) &&
  (exists("type", item_info) &&
    stringr::str_detect(item_info$type, pattern = stringr::fixed("multiple")))
  ) {
  item_nomiss <- unlist(stringr::str_split(item_nomiss, pattern = stringr::fixed(", ")))
}
attributes(item_nomiss) <- attributes(item)

old_height <- knitr::opts_chunk$get("fig.height")
non_missing_choices <- item_attributes[["labels"]]
many_labels <- length(non_missing_choices) > 7
go_vertical <- !is.numeric(item_nomiss) || many_labels
if ( go_vertical ) {
  # numeric items are plotted horizontally (because that's what usually expected)
  # categorical items are plotted vertically because we can use the screen real estate better this way

    if (is.null(choices) ||
        dplyr::n_distinct(item_nomiss) > length(non_missing_choices)) {
        non_missing_choices <- unique(item_nomiss)
        names(non_missing_choices) <- non_missing_choices
    }
  choice_multiplier <- old_height/6.5
    new_height <- 2 + choice_multiplier * length(non_missing_choices)
    new_height <- ifelse(new_height > 20, 20, new_height)
    new_height <- ifelse(new_height < 1, 1, new_height)
    knitr::opts_chunk$set(fig.height = new_height)
}

wrap_at <- knitr::opts_chunk$get("fig.width") * 10
# todo: if there are free-text choices mingled in with the pre-defined ones, don't show
# todo: show rare items if they are pre-defined
# todo: bin rare responses into "other category"
if (!length(item_nomiss)) {
cat("No non-missing values to show.")
} else if (is.numeric(item_nomiss) || dplyr::n_distinct(item_nomiss) < 20) {
plot_labelled(item_nomiss, item_name, wrap_at, go_vertical)
} else {
cat(dplyr::n_distinct(item_nomiss), " unique, categorical values, so not shown.")
}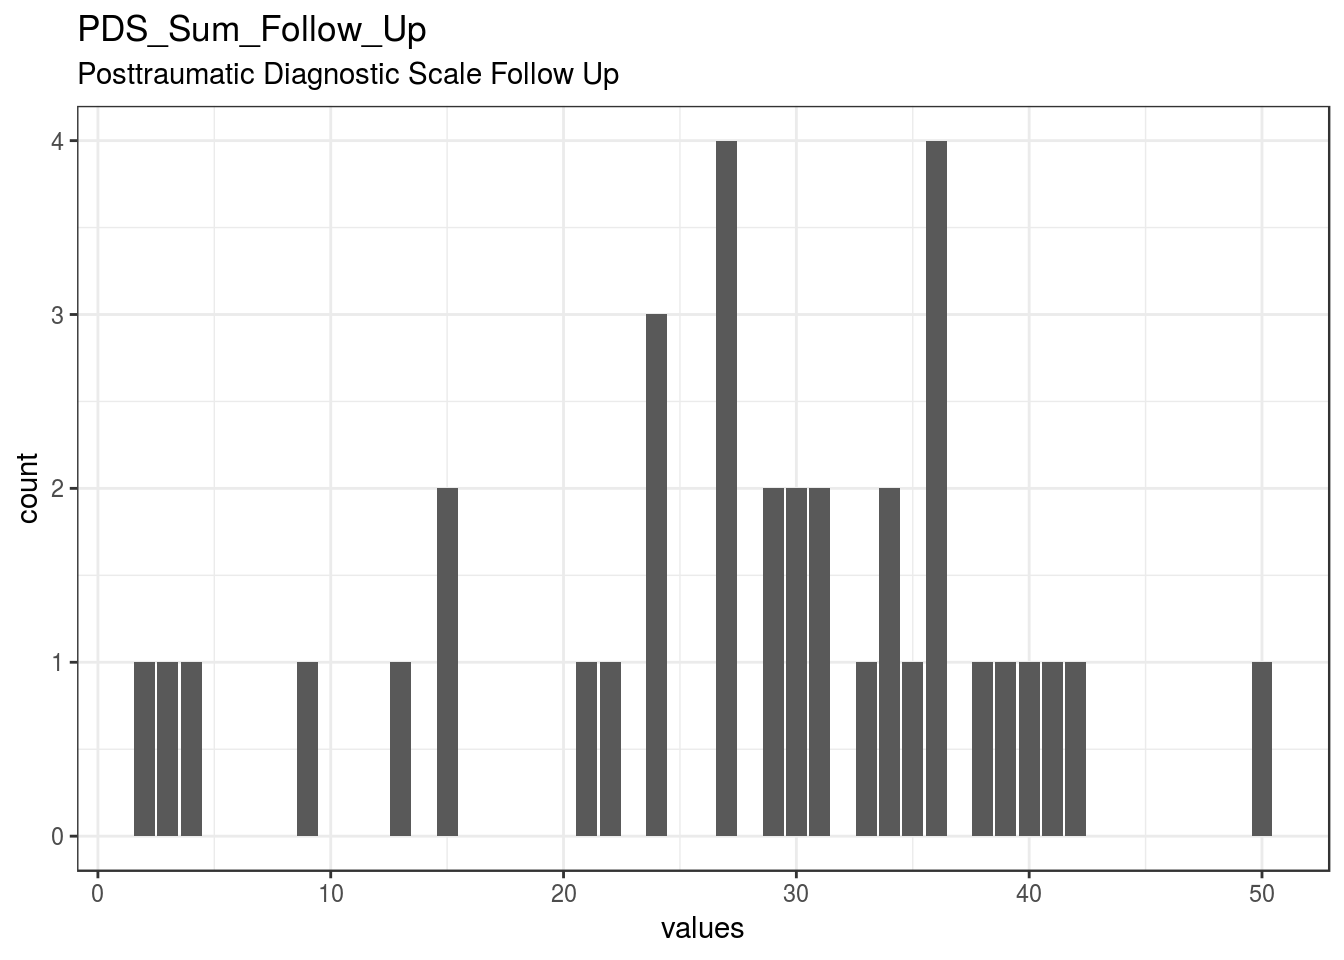
knitr::opts_chunk$set(fig.height = old_height)4 missing values.
Summary statistics
attributes(item) <- item_attributes
df = data.frame(item, stringsAsFactors = FALSE)
names(df) = html_item_name
escaped_table(codebook_table(df))| name | label | data_type | missing | complete | n | mean | sd | p0 | p25 | p50 | p75 | p100 | hist | format.spss | display_width |
|---|---|---|---|---|---|---|---|---|---|---|---|---|---|---|---|
| PDS_Sum_Follow_Up | Posttraumatic Diagnostic Scale Follow Up | numeric | 4 | 36 | 40 | 27.61 | 11.43 | 2 | 23.5 | 29.5 | 36 | 50 | ▂▂▂▃▇▇▃▁ | F6.0 | 6 |
if (show_missing_values) {
  plot_labelled(missing_values, item_name, wrap_at)
}
if (!is.null(item_info)) {
# don't show choices again, if they're basically same thing as value labels
if (!is.null(choices) && !is.null(item_info$choices) &&
all(names(na.omit(choices)) == item_info$choices) &&
all(na.omit(choices) == names(item_info$choices))) {
item_info$choices <- NULL
}
item_info$label_parsed <-
item_info$choice_list <- item_info$study_id <- item_info$id <- NULL
pander::pander(item_info)
}if (!is.null(choices) && length(choices) && length(choices) < 30) {
pander::pander(as.list(choices))
}BDI_Pre
Becks Depression Invetory Pre Therapy
Distribution
show_missing_values <- FALSE
if (has_labels(item)) {
  missing_values <- item[is.na(haven::zap_missing(item))]
  attributes(missing_values) <- attributes(item)
  if (!is.null(attributes(item)$labels)) {
    attributes(missing_values)$labels <- attributes(missing_values)$labels[is.na(attributes(missing_values)$labels)]
    attributes(item)$labels <- attributes(item)$labels[!is.na(attributes(item)$labels)]
  }
  if (is.double(item)) {
    show_missing_values <- length(unique(haven::na_tag(missing_values))) > 1
    item <- haven::zap_missing(item)
  }
  if (length(item_attributes$labels) == 0 && is.numeric(item)) {
    item <- haven::zap_labels(item)
  }
}
item_nomiss <- item[!is.na(item)]

# unnest mc_multiple and so on
if (
  is.character(item_nomiss) &&
  stringr::str_detect(item_nomiss, stringr::fixed(", ")) &&
  (exists("type", item_info) &&
    stringr::str_detect(item_info$type, pattern = stringr::fixed("multiple")))
  ) {
  item_nomiss <- unlist(stringr::str_split(item_nomiss, pattern = stringr::fixed(", ")))
}
attributes(item_nomiss) <- attributes(item)

old_height <- knitr::opts_chunk$get("fig.height")
non_missing_choices <- item_attributes[["labels"]]
many_labels <- length(non_missing_choices) > 7
go_vertical <- !is.numeric(item_nomiss) || many_labels
if ( go_vertical ) {
  # numeric items are plotted horizontally (because that's what usually expected)
  # categorical items are plotted vertically because we can use the screen real estate better this way

    if (is.null(choices) ||
        dplyr::n_distinct(item_nomiss) > length(non_missing_choices)) {
        non_missing_choices <- unique(item_nomiss)
        names(non_missing_choices) <- non_missing_choices
    }
  choice_multiplier <- old_height/6.5
    new_height <- 2 + choice_multiplier * length(non_missing_choices)
    new_height <- ifelse(new_height > 20, 20, new_height)
    new_height <- ifelse(new_height < 1, 1, new_height)
    knitr::opts_chunk$set(fig.height = new_height)
}

wrap_at <- knitr::opts_chunk$get("fig.width") * 10
# todo: if there are free-text choices mingled in with the pre-defined ones, don't show
# todo: show rare items if they are pre-defined
# todo: bin rare responses into "other category"
if (!length(item_nomiss)) {
cat("No non-missing values to show.")
} else if (is.numeric(item_nomiss) || dplyr::n_distinct(item_nomiss) < 20) {
plot_labelled(item_nomiss, item_name, wrap_at, go_vertical)
} else {
cat(dplyr::n_distinct(item_nomiss), " unique, categorical values, so not shown.")
}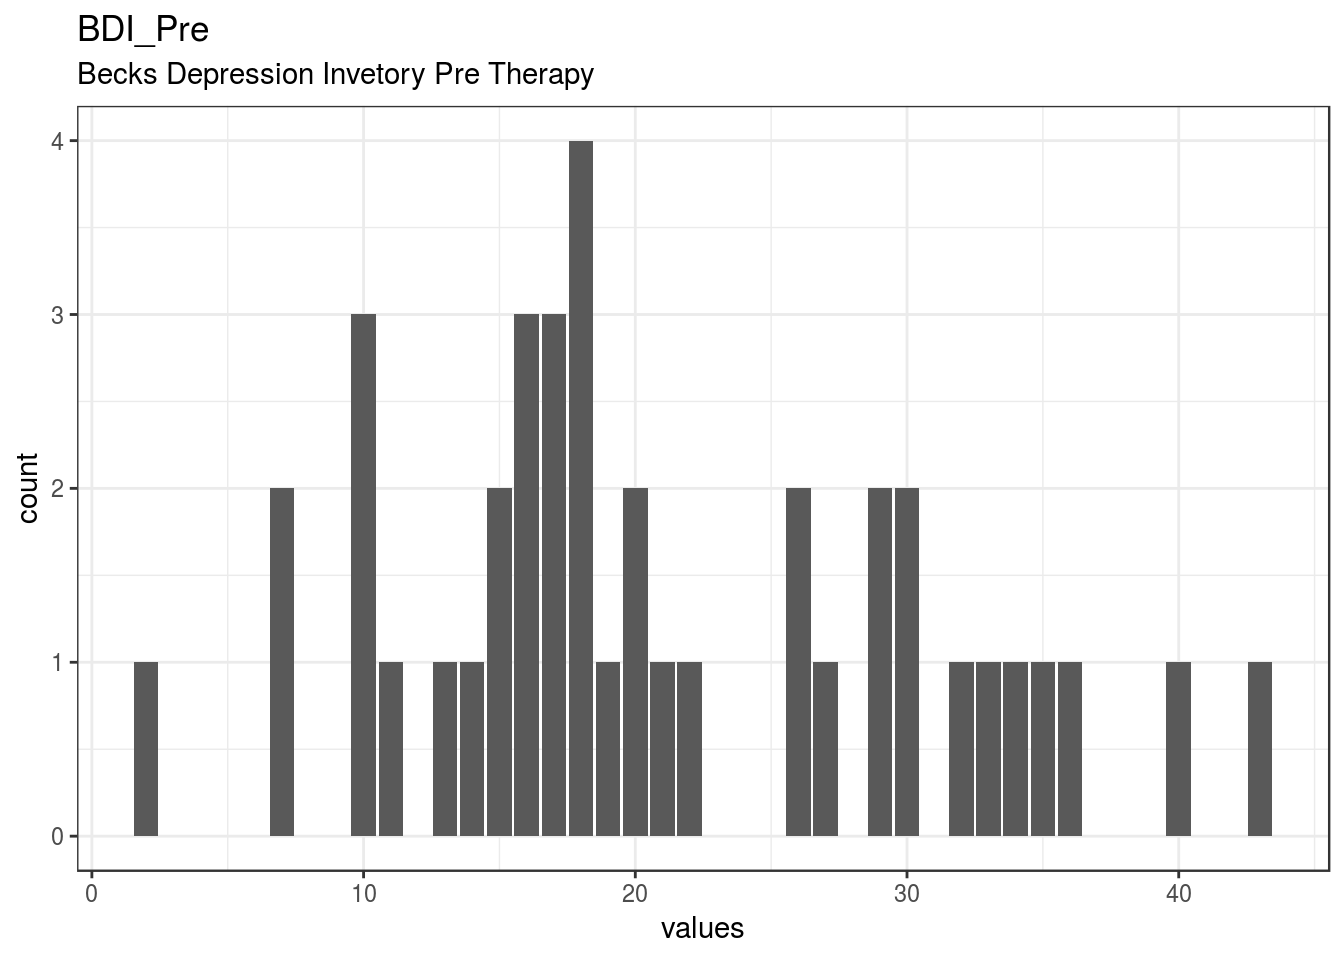
knitr::opts_chunk$set(fig.height = old_height)0 missing values.
Summary statistics
attributes(item) <- item_attributes
df = data.frame(item, stringsAsFactors = FALSE)
names(df) = html_item_name
escaped_table(codebook_table(df))| name | label | data_type | missing | complete | n | mean | sd | p0 | p25 | p50 | p75 | p100 | hist | format.spss | display_width |
|---|---|---|---|---|---|---|---|---|---|---|---|---|---|---|---|
| BDI_Pre | Becks Depression Invetory Pre Therapy | numeric | 0 | 40 | 40 | 20.93 | 9.66 | 2 | 15 | 18 | 29 | 43 | ▂▃▇▇▂▃▃▂ | F6.0 | 6 |
if (show_missing_values) {
  plot_labelled(missing_values, item_name, wrap_at)
}
if (!is.null(item_info)) {
# don't show choices again, if they're basically same thing as value labels
if (!is.null(choices) && !is.null(item_info$choices) &&
all(names(na.omit(choices)) == item_info$choices) &&
all(na.omit(choices) == names(item_info$choices))) {
item_info$choices <- NULL
}
item_info$label_parsed <-
item_info$choice_list <- item_info$study_id <- item_info$id <- NULL
pander::pander(item_info)
}if (!is.null(choices) && length(choices) && length(choices) < 30) {
pander::pander(as.list(choices))
}BDI_Post
Becks Depression Invetory Post Therapy
Distribution
show_missing_values <- FALSE
if (has_labels(item)) {
  missing_values <- item[is.na(haven::zap_missing(item))]
  attributes(missing_values) <- attributes(item)
  if (!is.null(attributes(item)$labels)) {
    attributes(missing_values)$labels <- attributes(missing_values)$labels[is.na(attributes(missing_values)$labels)]
    attributes(item)$labels <- attributes(item)$labels[!is.na(attributes(item)$labels)]
  }
  if (is.double(item)) {
    show_missing_values <- length(unique(haven::na_tag(missing_values))) > 1
    item <- haven::zap_missing(item)
  }
  if (length(item_attributes$labels) == 0 && is.numeric(item)) {
    item <- haven::zap_labels(item)
  }
}
item_nomiss <- item[!is.na(item)]

# unnest mc_multiple and so on
if (
  is.character(item_nomiss) &&
  stringr::str_detect(item_nomiss, stringr::fixed(", ")) &&
  (exists("type", item_info) &&
    stringr::str_detect(item_info$type, pattern = stringr::fixed("multiple")))
  ) {
  item_nomiss <- unlist(stringr::str_split(item_nomiss, pattern = stringr::fixed(", ")))
}
attributes(item_nomiss) <- attributes(item)

old_height <- knitr::opts_chunk$get("fig.height")
non_missing_choices <- item_attributes[["labels"]]
many_labels <- length(non_missing_choices) > 7
go_vertical <- !is.numeric(item_nomiss) || many_labels
if ( go_vertical ) {
  # numeric items are plotted horizontally (because that's what usually expected)
  # categorical items are plotted vertically because we can use the screen real estate better this way

    if (is.null(choices) ||
        dplyr::n_distinct(item_nomiss) > length(non_missing_choices)) {
        non_missing_choices <- unique(item_nomiss)
        names(non_missing_choices) <- non_missing_choices
    }
  choice_multiplier <- old_height/6.5
    new_height <- 2 + choice_multiplier * length(non_missing_choices)
    new_height <- ifelse(new_height > 20, 20, new_height)
    new_height <- ifelse(new_height < 1, 1, new_height)
    knitr::opts_chunk$set(fig.height = new_height)
}

wrap_at <- knitr::opts_chunk$get("fig.width") * 10
# todo: if there are free-text choices mingled in with the pre-defined ones, don't show
# todo: show rare items if they are pre-defined
# todo: bin rare responses into "other category"
if (!length(item_nomiss)) {
cat("No non-missing values to show.")
} else if (is.numeric(item_nomiss) || dplyr::n_distinct(item_nomiss) < 20) {
plot_labelled(item_nomiss, item_name, wrap_at, go_vertical)
} else {
cat(dplyr::n_distinct(item_nomiss), " unique, categorical values, so not shown.")
}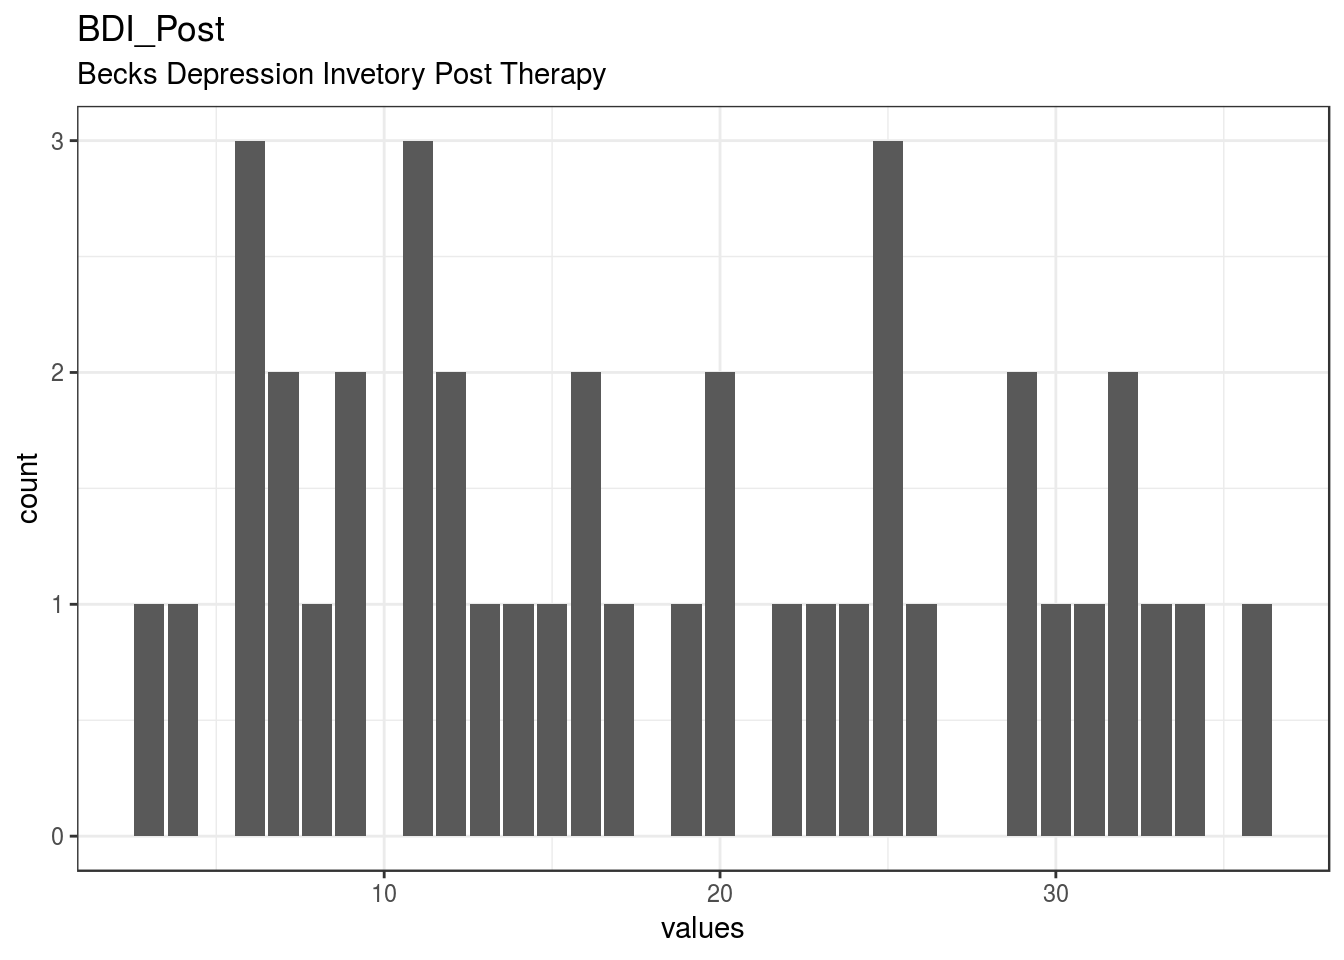
knitr::opts_chunk$set(fig.height = old_height)0 missing values.
Summary statistics
attributes(item) <- item_attributes
df = data.frame(item, stringsAsFactors = FALSE)
names(df) = html_item_name
escaped_table(codebook_table(df))| name | label | data_type | missing | complete | n | mean | sd | p0 | p25 | p50 | p75 | p100 | hist | format.spss | display_width |
|---|---|---|---|---|---|---|---|---|---|---|---|---|---|---|---|
| BDI_Post | Becks Depression Invetory Post Therapy | numeric | 0 | 40 | 40 | 18.2 | 9.72 | 3 | 10.5 | 16.5 | 25.25 | 36 | ▇▇▆▅▅▆▅▆ | F6.0 | 6 |
if (show_missing_values) {
  plot_labelled(missing_values, item_name, wrap_at)
}
if (!is.null(item_info)) {
# don't show choices again, if they're basically same thing as value labels
if (!is.null(choices) && !is.null(item_info$choices) &&
all(names(na.omit(choices)) == item_info$choices) &&
all(na.omit(choices) == names(item_info$choices))) {
item_info$choices <- NULL
}
item_info$label_parsed <-
item_info$choice_list <- item_info$study_id <- item_info$id <- NULL
pander::pander(item_info)
}if (!is.null(choices) && length(choices) && length(choices) < 30) {
pander::pander(as.list(choices))
}BDI_Follow_Up
Becks Depression Invetory Follow Up
Distribution
show_missing_values <- FALSE
if (has_labels(item)) {
  missing_values <- item[is.na(haven::zap_missing(item))]
  attributes(missing_values) <- attributes(item)
  if (!is.null(attributes(item)$labels)) {
    attributes(missing_values)$labels <- attributes(missing_values)$labels[is.na(attributes(missing_values)$labels)]
    attributes(item)$labels <- attributes(item)$labels[!is.na(attributes(item)$labels)]
  }
  if (is.double(item)) {
    show_missing_values <- length(unique(haven::na_tag(missing_values))) > 1
    item <- haven::zap_missing(item)
  }
  if (length(item_attributes$labels) == 0 && is.numeric(item)) {
    item <- haven::zap_labels(item)
  }
}
item_nomiss <- item[!is.na(item)]

# unnest mc_multiple and so on
if (
  is.character(item_nomiss) &&
  stringr::str_detect(item_nomiss, stringr::fixed(", ")) &&
  (exists("type", item_info) &&
    stringr::str_detect(item_info$type, pattern = stringr::fixed("multiple")))
  ) {
  item_nomiss <- unlist(stringr::str_split(item_nomiss, pattern = stringr::fixed(", ")))
}
attributes(item_nomiss) <- attributes(item)

old_height <- knitr::opts_chunk$get("fig.height")
non_missing_choices <- item_attributes[["labels"]]
many_labels <- length(non_missing_choices) > 7
go_vertical <- !is.numeric(item_nomiss) || many_labels
if ( go_vertical ) {
  # numeric items are plotted horizontally (because that's what usually expected)
  # categorical items are plotted vertically because we can use the screen real estate better this way

    if (is.null(choices) ||
        dplyr::n_distinct(item_nomiss) > length(non_missing_choices)) {
        non_missing_choices <- unique(item_nomiss)
        names(non_missing_choices) <- non_missing_choices
    }
  choice_multiplier <- old_height/6.5
    new_height <- 2 + choice_multiplier * length(non_missing_choices)
    new_height <- ifelse(new_height > 20, 20, new_height)
    new_height <- ifelse(new_height < 1, 1, new_height)
    knitr::opts_chunk$set(fig.height = new_height)
}

wrap_at <- knitr::opts_chunk$get("fig.width") * 10
# todo: if there are free-text choices mingled in with the pre-defined ones, don't show
# todo: show rare items if they are pre-defined
# todo: bin rare responses into "other category"
if (!length(item_nomiss)) {
cat("No non-missing values to show.")
} else if (is.numeric(item_nomiss) || dplyr::n_distinct(item_nomiss) < 20) {
plot_labelled(item_nomiss, item_name, wrap_at, go_vertical)
} else {
cat(dplyr::n_distinct(item_nomiss), " unique, categorical values, so not shown.")
}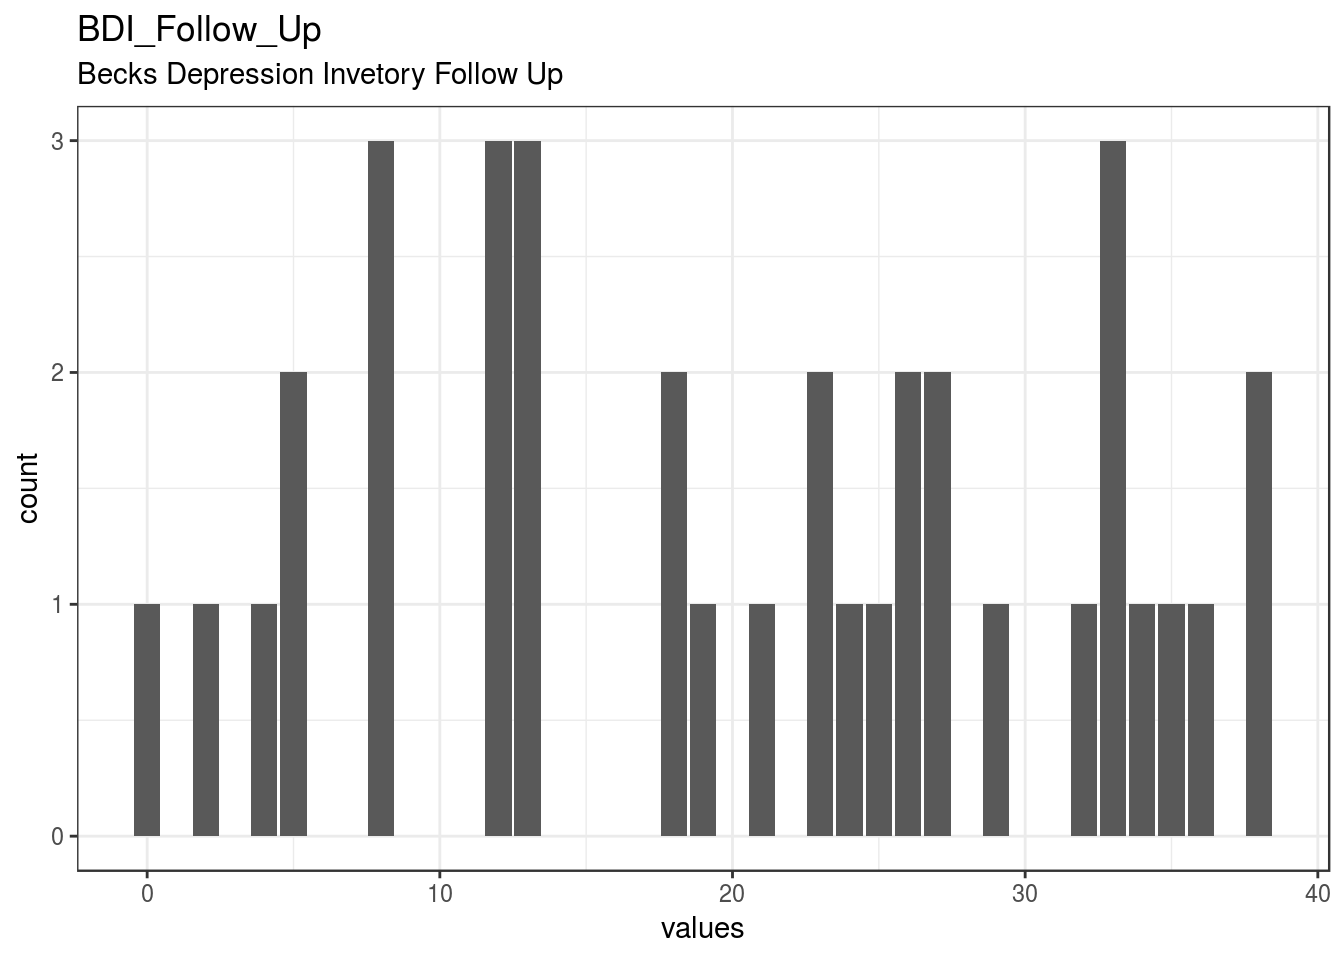
knitr::opts_chunk$set(fig.height = old_height)4 missing values.
Summary statistics
attributes(item) <- item_attributes
df = data.frame(item, stringsAsFactors = FALSE)
names(df) = html_item_name
escaped_table(codebook_table(df))| name | label | data_type | missing | complete | n | mean | sd | p0 | p25 | p50 | p75 | p100 | hist | format.spss | display_width |
|---|---|---|---|---|---|---|---|---|---|---|---|---|---|---|---|
| BDI_Follow_Up | Becks Depression Invetory Follow Up | numeric | 4 | 36 | 40 | 20.36 | 11.33 | 0 | 12 | 22 | 29.75 | 38 | ▃▇▇▃▃▇▇▇ | F6.0 | 6 |
if (show_missing_values) {
  plot_labelled(missing_values, item_name, wrap_at)
}
if (!is.null(item_info)) {
# don't show choices again, if they're basically same thing as value labels
if (!is.null(choices) && !is.null(item_info$choices) &&
all(names(na.omit(choices)) == item_info$choices) &&
all(na.omit(choices) == names(item_info$choices))) {
item_info$choices <- NULL
}
item_info$label_parsed <-
item_info$choice_list <- item_info$study_id <- item_info$id <- NULL
pander::pander(item_info)
}if (!is.null(choices) && length(choices) && length(choices) < 30) {
pander::pander(as.list(choices))
}STAI_Trait_Pre
State Trait Anxiety Inventory Trait Scale Pre Therapy
Distribution
show_missing_values <- FALSE
if (has_labels(item)) {
  missing_values <- item[is.na(haven::zap_missing(item))]
  attributes(missing_values) <- attributes(item)
  if (!is.null(attributes(item)$labels)) {
    attributes(missing_values)$labels <- attributes(missing_values)$labels[is.na(attributes(missing_values)$labels)]
    attributes(item)$labels <- attributes(item)$labels[!is.na(attributes(item)$labels)]
  }
  if (is.double(item)) {
    show_missing_values <- length(unique(haven::na_tag(missing_values))) > 1
    item <- haven::zap_missing(item)
  }
  if (length(item_attributes$labels) == 0 && is.numeric(item)) {
    item <- haven::zap_labels(item)
  }
}
item_nomiss <- item[!is.na(item)]

# unnest mc_multiple and so on
if (
  is.character(item_nomiss) &&
  stringr::str_detect(item_nomiss, stringr::fixed(", ")) &&
  (exists("type", item_info) &&
    stringr::str_detect(item_info$type, pattern = stringr::fixed("multiple")))
  ) {
  item_nomiss <- unlist(stringr::str_split(item_nomiss, pattern = stringr::fixed(", ")))
}
attributes(item_nomiss) <- attributes(item)

old_height <- knitr::opts_chunk$get("fig.height")
non_missing_choices <- item_attributes[["labels"]]
many_labels <- length(non_missing_choices) > 7
go_vertical <- !is.numeric(item_nomiss) || many_labels
if ( go_vertical ) {
  # numeric items are plotted horizontally (because that's what usually expected)
  # categorical items are plotted vertically because we can use the screen real estate better this way

    if (is.null(choices) ||
        dplyr::n_distinct(item_nomiss) > length(non_missing_choices)) {
        non_missing_choices <- unique(item_nomiss)
        names(non_missing_choices) <- non_missing_choices
    }
  choice_multiplier <- old_height/6.5
    new_height <- 2 + choice_multiplier * length(non_missing_choices)
    new_height <- ifelse(new_height > 20, 20, new_height)
    new_height <- ifelse(new_height < 1, 1, new_height)
    knitr::opts_chunk$set(fig.height = new_height)
}

wrap_at <- knitr::opts_chunk$get("fig.width") * 10
# todo: if there are free-text choices mingled in with the pre-defined ones, don't show
# todo: show rare items if they are pre-defined
# todo: bin rare responses into "other category"
if (!length(item_nomiss)) {
cat("No non-missing values to show.")
} else if (is.numeric(item_nomiss) || dplyr::n_distinct(item_nomiss) < 20) {
plot_labelled(item_nomiss, item_name, wrap_at, go_vertical)
} else {
cat(dplyr::n_distinct(item_nomiss), " unique, categorical values, so not shown.")
}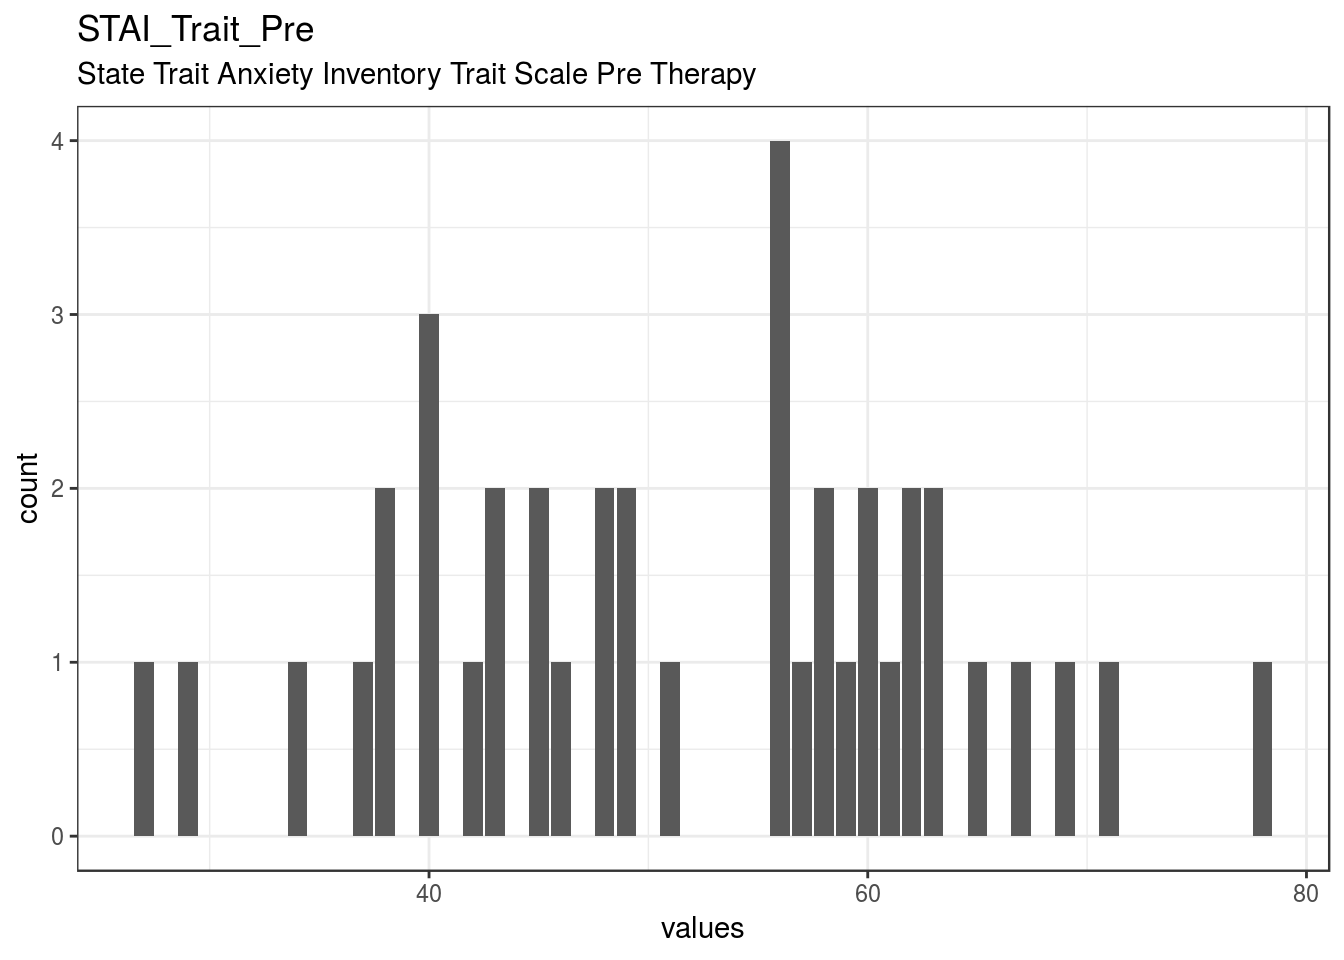
knitr::opts_chunk$set(fig.height = old_height)0 missing values.
Summary statistics
attributes(item) <- item_attributes
df = data.frame(item, stringsAsFactors = FALSE)
names(df) = html_item_name
escaped_table(codebook_table(df))| name | label | data_type | missing | complete | n | mean | sd | p0 | p25 | p50 | p75 | p100 | hist | format.spss | display_width |
|---|---|---|---|---|---|---|---|---|---|---|---|---|---|---|---|
| STAI_Trait_Pre | State Trait Anxiety Inventory Trait Scale Pre Therapy | numeric | 0 | 40 | 40 | 51.73 | 11.93 | 27 | 42.75 | 53.5 | 60.25 | 78 | ▂▃▇▅▆▇▂▁ | F6.0 | 13 |
if (show_missing_values) {
  plot_labelled(missing_values, item_name, wrap_at)
}
if (!is.null(item_info)) {
# don't show choices again, if they're basically same thing as value labels
if (!is.null(choices) && !is.null(item_info$choices) &&
all(names(na.omit(choices)) == item_info$choices) &&
all(na.omit(choices) == names(item_info$choices))) {
item_info$choices <- NULL
}
item_info$label_parsed <-
item_info$choice_list <- item_info$study_id <- item_info$id <- NULL
pander::pander(item_info)
}if (!is.null(choices) && length(choices) && length(choices) < 30) {
pander::pander(as.list(choices))
}STAI_Trait_Post
State Trait Anxiety Inventory Trait Scale PostTherapy
Distribution
show_missing_values <- FALSE
if (has_labels(item)) {
  missing_values <- item[is.na(haven::zap_missing(item))]
  attributes(missing_values) <- attributes(item)
  if (!is.null(attributes(item)$labels)) {
    attributes(missing_values)$labels <- attributes(missing_values)$labels[is.na(attributes(missing_values)$labels)]
    attributes(item)$labels <- attributes(item)$labels[!is.na(attributes(item)$labels)]
  }
  if (is.double(item)) {
    show_missing_values <- length(unique(haven::na_tag(missing_values))) > 1
    item <- haven::zap_missing(item)
  }
  if (length(item_attributes$labels) == 0 && is.numeric(item)) {
    item <- haven::zap_labels(item)
  }
}
item_nomiss <- item[!is.na(item)]

# unnest mc_multiple and so on
if (
  is.character(item_nomiss) &&
  stringr::str_detect(item_nomiss, stringr::fixed(", ")) &&
  (exists("type", item_info) &&
    stringr::str_detect(item_info$type, pattern = stringr::fixed("multiple")))
  ) {
  item_nomiss <- unlist(stringr::str_split(item_nomiss, pattern = stringr::fixed(", ")))
}
attributes(item_nomiss) <- attributes(item)

old_height <- knitr::opts_chunk$get("fig.height")
non_missing_choices <- item_attributes[["labels"]]
many_labels <- length(non_missing_choices) > 7
go_vertical <- !is.numeric(item_nomiss) || many_labels
if ( go_vertical ) {
  # numeric items are plotted horizontally (because that's what usually expected)
  # categorical items are plotted vertically because we can use the screen real estate better this way

    if (is.null(choices) ||
        dplyr::n_distinct(item_nomiss) > length(non_missing_choices)) {
        non_missing_choices <- unique(item_nomiss)
        names(non_missing_choices) <- non_missing_choices
    }
  choice_multiplier <- old_height/6.5
    new_height <- 2 + choice_multiplier * length(non_missing_choices)
    new_height <- ifelse(new_height > 20, 20, new_height)
    new_height <- ifelse(new_height < 1, 1, new_height)
    knitr::opts_chunk$set(fig.height = new_height)
}

wrap_at <- knitr::opts_chunk$get("fig.width") * 10
# todo: if there are free-text choices mingled in with the pre-defined ones, don't show
# todo: show rare items if they are pre-defined
# todo: bin rare responses into "other category"
if (!length(item_nomiss)) {
cat("No non-missing values to show.")
} else if (is.numeric(item_nomiss) || dplyr::n_distinct(item_nomiss) < 20) {
plot_labelled(item_nomiss, item_name, wrap_at, go_vertical)
} else {
cat(dplyr::n_distinct(item_nomiss), " unique, categorical values, so not shown.")
}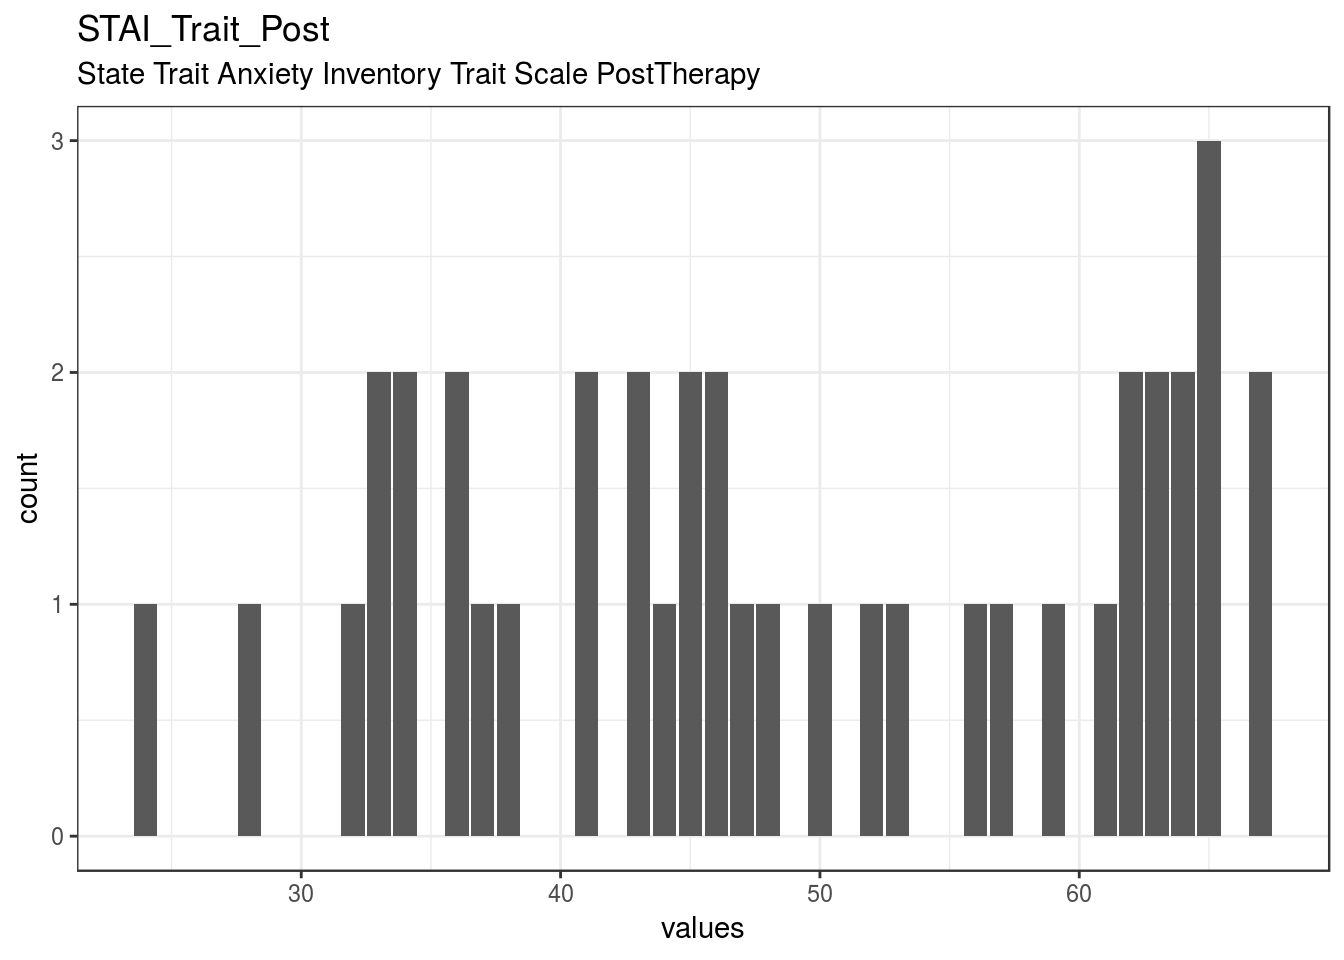
knitr::opts_chunk$set(fig.height = old_height)0 missing values.
Summary statistics
attributes(item) <- item_attributes
df = data.frame(item, stringsAsFactors = FALSE)
names(df) = html_item_name
escaped_table(codebook_table(df))| name | label | data_type | missing | complete | n | mean | sd | p0 | p25 | p50 | p75 | p100 | hist | format.spss | display_width |
|---|---|---|---|---|---|---|---|---|---|---|---|---|---|---|---|
| STAI_Trait_Post | State Trait Anxiety Inventory Trait Scale PostTherapy | numeric | 0 | 40 | 40 | 48.73 | 12.58 | 24 | 37.75 | 46.5 | 62 | 67 | ▂▃▃▅▃▂▂▇ | F6.0 | 6 |
if (show_missing_values) {
  plot_labelled(missing_values, item_name, wrap_at)
}
if (!is.null(item_info)) {
# don't show choices again, if they're basically same thing as value labels
if (!is.null(choices) && !is.null(item_info$choices) &&
all(names(na.omit(choices)) == item_info$choices) &&
all(na.omit(choices) == names(item_info$choices))) {
item_info$choices <- NULL
}
item_info$label_parsed <-
item_info$choice_list <- item_info$study_id <- item_info$id <- NULL
pander::pander(item_info)
}if (!is.null(choices) && length(choices) && length(choices) < 30) {
pander::pander(as.list(choices))
}STAI_Trait_Follow_Up
State Trait Anxiety Inventory Trait Scale Follow Up
Distribution
show_missing_values <- FALSE
if (has_labels(item)) {
  missing_values <- item[is.na(haven::zap_missing(item))]
  attributes(missing_values) <- attributes(item)
  if (!is.null(attributes(item)$labels)) {
    attributes(missing_values)$labels <- attributes(missing_values)$labels[is.na(attributes(missing_values)$labels)]
    attributes(item)$labels <- attributes(item)$labels[!is.na(attributes(item)$labels)]
  }
  if (is.double(item)) {
    show_missing_values <- length(unique(haven::na_tag(missing_values))) > 1
    item <- haven::zap_missing(item)
  }
  if (length(item_attributes$labels) == 0 && is.numeric(item)) {
    item <- haven::zap_labels(item)
  }
}
item_nomiss <- item[!is.na(item)]

# unnest mc_multiple and so on
if (
  is.character(item_nomiss) &&
  stringr::str_detect(item_nomiss, stringr::fixed(", ")) &&
  (exists("type", item_info) &&
    stringr::str_detect(item_info$type, pattern = stringr::fixed("multiple")))
  ) {
  item_nomiss <- unlist(stringr::str_split(item_nomiss, pattern = stringr::fixed(", ")))
}
attributes(item_nomiss) <- attributes(item)

old_height <- knitr::opts_chunk$get("fig.height")
non_missing_choices <- item_attributes[["labels"]]
many_labels <- length(non_missing_choices) > 7
go_vertical <- !is.numeric(item_nomiss) || many_labels
if ( go_vertical ) {
  # numeric items are plotted horizontally (because that's what usually expected)
  # categorical items are plotted vertically because we can use the screen real estate better this way

    if (is.null(choices) ||
        dplyr::n_distinct(item_nomiss) > length(non_missing_choices)) {
        non_missing_choices <- unique(item_nomiss)
        names(non_missing_choices) <- non_missing_choices
    }
  choice_multiplier <- old_height/6.5
    new_height <- 2 + choice_multiplier * length(non_missing_choices)
    new_height <- ifelse(new_height > 20, 20, new_height)
    new_height <- ifelse(new_height < 1, 1, new_height)
    knitr::opts_chunk$set(fig.height = new_height)
}

wrap_at <- knitr::opts_chunk$get("fig.width") * 10
# todo: if there are free-text choices mingled in with the pre-defined ones, don't show
# todo: show rare items if they are pre-defined
# todo: bin rare responses into "other category"
if (!length(item_nomiss)) {
cat("No non-missing values to show.")
} else if (is.numeric(item_nomiss) || dplyr::n_distinct(item_nomiss) < 20) {
plot_labelled(item_nomiss, item_name, wrap_at, go_vertical)
} else {
cat(dplyr::n_distinct(item_nomiss), " unique, categorical values, so not shown.")
}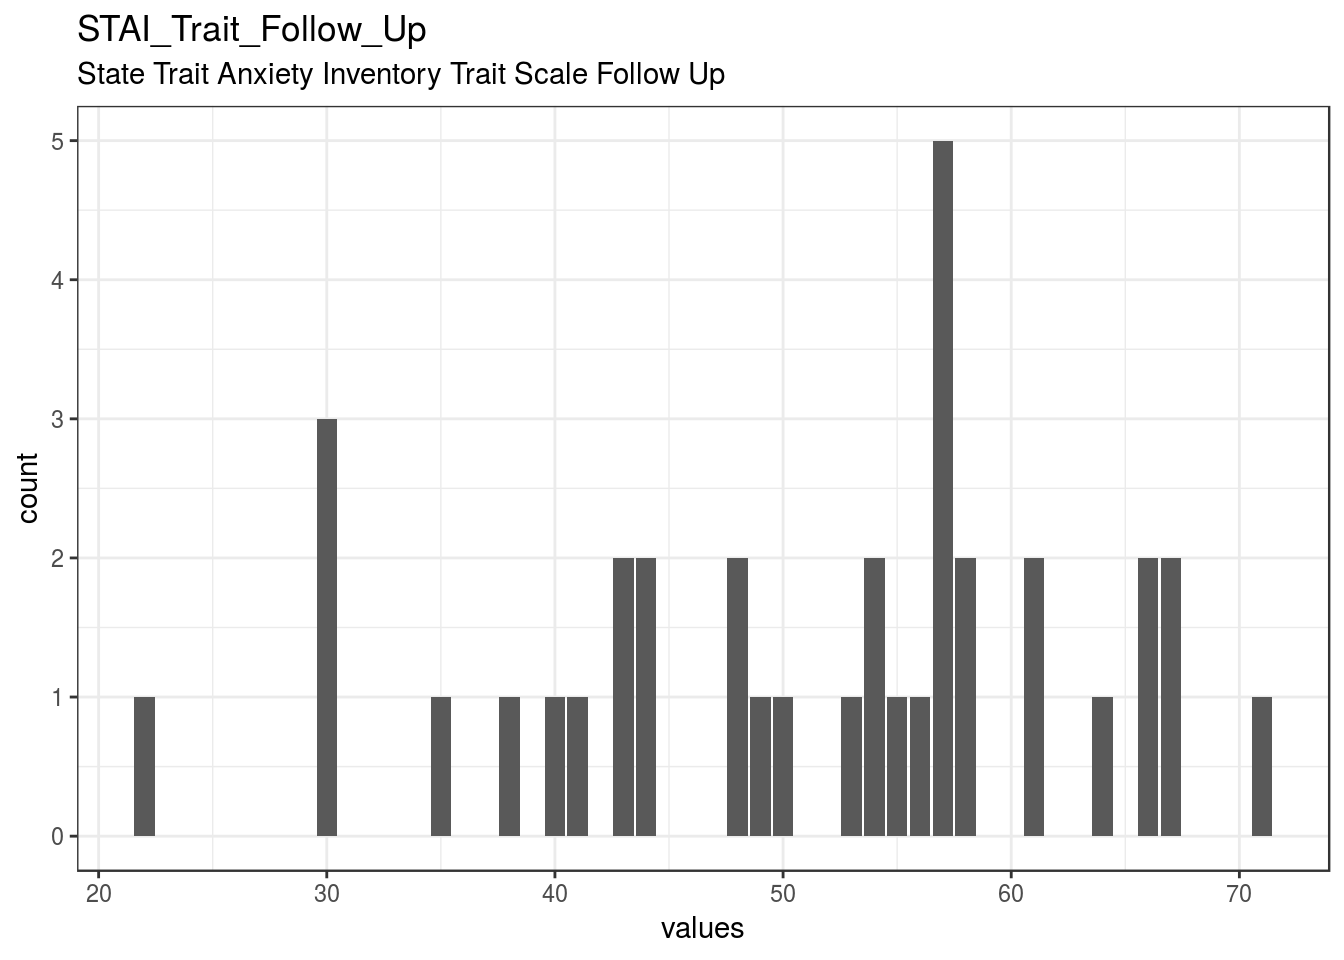
knitr::opts_chunk$set(fig.height = old_height)4 missing values.
Summary statistics
attributes(item) <- item_attributes
df = data.frame(item, stringsAsFactors = FALSE)
names(df) = html_item_name
escaped_table(codebook_table(df))| name | label | data_type | missing | complete | n | mean | sd | p0 | p25 | p50 | p75 | p100 | hist | format.spss | display_width |
|---|---|---|---|---|---|---|---|---|---|---|---|---|---|---|---|
| STAI_Trait_Follow_Up | State Trait Anxiety Inventory Trait Scale Follow Up | numeric | 4 | 36 | 40 | 50.86 | 12.11 | 22 | 43 | 54 | 58 | 71 | ▁▂▂▃▂▇▂▃ | F6.0 | 6 |
if (show_missing_values) {
  plot_labelled(missing_values, item_name, wrap_at)
}
if (!is.null(item_info)) {
# don't show choices again, if they're basically same thing as value labels
if (!is.null(choices) && !is.null(item_info$choices) &&
all(names(na.omit(choices)) == item_info$choices) &&
all(na.omit(choices) == names(item_info$choices))) {
item_info$choices <- NULL
}
item_info$label_parsed <-
item_info$choice_list <- item_info$study_id <- item_info$id <- NULL
pander::pander(item_info)
}if (!is.null(choices) && length(choices) && length(choices) < 30) {
pander::pander(as.list(choices))
}PDS_Change
Posttraumatic Diagnostic Scale Change Follow Up minus Post
Distribution
show_missing_values <- FALSE
if (has_labels(item)) {
  missing_values <- item[is.na(haven::zap_missing(item))]
  attributes(missing_values) <- attributes(item)
  if (!is.null(attributes(item)$labels)) {
    attributes(missing_values)$labels <- attributes(missing_values)$labels[is.na(attributes(missing_values)$labels)]
    attributes(item)$labels <- attributes(item)$labels[!is.na(attributes(item)$labels)]
  }
  if (is.double(item)) {
    show_missing_values <- length(unique(haven::na_tag(missing_values))) > 1
    item <- haven::zap_missing(item)
  }
  if (length(item_attributes$labels) == 0 && is.numeric(item)) {
    item <- haven::zap_labels(item)
  }
}
item_nomiss <- item[!is.na(item)]

# unnest mc_multiple and so on
if (
  is.character(item_nomiss) &&
  stringr::str_detect(item_nomiss, stringr::fixed(", ")) &&
  (exists("type", item_info) &&
    stringr::str_detect(item_info$type, pattern = stringr::fixed("multiple")))
  ) {
  item_nomiss <- unlist(stringr::str_split(item_nomiss, pattern = stringr::fixed(", ")))
}
attributes(item_nomiss) <- attributes(item)

old_height <- knitr::opts_chunk$get("fig.height")
non_missing_choices <- item_attributes[["labels"]]
many_labels <- length(non_missing_choices) > 7
go_vertical <- !is.numeric(item_nomiss) || many_labels
if ( go_vertical ) {
  # numeric items are plotted horizontally (because that's what usually expected)
  # categorical items are plotted vertically because we can use the screen real estate better this way

    if (is.null(choices) ||
        dplyr::n_distinct(item_nomiss) > length(non_missing_choices)) {
        non_missing_choices <- unique(item_nomiss)
        names(non_missing_choices) <- non_missing_choices
    }
  choice_multiplier <- old_height/6.5
    new_height <- 2 + choice_multiplier * length(non_missing_choices)
    new_height <- ifelse(new_height > 20, 20, new_height)
    new_height <- ifelse(new_height < 1, 1, new_height)
    knitr::opts_chunk$set(fig.height = new_height)
}

wrap_at <- knitr::opts_chunk$get("fig.width") * 10
# todo: if there are free-text choices mingled in with the pre-defined ones, don't show
# todo: show rare items if they are pre-defined
# todo: bin rare responses into "other category"
if (!length(item_nomiss)) {
cat("No non-missing values to show.")
} else if (is.numeric(item_nomiss) || dplyr::n_distinct(item_nomiss) < 20) {
plot_labelled(item_nomiss, item_name, wrap_at, go_vertical)
} else {
cat(dplyr::n_distinct(item_nomiss), " unique, categorical values, so not shown.")
}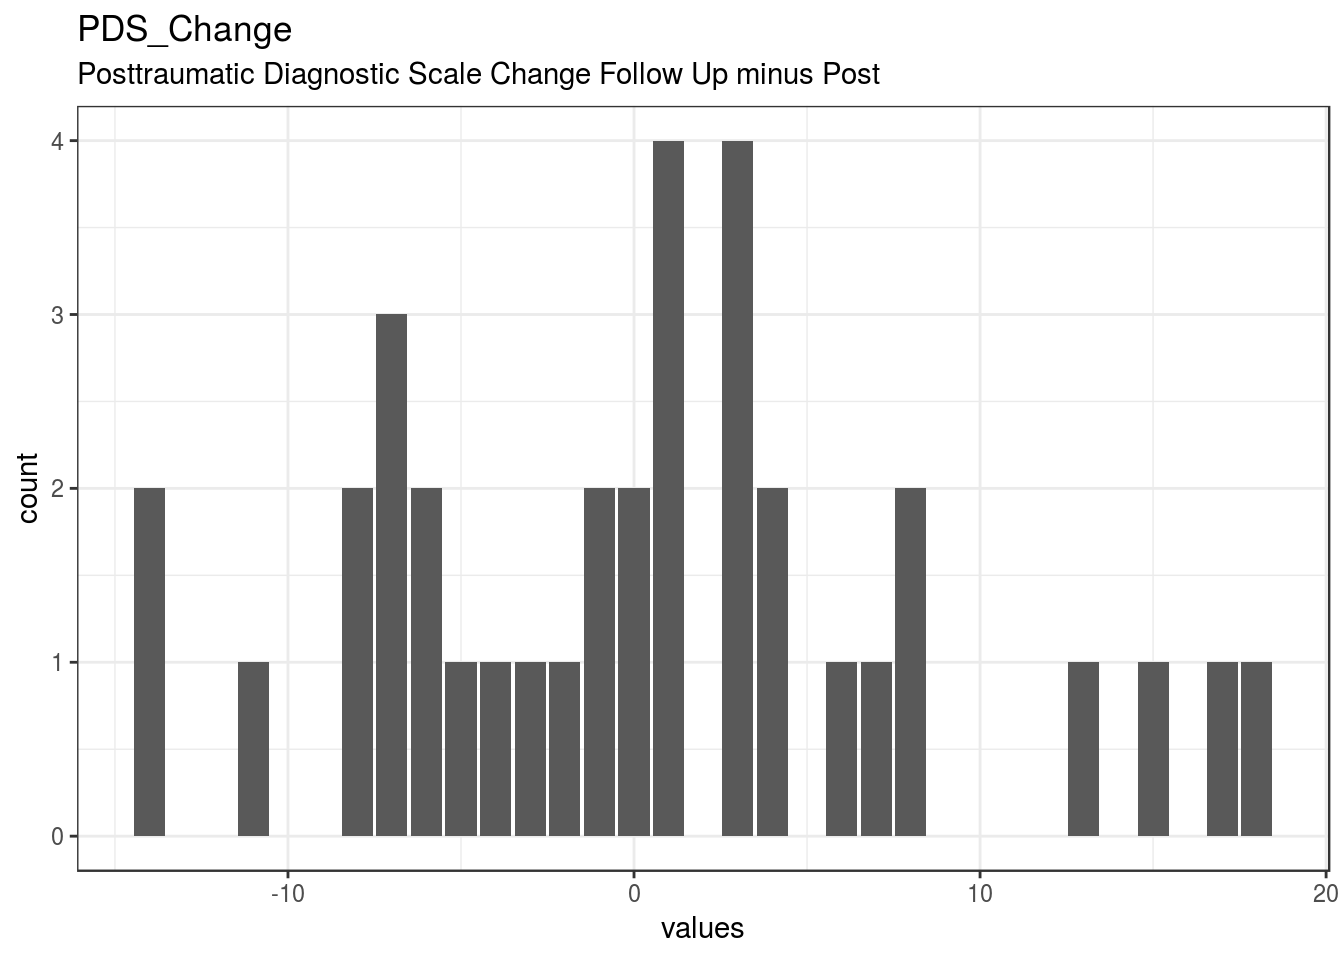
knitr::opts_chunk$set(fig.height = old_height)4 missing values.
Summary statistics
attributes(item) <- item_attributes
df = data.frame(item, stringsAsFactors = FALSE)
names(df) = html_item_name
escaped_table(codebook_table(df))| name | label | data_type | missing | complete | n | mean | sd | p0 | p25 | p50 | p75 | p100 | hist | format.spss | display_width |
|---|---|---|---|---|---|---|---|---|---|---|---|---|---|---|---|
| PDS_Change | Posttraumatic Diagnostic Scale Change Follow Up minus Post | numeric | 4 | 36 | 40 | 0.33 | 7.94 | -14 | -6 | 0.5 | 4 | 18 | ▃▇▃▇▇▃▁▃ | F8.2 | 12 |
if (show_missing_values) {
  plot_labelled(missing_values, item_name, wrap_at)
}
if (!is.null(item_info)) {
# don't show choices again, if they're basically same thing as value labels
if (!is.null(choices) && !is.null(item_info$choices) &&
all(names(na.omit(choices)) == item_info$choices) &&
all(na.omit(choices) == names(item_info$choices))) {
item_info$choices <- NULL
}
item_info$label_parsed <-
item_info$choice_list <- item_info$study_id <- item_info$id <- NULL
pander::pander(item_info)
}if (!is.null(choices) && length(choices) && length(choices) < 30) {
pander::pander(as.list(choices))
}BDI_Change
Becks Depression Invetory Pre Change Follow Up minus Post
Distribution
show_missing_values <- FALSE
if (has_labels(item)) {
  missing_values <- item[is.na(haven::zap_missing(item))]
  attributes(missing_values) <- attributes(item)
  if (!is.null(attributes(item)$labels)) {
    attributes(missing_values)$labels <- attributes(missing_values)$labels[is.na(attributes(missing_values)$labels)]
    attributes(item)$labels <- attributes(item)$labels[!is.na(attributes(item)$labels)]
  }
  if (is.double(item)) {
    show_missing_values <- length(unique(haven::na_tag(missing_values))) > 1
    item <- haven::zap_missing(item)
  }
  if (length(item_attributes$labels) == 0 && is.numeric(item)) {
    item <- haven::zap_labels(item)
  }
}
item_nomiss <- item[!is.na(item)]

# unnest mc_multiple and so on
if (
  is.character(item_nomiss) &&
  stringr::str_detect(item_nomiss, stringr::fixed(", ")) &&
  (exists("type", item_info) &&
    stringr::str_detect(item_info$type, pattern = stringr::fixed("multiple")))
  ) {
  item_nomiss <- unlist(stringr::str_split(item_nomiss, pattern = stringr::fixed(", ")))
}
attributes(item_nomiss) <- attributes(item)

old_height <- knitr::opts_chunk$get("fig.height")
non_missing_choices <- item_attributes[["labels"]]
many_labels <- length(non_missing_choices) > 7
go_vertical <- !is.numeric(item_nomiss) || many_labels
if ( go_vertical ) {
  # numeric items are plotted horizontally (because that's what usually expected)
  # categorical items are plotted vertically because we can use the screen real estate better this way

    if (is.null(choices) ||
        dplyr::n_distinct(item_nomiss) > length(non_missing_choices)) {
        non_missing_choices <- unique(item_nomiss)
        names(non_missing_choices) <- non_missing_choices
    }
  choice_multiplier <- old_height/6.5
    new_height <- 2 + choice_multiplier * length(non_missing_choices)
    new_height <- ifelse(new_height > 20, 20, new_height)
    new_height <- ifelse(new_height < 1, 1, new_height)
    knitr::opts_chunk$set(fig.height = new_height)
}

wrap_at <- knitr::opts_chunk$get("fig.width") * 10
# todo: if there are free-text choices mingled in with the pre-defined ones, don't show
# todo: show rare items if they are pre-defined
# todo: bin rare responses into "other category"
if (!length(item_nomiss)) {
cat("No non-missing values to show.")
} else if (is.numeric(item_nomiss) || dplyr::n_distinct(item_nomiss) < 20) {
plot_labelled(item_nomiss, item_name, wrap_at, go_vertical)
} else {
cat(dplyr::n_distinct(item_nomiss), " unique, categorical values, so not shown.")
}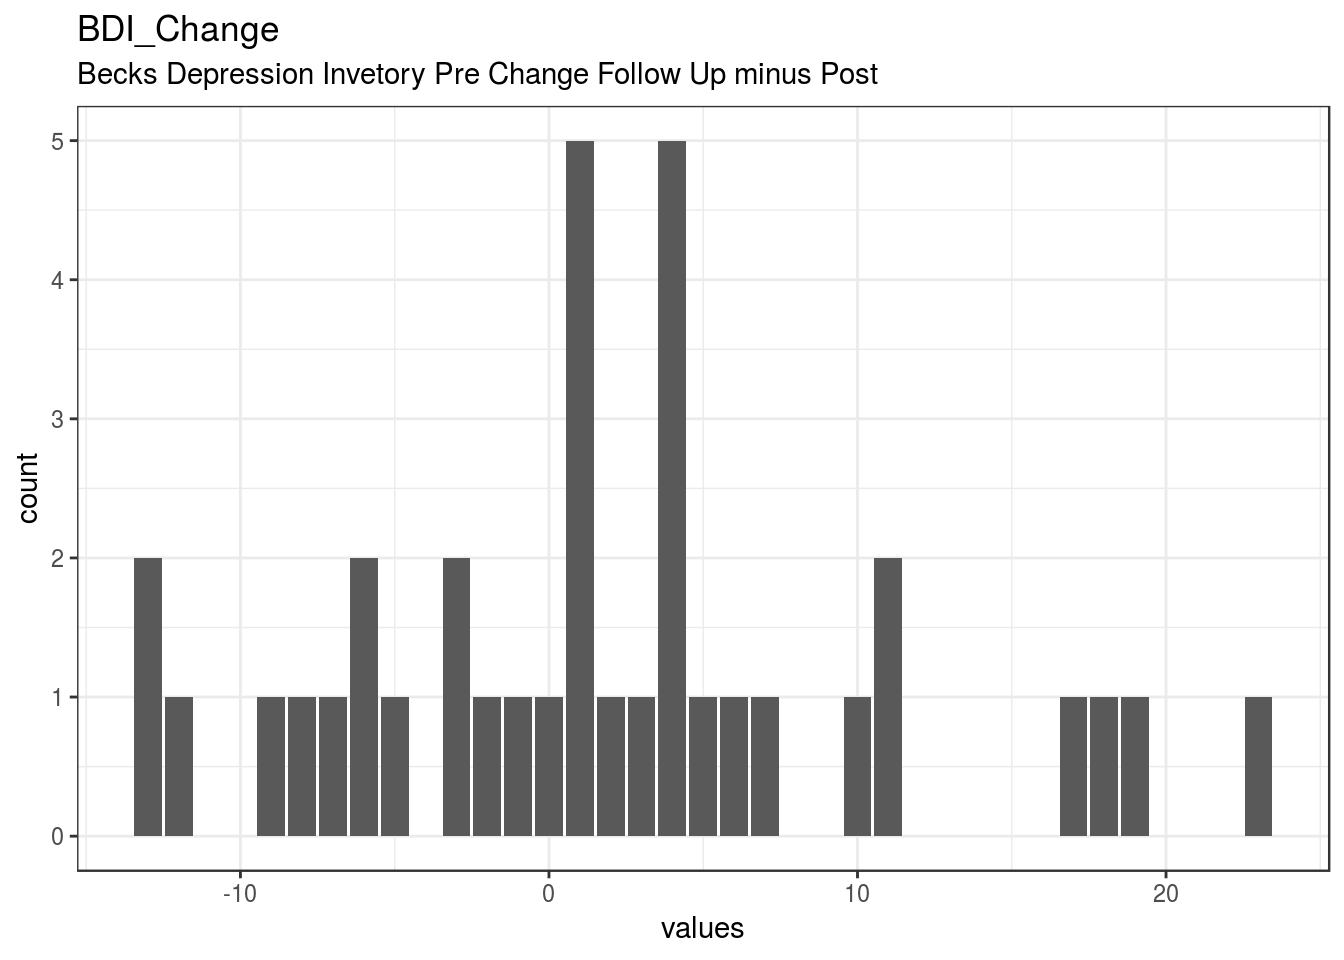
knitr::opts_chunk$set(fig.height = old_height)4 missing values.
Summary statistics
attributes(item) <- item_attributes
df = data.frame(item, stringsAsFactors = FALSE)
names(df) = html_item_name
escaped_table(codebook_table(df))| name | label | data_type | missing | complete | n | mean | sd | p0 | p25 | p50 | p75 | p100 | hist | format.spss | display_width |
|---|---|---|---|---|---|---|---|---|---|---|---|---|---|---|---|
| BDI_Change | Becks Depression Invetory Pre Change Follow Up minus Post | numeric | 4 | 36 | 40 | 1.92 | 8.81 | -13 | -3.5 | 1 | 5.25 | 23 | ▂▃▃▇▁▂▁▁ | F8.2 | 12 |
if (show_missing_values) {
  plot_labelled(missing_values, item_name, wrap_at)
}
if (!is.null(item_info)) {
# don't show choices again, if they're basically same thing as value labels
if (!is.null(choices) && !is.null(item_info$choices) &&
all(names(na.omit(choices)) == item_info$choices) &&
all(na.omit(choices) == names(item_info$choices))) {
item_info$choices <- NULL
}
item_info$label_parsed <-
item_info$choice_list <- item_info$study_id <- item_info$id <- NULL
pander::pander(item_info)
}if (!is.null(choices) && length(choices) && length(choices) < 30) {
pander::pander(as.list(choices))
}STAI_Trait_Change
State Trait Anxiety Inventory Trait Scale Change Follow Up minus Post
Distribution
show_missing_values <- FALSE
if (has_labels(item)) {
  missing_values <- item[is.na(haven::zap_missing(item))]
  attributes(missing_values) <- attributes(item)
  if (!is.null(attributes(item)$labels)) {
    attributes(missing_values)$labels <- attributes(missing_values)$labels[is.na(attributes(missing_values)$labels)]
    attributes(item)$labels <- attributes(item)$labels[!is.na(attributes(item)$labels)]
  }
  if (is.double(item)) {
    show_missing_values <- length(unique(haven::na_tag(missing_values))) > 1
    item <- haven::zap_missing(item)
  }
  if (length(item_attributes$labels) == 0 && is.numeric(item)) {
    item <- haven::zap_labels(item)
  }
}
item_nomiss <- item[!is.na(item)]

# unnest mc_multiple and so on
if (
  is.character(item_nomiss) &&
  stringr::str_detect(item_nomiss, stringr::fixed(", ")) &&
  (exists("type", item_info) &&
    stringr::str_detect(item_info$type, pattern = stringr::fixed("multiple")))
  ) {
  item_nomiss <- unlist(stringr::str_split(item_nomiss, pattern = stringr::fixed(", ")))
}
attributes(item_nomiss) <- attributes(item)

old_height <- knitr::opts_chunk$get("fig.height")
non_missing_choices <- item_attributes[["labels"]]
many_labels <- length(non_missing_choices) > 7
go_vertical <- !is.numeric(item_nomiss) || many_labels
if ( go_vertical ) {
  # numeric items are plotted horizontally (because that's what usually expected)
  # categorical items are plotted vertically because we can use the screen real estate better this way

    if (is.null(choices) ||
        dplyr::n_distinct(item_nomiss) > length(non_missing_choices)) {
        non_missing_choices <- unique(item_nomiss)
        names(non_missing_choices) <- non_missing_choices
    }
  choice_multiplier <- old_height/6.5
    new_height <- 2 + choice_multiplier * length(non_missing_choices)
    new_height <- ifelse(new_height > 20, 20, new_height)
    new_height <- ifelse(new_height < 1, 1, new_height)
    knitr::opts_chunk$set(fig.height = new_height)
}

wrap_at <- knitr::opts_chunk$get("fig.width") * 10
# todo: if there are free-text choices mingled in with the pre-defined ones, don't show
# todo: show rare items if they are pre-defined
# todo: bin rare responses into "other category"
if (!length(item_nomiss)) {
cat("No non-missing values to show.")
} else if (is.numeric(item_nomiss) || dplyr::n_distinct(item_nomiss) < 20) {
plot_labelled(item_nomiss, item_name, wrap_at, go_vertical)
} else {
cat(dplyr::n_distinct(item_nomiss), " unique, categorical values, so not shown.")
}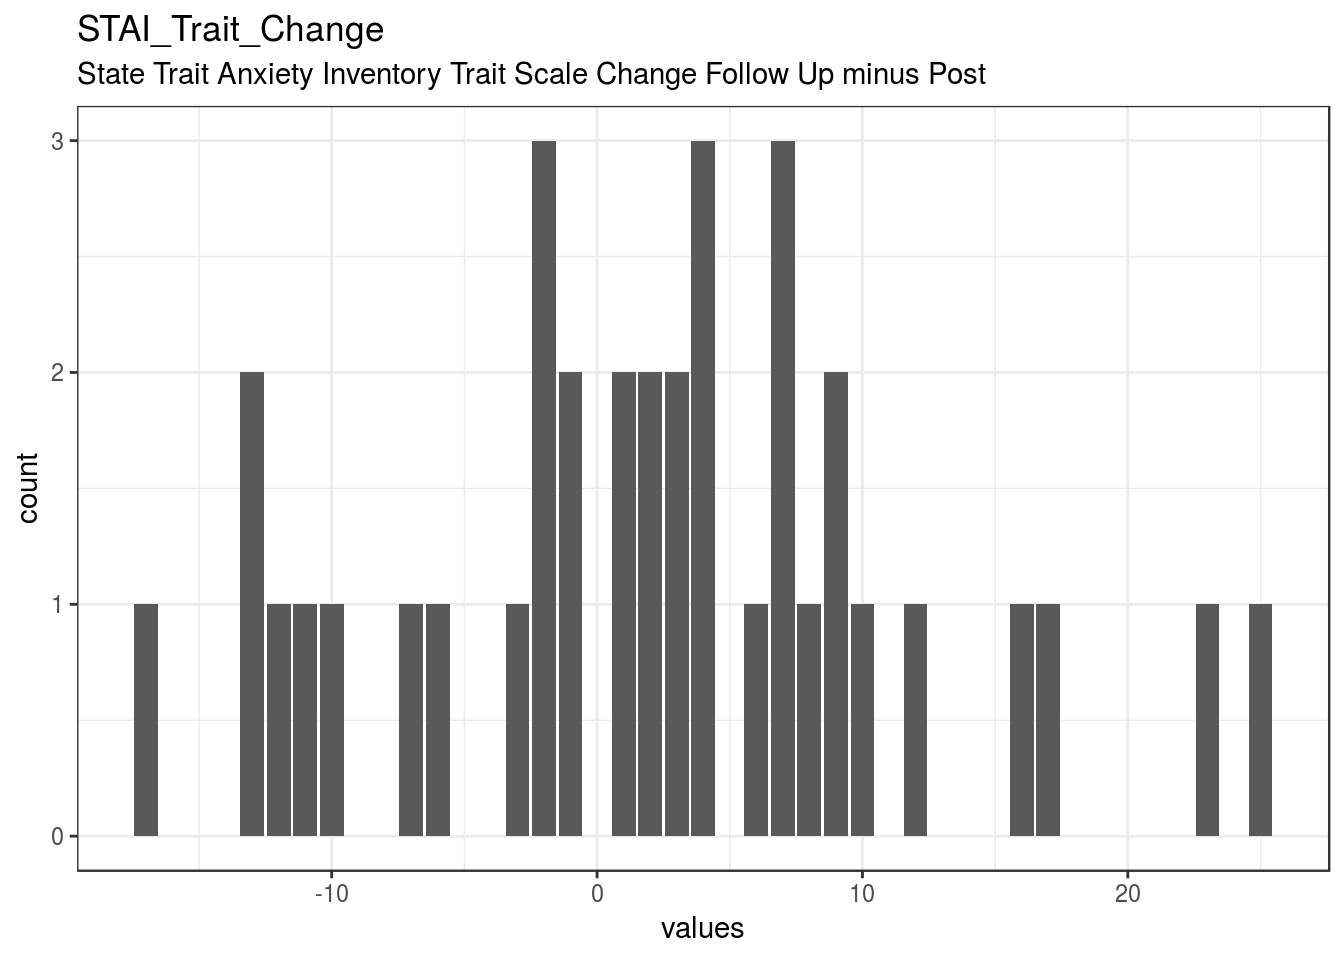
knitr::opts_chunk$set(fig.height = old_height)4 missing values.
Summary statistics
attributes(item) <- item_attributes
df = data.frame(item, stringsAsFactors = FALSE)
names(df) = html_item_name
escaped_table(codebook_table(df))| name | label | data_type | missing | complete | n | mean | sd | p0 | p25 | p50 | p75 | p100 | hist | format.spss | display_width |
|---|---|---|---|---|---|---|---|---|---|---|---|---|---|---|---|
| STAI_Trait_Change | State Trait Anxiety Inventory Trait Scale Change Follow Up minus Post | numeric | 4 | 36 | 40 | 2.22 | 9.78 | -17 | -2.25 | 2.5 | 7.25 | 25 | ▃▂▃▇▅▂▂▂ | F8.2 | 19 |
if (show_missing_values) {
  plot_labelled(missing_values, item_name, wrap_at)
}
if (!is.null(item_info)) {
# don't show choices again, if they're basically same thing as value labels
if (!is.null(choices) && !is.null(item_info$choices) &&
all(names(na.omit(choices)) == item_info$choices) &&
all(na.omit(choices) == names(item_info$choices))) {
item_info$choices <- NULL
}
item_info$label_parsed <-
item_info$choice_list <- item_info$study_id <- item_info$id <- NULL
pander::pander(item_info)
}if (!is.null(choices) && length(choices) && length(choices) < 30) {
pander::pander(as.list(choices))
}missingness_reportMissingness report
Among those who finished the survey. Only variables that have missing values are shown.
if ( exists("ended", results) &&
exists("expired", results)) {
finisher_results <- dplyr::filter(results, !is.na(.data$ended))
} else {
finisher_results <- results
warning("Could not figure out who finished the surveys, because the ",
"variables expired and ended were missing.")
}## Warning: Could not figure out who finished the surveys, because the
## variables expired and ended were missing.if (length(md_pattern)) {
pander::pander(md_pattern)
}| description | Number_EMDR_Session | Interval_Post_Follow_Up | PDS_Sum_Follow_Up | BDI_Follow_Up | STAI_Trait_Follow_Up | PDS_Change | BDI_Change | STAI_Trait_Change | TETRIS_average_time_per_days | TETRIS_no_days_missed | var_miss | n_miss |
|---|---|---|---|---|---|---|---|---|---|---|---|---|
| Missing values per variable | 4 | 4 | 4 | 4 | 4 | 4 | 4 | 4 | 22 | 22 | 76 | 76 |
| Missing values in 2 variables | 1 | 1 | 1 | 1 | 1 | 1 | 1 | 1 | 0 | 0 | 2 | 17 |
| Missing values in 0 variables | 1 | 1 | 1 | 1 | 1 | 1 | 1 | 1 | 1 | 1 | 0 | 16 |
| Missing values in 3 variables | 0 | 1 | 1 | 1 | 1 | 1 | 1 | 1 | 0 | 0 | 3 | 3 |
| Missing values in 7 variables | 1 | 0 | 0 | 0 | 0 | 0 | 0 | 0 | 1 | 1 | 7 | 2 |
| Missing values in 9 variables | 1 | 0 | 0 | 0 | 0 | 0 | 0 | 0 | 0 | 0 | 9 | 1 |
| Missing values in 10 variables | 0 | 0 | 0 | 0 | 0 | 0 | 0 | 0 | 0 | 0 | 10 | 1 |
itemsCodebook table
export_table(metadata_table)jsonld