Codebook
knitr::opts_chunk$set(
  warning = FALSE, # show warnings during codebook generation
  message = FALSE, # show messages during codebook generation
  error = TRUE, # do not interrupt codebook generation in case of errors,
                # usually better for debugging
  echo = TRUE  # show R code
)
ggplot2::theme_set(ggplot2::theme_bw())
pander::panderOptions("table.split.table", Inf)
knit_by_pkgdown <- !is.null(knitr::opts_chunk$get("fig.retina"))
pander::panderOptions("table.split.table", Inf)
ggplot2::theme_set(ggplot2::theme_bw())
knitr::opts_chunk$set(warning = TRUE, message = TRUE, error = TRUE, echo = TRUE)
intergroup_dating <- rio::import("https://osf.io/btzku/download", "sav")codebook_data <- intergroup_dating
val_labels(codebook_data$citizen) <- c("Yes" = 1, "No" = 2)
val_labels(codebook_data$education) <- c("1" = 1,
"2" = 2, "3" = 3, "4" = 4, "5" = 5, "6" = 6, "7" = 7)
val_labels(codebook_data$MC1nationalitycorrect) <- c("wrong" = 0, "right" = 1)
val_labels(codebook_data$MC2incomecorrect) <- c("wrong" = 0, "right" = 1)
val_labels(codebook_data$MC3hobbiescorrect) <- c("wrong" = 0, "right" = 1)
codebook_data <- codebook_data %>% mutate_at(vars(BehVig8, BehVig26, BehVig27, BehVig28, BehVig29, BehVig30), reverse_labelled_values)
codebook_data$BehVig <- codebook_data %>% select(BehVig1:BehVig30) %>% aggregate_and_document_scale()
codebook_data$Matevalue <- codebook_data %>% select(matevalue1:matevalue5) %>% aggregate_and_document_scale()
codebook_data$RomInterest <- codebook_data %>% select(RomInterest_1:RomInterest_8) %>% aggregate_and_document_scale()
dict <- rio::import("https://osf.io/uq98j/download", "xlsx")
#
# var_label(codebook_data) <- dict %>% select(Variable, Label) %>% dict_to_list()
# omit the following lines, if your missing values are already properly labelled
codebook_data <- detect_missing(codebook_data,
only_labelled = TRUE, # only labelled values are autodetected as
# missing
negative_values_are_missing = FALSE, # negative values are missing values
ninety_nine_problems = TRUE, # 99/999 are missing values, if they
# are more than 5 MAD from the median
)
# If you are not using formr, the codebook package needs to guess which items
# form a scale. The following line finds item aggregates with names like this:
# scale = scale_1 + scale_2R + scale_3R
# identifying these aggregates allows the codebook function to
# automatically compute reliabilities.
# However, it will not reverse items automatically.
codebook_data <- detect_scales(codebook_data)metadata(codebook_data)$name <- "An evolutionary perspective on intergroup dating bias"
metadata(codebook_data)$description <- paste0("
### Download link
[Open Science Framework](https://osf.io/btzku/download)
")
metadata(codebook_data)$identifier <- "https://osf.io/6bwmq/"
metadata(codebook_data)$datePublished <- "2018-01-24"
metadata(codebook_data)$contributors <- list(
"Samantha Brindley "," Melissa Marie McDonald "," Lisa Welling "," Virgil Zeigler-Hill ")
metadata(codebook_data)$citation <- " Samantha Brindley, Melissa M. McDonald, Lisa L. M. Welling & Virgil Zeigler-Hill (2018) An evolutionary perspective on intergroup dating bias, Comprehensive Results in Social Psychology, 3:1, 28-55, DOI: 10.1080/23743603.2018.1436939 "
metadata(codebook_data)$url <- "https://osf.io/btzku/"
metadata(codebook_data)$temporalCoverage <- "2018"
metadata(codebook_data)$distribution = list(
list("@type" = "DataDownload",
"requiresSubscription" = "http://schema.org/True",
"encodingFormat" = "https://www.loc.gov/preservation/digital/formats/fdd/fdd000469.shtml",
contentUrl = "https://osf.io/btzku/download")
)codebook(codebook_data)knitr::asis_output(data_info)Metadata
Description
if (exists("name", meta)) {
  glue::glue(
    "__Dataset name__: {name}",
    .envir = meta)
}
Dataset name: An evolutionary perspective on intergroup dating bias
cat(description)Download link
Temporal Coverage: 2018
- Citation: Samantha Brindley, Melissa M. McDonald, Lisa L. M. Welling & Virgil Zeigler-Hill (2018) An evolutionary perspective on intergroup dating bias, Comprehensive Results in Social Psychology, 3:1, 28-55, DOI: 10.1080/23743603.2018.1436939
- URL: https://osf.io/btzku/
- Identifier: https://osf.io/6bwmq/
Date published: 2018-01-24
meta <- meta[setdiff(names(meta),
                     c("creator", "datePublished", "identifier",
                       "url", "citation", "spatialCoverage",
                       "temporalCoverage", "description", "name"))]
pander::pander(meta)contributors:
- Samantha Brindley
- Melissa Marie McDonald
- Lisa Welling
- Virgil Zeigler-Hill
distribution:
   * **@type**: DataDownload
   * **requiresSubscription**: http://schema.org/True
   * **encodingFormat**: https://www.loc.gov/preservation/digital/formats/fdd/fdd000469.shtml
   * **contentUrl**: https://osf.io/btzku/download
keywords: startdate, enddate, ConsentAgree, keepdrop, conriskkeepdrop, targetincome, targetformidability, targetgroupstatus, conceptionrisk, vsc, rominterest, matevalue, Cconceptionrisk, Cvsc, age, gender, turkprimegender, sexorien, citizen, hormcon, education, single, annualincome, duplicateID, demoexclusioncriteria, carelessresponding, AttentionCheck, attentioncheckpf, targetphoto, targetnationality, completedsurvey, compensated, race_1, race_2, race_3, race_4, race_5, race_6, race_7, BehVig1, BehVig2, BehVig3, BehVig4, BehVig5, BehVig6, BehVig7, BehVig8, BehVig9, BehVig10, BehVig11, BehVig12, BehVig13, BehVig14, BehVig15, BehVig16, BehVig17, BehVig18, BehVig19, BehVig20, BehVig21, BehVig22, BehVig23, BehVig24, BehVig25, BehVig26, BehVig27, BehVig28, BehVig29, BehVig30, BehVig8r, BehVig26r, BehVig27r, BehVig28r, BehVig29r, BehVig30r, matevalue1, matevalue2, matevalue3, matevalue4, matevalue5, RomInterest_1, RomInterest_2, RomInterest_3, RomInterest_4, RomInterest_5, RomInterest_6, RomInterest_7, RomInterest_8, Menstruated, MenstStop, HRT, HorCon3mon, ContraceptiveKind, PregnantDue, ChildBirth, LastPeriod, LastPeriodAcc_1, PerBefLast, PerBefLastAcc_1, PerNext, PerNextAcc_1, CycleLength, CycleLengthAcc_1, conriskexclusion, weightedaveragecycle, weightedaveragecyclerounded, daysfromovulation, MC1nationality, MC2income, MC3hobbies, MC4age, MC5profession, MC1nationalitycorrect, MC2incomecorrect, MC3hobbiescorrect, groupXincome, groupXformid, groupXcrisk, groupXvsc, incomeXformid, incomeXcrisk, incomeXvsc, formidXcrisk, formidXvsc, criskXvsc, groupXincomeXformid, groupXincomeXcrisk, groupXincomeXvsc, groupXformidXcrisk, groupXformidXvsc, groupXcriskXvsc, incomeXformidXcrisk, incomeXformidXvsc, incomeXcriskXvsc, formidXcriskXvsc, groupXincomeXformidXcrisk, groupXincomeXcriskXvsc, groupXformidXcriskXvsc, incomeXformidXcriskXvsc, groupXincomeXformidXvsc, groupXincomeXformidXcriskXvsc, filter$_, BehVig, Matevalue and RomInterest
knitr::asis_output(survey_overview)Variables
knitr::asis_output(paste0(scales_items, sep = "\n\n\n", collapse = "\n\n\n"))startdate
Start time
Distribution
show_missing_values <- FALSE
if (has_labels(item)) {
  missing_values <- item[is.na(haven::zap_missing(item))]
  attributes(missing_values) <- attributes(item)
  if (!is.null(attributes(item)$labels)) {
    attributes(missing_values)$labels <- attributes(missing_values)$labels[is.na(attributes(missing_values)$labels)]
    attributes(item)$labels <- attributes(item)$labels[!is.na(attributes(item)$labels)]
  }
  if (is.double(item)) {
    show_missing_values <- length(unique(haven::na_tag(missing_values))) > 1
    item <- haven::zap_missing(item)
  }
  if (length(item_attributes$labels) == 0 && is.numeric(item)) {
    item <- haven::zap_labels(item)
  }
}
item_nomiss <- item[!is.na(item)]

# unnest mc_multiple and so on
if (
  is.character(item_nomiss) &&
  stringr::str_detect(item_nomiss, stringr::fixed(", ")) &&
  (exists("type", item_info) &&
    stringr::str_detect(item_info$type, pattern = stringr::fixed("multiple")))
  ) {
  item_nomiss <- unlist(stringr::str_split(item_nomiss, pattern = stringr::fixed(", ")))
}
attributes(item_nomiss) <- attributes(item)

old_height <- knitr::opts_chunk$get("fig.height")
non_missing_choices <- item_attributes[["labels"]]
many_labels <- length(non_missing_choices) > 7
go_vertical <- !is.numeric(item_nomiss) || many_labels
if ( go_vertical ) {
  # numeric items are plotted horizontally (because that's what usually expected)
  # categorical items are plotted vertically because we can use the screen real estate better this way

    if (is.null(choices) ||
        dplyr::n_distinct(item_nomiss) > length(non_missing_choices)) {
        non_missing_choices <- unique(item_nomiss)
        names(non_missing_choices) <- non_missing_choices
    }
  choice_multiplier <- old_height/6.5
    new_height <- 2 + choice_multiplier * length(non_missing_choices)
    new_height <- ifelse(new_height > 20, 20, new_height)
    new_height <- ifelse(new_height < 1, 1, new_height)
    knitr::opts_chunk$set(fig.height = new_height)
}

wrap_at <- knitr::opts_chunk$get("fig.width") * 10
# todo: if there are free-text choices mingled in with the pre-defined ones, don't show
# todo: show rare items if they are pre-defined
# todo: bin rare responses into "other category"
if (!length(item_nomiss)) {
cat("No non-missing values to show.")
} else if (is.numeric(item_nomiss) || dplyr::n_distinct(item_nomiss) < 20) {
plot_labelled(item_nomiss, item_name, wrap_at, go_vertical)
} else {
cat(dplyr::n_distinct(item_nomiss), " unique, categorical values, so not shown.")
}
knitr::opts_chunk$set(fig.height = old_height)4 missing values.
Summary statistics
attributes(item) <- item_attributes
df = data.frame(item, stringsAsFactors = FALSE)
names(df) = html_item_name
escaped_table(codebook_table(df))| name | label | data_type | missing | complete | n | mean | sd | p0 | p25 | p50 | p75 | p100 | hist | format.spss |
|---|---|---|---|---|---|---|---|---|---|---|---|---|---|---|
| startdate | Start time | numeric | 4 | 2002 | 2006 | 1.4e+10 | 5.6e+07 | 1.4e+10 | 1.4e+10 | 1.4e+10 | 1.4e+10 | 1.4e+10 | ▆▁▁▁▁▁▁▇ | F8.12 |
if (show_missing_values) {
  plot_labelled(missing_values, item_name, wrap_at)
}
if (!is.null(item_info)) {
# don't show choices again, if they're basically same thing as value labels
if (!is.null(choices) && !is.null(item_info$choices) &&
all(names(na.omit(choices)) == item_info$choices) &&
all(na.omit(choices) == names(item_info$choices))) {
item_info$choices <- NULL
}
item_info$label_parsed <-
item_info$choice_list <- item_info$study_id <- item_info$id <- NULL
pander::pander(item_info)
}if (!is.null(choices) && length(choices) && length(choices) < 30) {
pander::pander(as.list(choices))
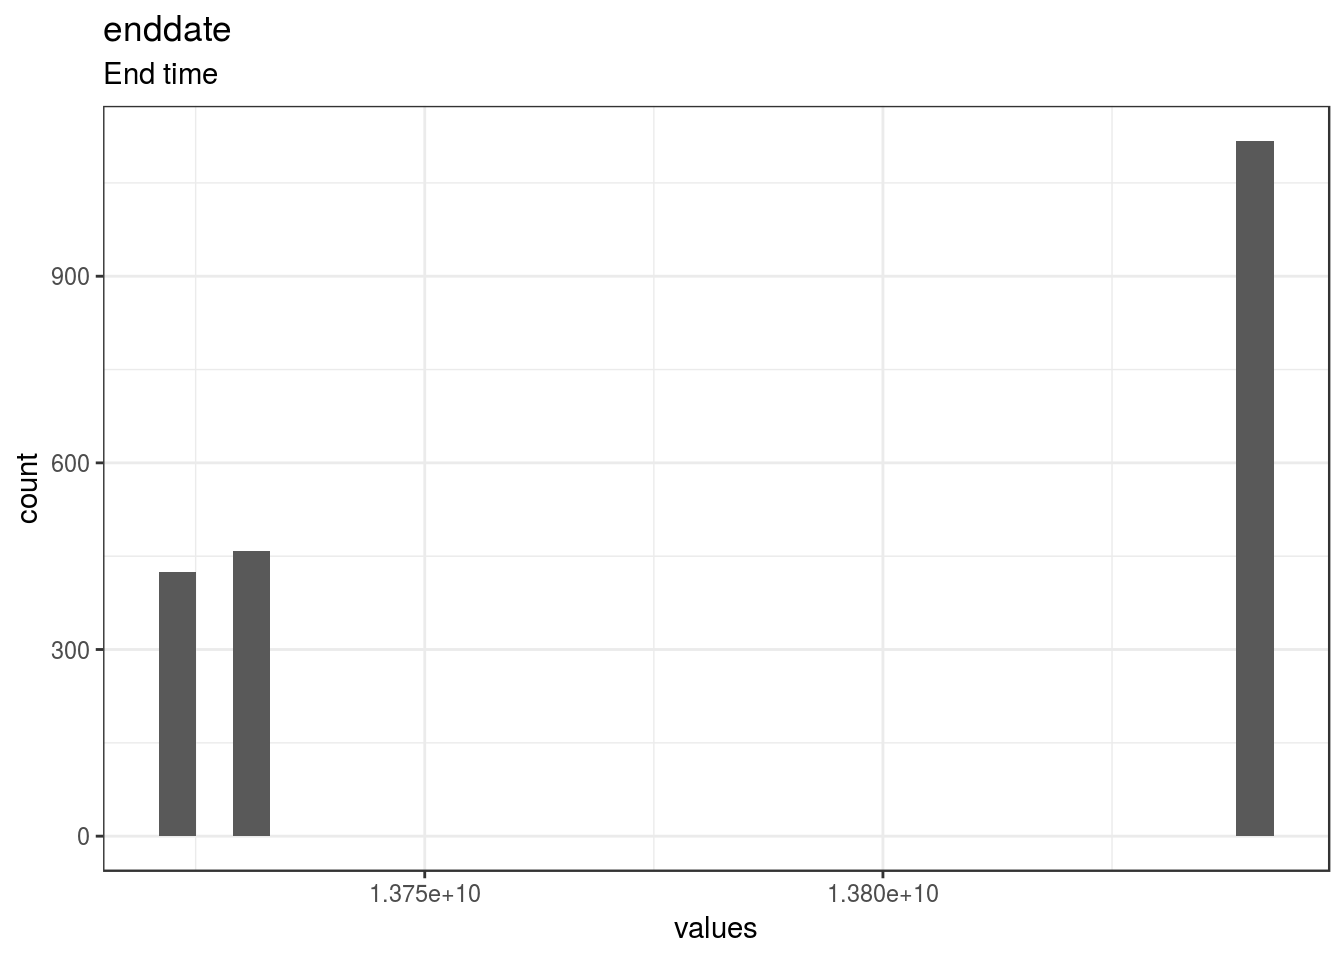
}enddate
End time
Distribution
show_missing_values <- FALSE
if (has_labels(item)) {
missing_values <- item[is.na(haven::zap_missing(item))]
attributes(missing_values) <- attributes(item)
if (!is.null(attributes(item)$labels)) {
attributes(missing_values)$labels <- attributes(missing_values)$labels[is.na(attributes(missing_values)$labels)]
attributes(item)$labels <- attributes(item)$labels[!is.na(attributes(item)$labels)]
}
if (is.double(item)) {
show_missing_values <- length(unique(haven::na_tag(missing_values))) > 1
item <- haven::zap_missing(item)
}
if (length(item_attributes$labels) == 0 && is.numeric(item)) {
item <- haven::zap_labels(item)
}
}
item_nomiss <- item[!is.na(item)]
# unnest mc_multiple and so on
if (
is.character(item_nomiss) &&
stringr::str_detect(item_nomiss, stringr::fixed(", ")) &&
(exists("type", item_info) &&
stringr::str_detect(item_info$type, pattern = stringr::fixed("multiple")))
) {
item_nomiss <- unlist(stringr::str_split(item_nomiss, pattern = stringr::fixed(", ")))
}
attributes(item_nomiss) <- attributes(item)
old_height <- knitr::opts_chunk$get("fig.height")
non_missing_choices <- item_attributes[["labels"]]
many_labels <- length(non_missing_choices) > 7
go_vertical <- !is.numeric(item_nomiss) || many_labels
if ( go_vertical ) {
# numeric items are plotted horizontally (because that's what usually expected)
# categorical items are plotted vertically because we can use the screen real estate better this way
if (is.null(choices) ||
dplyr::n_distinct(item_nomiss) > length(non_missing_choices)) {
non_missing_choices <- unique(item_nomiss)
names(non_missing_choices) <- non_missing_choices
}
choice_multiplier <- old_height/6.5
new_height <- 2 + choice_multiplier * length(non_missing_choices)
new_height <- ifelse(new_height > 20, 20, new_height)
new_height <- ifelse(new_height < 1, 1, new_height)
knitr::opts_chunk$set(fig.height = new_height)
}
wrap_at <- knitr::opts_chunk$get("fig.width") * 10# todo: if there are free-text choices mingled in with the pre-defined ones, don't show
# todo: show rare items if they are pre-defined
# todo: bin rare responses into "other category"
if (!length(item_nomiss)) {
cat("No non-missing values to show.")
} else if (is.numeric(item_nomiss) || dplyr::n_distinct(item_nomiss) < 20) {
plot_labelled(item_nomiss, item_name, wrap_at, go_vertical)
} else {
cat(dplyr::n_distinct(item_nomiss), " unique, categorical values, so not shown.")
}
knitr::opts_chunk$set(fig.height = old_height)4 missing values.
Summary statistics
attributes(item) <- item_attributes
df = data.frame(item, stringsAsFactors = FALSE)
names(df) = html_item_name
escaped_table(codebook_table(df))| name | label | data_type | missing | complete | n | mean | sd | p0 | p25 | p50 | p75 | p100 | hist | format.spss |
|---|---|---|---|---|---|---|---|---|---|---|---|---|---|---|
| enddate | End time | numeric | 4 | 2002 | 2006 | 1.4e+10 | 5.6e+07 | 1.4e+10 | 1.4e+10 | 1.4e+10 | 1.4e+10 | 1.4e+10 | ▆▁▁▁▁▁▁▇ | F8.12 |
if (show_missing_values) {
plot_labelled(missing_values, item_name, wrap_at)
}if (!is.null(item_info)) {
# don't show choices again, if they're basically same thing as value labels
if (!is.null(choices) && !is.null(item_info$choices) &&
all(names(na.omit(choices)) == item_info$choices) &&
all(na.omit(choices) == names(item_info$choices))) {
item_info$choices <- NULL
}
item_info$label_parsed <-
item_info$choice_list <- item_info$study_id <- item_info$id <- NULL
pander::pander(item_info)
}if (!is.null(choices) && length(choices) && length(choices) < 30) {
pander::pander(as.list(choices))
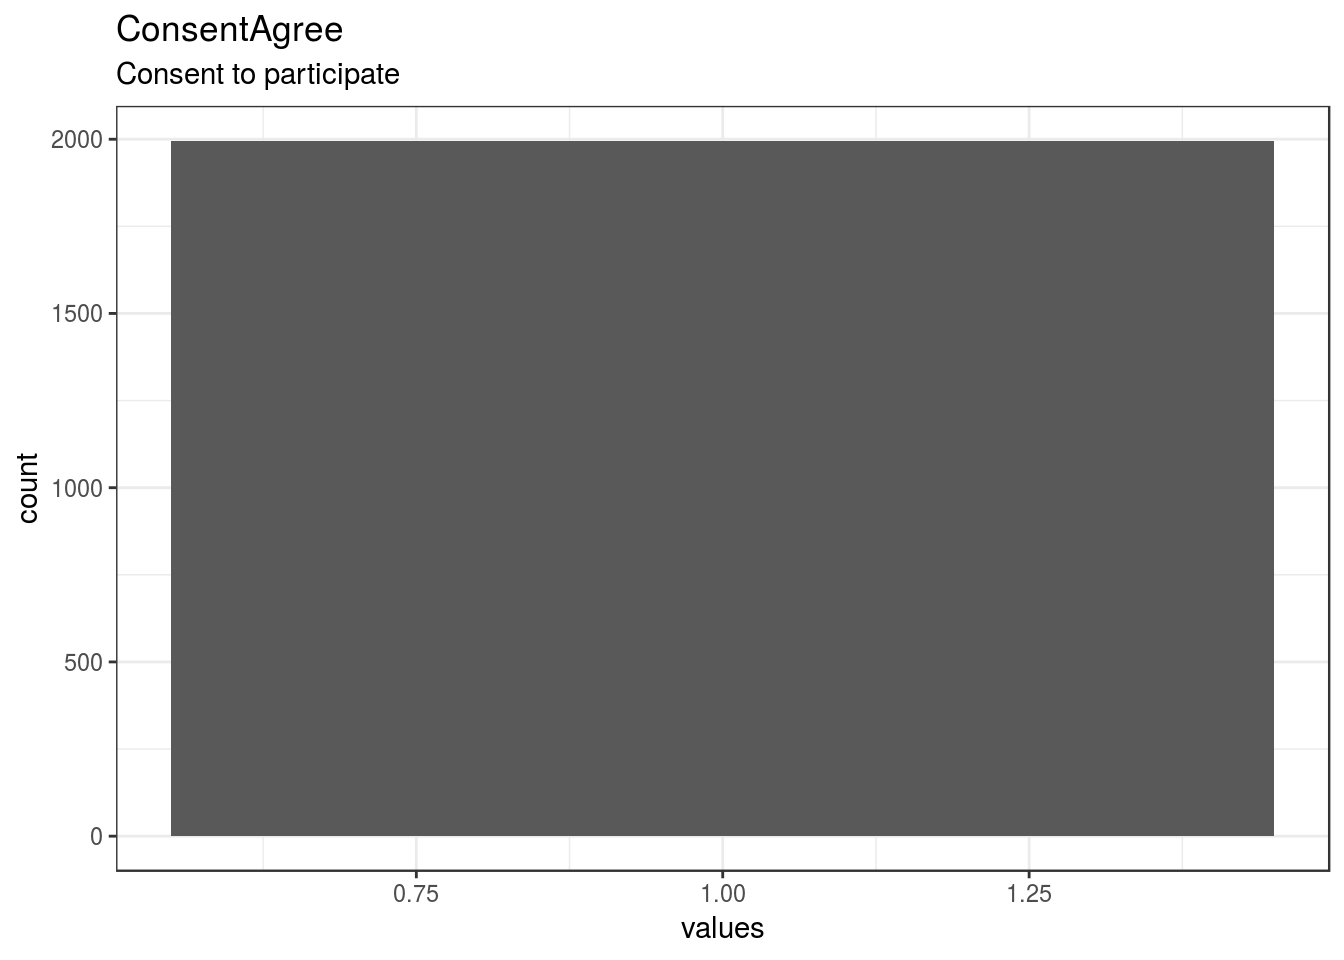
}ConsentAgree
Consent to participate
Distribution
show_missing_values <- FALSE
if (has_labels(item)) {
missing_values <- item[is.na(haven::zap_missing(item))]
attributes(missing_values) <- attributes(item)
if (!is.null(attributes(item)$labels)) {
attributes(missing_values)$labels <- attributes(missing_values)$labels[is.na(attributes(missing_values)$labels)]
attributes(item)$labels <- attributes(item)$labels[!is.na(attributes(item)$labels)]
}
if (is.double(item)) {
show_missing_values <- length(unique(haven::na_tag(missing_values))) > 1
item <- haven::zap_missing(item)
}
if (length(item_attributes$labels) == 0 && is.numeric(item)) {
item <- haven::zap_labels(item)
}
}
item_nomiss <- item[!is.na(item)]
# unnest mc_multiple and so on
if (
is.character(item_nomiss) &&
stringr::str_detect(item_nomiss, stringr::fixed(", ")) &&
(exists("type", item_info) &&
stringr::str_detect(item_info$type, pattern = stringr::fixed("multiple")))
) {
item_nomiss <- unlist(stringr::str_split(item_nomiss, pattern = stringr::fixed(", ")))
}
attributes(item_nomiss) <- attributes(item)
old_height <- knitr::opts_chunk$get("fig.height")
non_missing_choices <- item_attributes[["labels"]]
many_labels <- length(non_missing_choices) > 7
go_vertical <- !is.numeric(item_nomiss) || many_labels
if ( go_vertical ) {
# numeric items are plotted horizontally (because that's what usually expected)
# categorical items are plotted vertically because we can use the screen real estate better this way
if (is.null(choices) ||
dplyr::n_distinct(item_nomiss) > length(non_missing_choices)) {
non_missing_choices <- unique(item_nomiss)
names(non_missing_choices) <- non_missing_choices
}
choice_multiplier <- old_height/6.5
new_height <- 2 + choice_multiplier * length(non_missing_choices)
new_height <- ifelse(new_height > 20, 20, new_height)
new_height <- ifelse(new_height < 1, 1, new_height)
knitr::opts_chunk$set(fig.height = new_height)
}
wrap_at <- knitr::opts_chunk$get("fig.width") * 10# todo: if there are free-text choices mingled in with the pre-defined ones, don't show
# todo: show rare items if they are pre-defined
# todo: bin rare responses into "other category"
if (!length(item_nomiss)) {
cat("No non-missing values to show.")
} else if (is.numeric(item_nomiss) || dplyr::n_distinct(item_nomiss) < 20) {
plot_labelled(item_nomiss, item_name, wrap_at, go_vertical)
} else {
cat(dplyr::n_distinct(item_nomiss), " unique, categorical values, so not shown.")
}
knitr::opts_chunk$set(fig.height = old_height)10 missing values.
Summary statistics
attributes(item) <- item_attributes
df = data.frame(item, stringsAsFactors = FALSE)
names(df) = html_item_name
escaped_table(codebook_table(df))| name | label | data_type | missing | complete | n | mean | sd | p0 | p25 | p50 | p75 | p100 | hist | format.spss |
|---|---|---|---|---|---|---|---|---|---|---|---|---|---|---|
| ConsentAgree | Consent to participate | numeric | 10 | 1996 | 2006 | 1 | 0 | 1 | 1 | 1 | 1 | 1 | ▁▁▁▇▁▁▁▁ | F8.0 |
if (show_missing_values) {
plot_labelled(missing_values, item_name, wrap_at)
}if (!is.null(item_info)) {
# don't show choices again, if they're basically same thing as value labels
if (!is.null(choices) && !is.null(item_info$choices) &&
all(names(na.omit(choices)) == item_info$choices) &&
all(na.omit(choices) == names(item_info$choices))) {
item_info$choices <- NULL
}
item_info$label_parsed <-
item_info$choice_list <- item_info$study_id <- item_info$id <- NULL
pander::pander(item_info)
}if (!is.null(choices) && length(choices) && length(choices) < 30) {
pander::pander(as.list(choices))
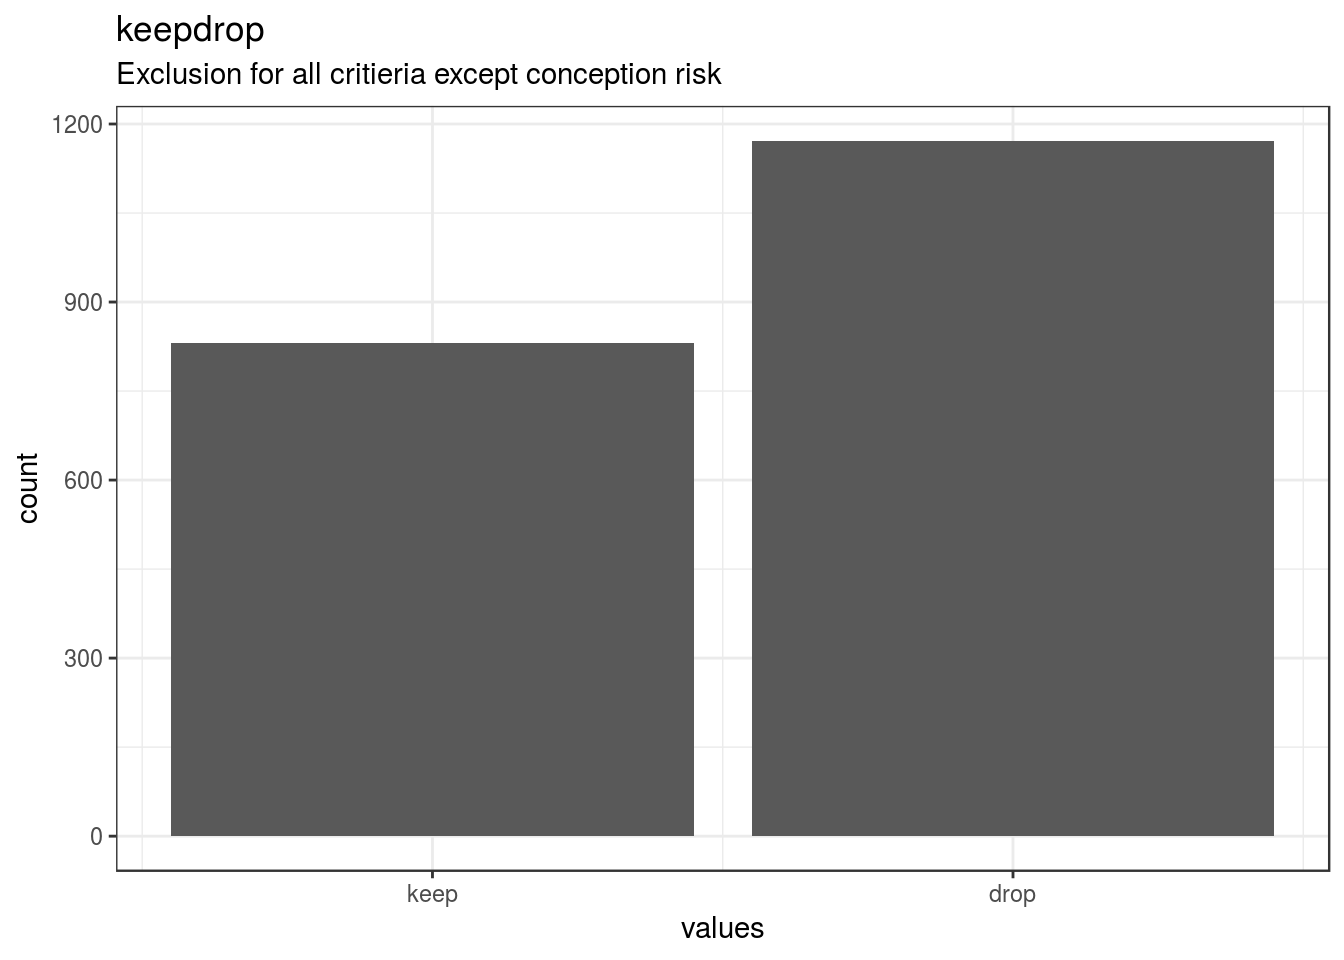
}keepdrop
Exclusion for all critieria except conception risk
Distribution
show_missing_values <- FALSE
if (has_labels(item)) {
missing_values <- item[is.na(haven::zap_missing(item))]
attributes(missing_values) <- attributes(item)
if (!is.null(attributes(item)$labels)) {
attributes(missing_values)$labels <- attributes(missing_values)$labels[is.na(attributes(missing_values)$labels)]
attributes(item)$labels <- attributes(item)$labels[!is.na(attributes(item)$labels)]
}
if (is.double(item)) {
show_missing_values <- length(unique(haven::na_tag(missing_values))) > 1
item <- haven::zap_missing(item)
}
if (length(item_attributes$labels) == 0 && is.numeric(item)) {
item <- haven::zap_labels(item)
}
}
item_nomiss <- item[!is.na(item)]
# unnest mc_multiple and so on
if (
is.character(item_nomiss) &&
stringr::str_detect(item_nomiss, stringr::fixed(", ")) &&
(exists("type", item_info) &&
stringr::str_detect(item_info$type, pattern = stringr::fixed("multiple")))
) {
item_nomiss <- unlist(stringr::str_split(item_nomiss, pattern = stringr::fixed(", ")))
}
attributes(item_nomiss) <- attributes(item)
old_height <- knitr::opts_chunk$get("fig.height")
non_missing_choices <- item_attributes[["labels"]]
many_labels <- length(non_missing_choices) > 7
go_vertical <- !is.numeric(item_nomiss) || many_labels
if ( go_vertical ) {
# numeric items are plotted horizontally (because that's what usually expected)
# categorical items are plotted vertically because we can use the screen real estate better this way
if (is.null(choices) ||
dplyr::n_distinct(item_nomiss) > length(non_missing_choices)) {
non_missing_choices <- unique(item_nomiss)
names(non_missing_choices) <- non_missing_choices
}
choice_multiplier <- old_height/6.5
new_height <- 2 + choice_multiplier * length(non_missing_choices)
new_height <- ifelse(new_height > 20, 20, new_height)
new_height <- ifelse(new_height < 1, 1, new_height)
knitr::opts_chunk$set(fig.height = new_height)
}
wrap_at <- knitr::opts_chunk$get("fig.width") * 10# todo: if there are free-text choices mingled in with the pre-defined ones, don't show
# todo: show rare items if they are pre-defined
# todo: bin rare responses into "other category"
if (!length(item_nomiss)) {
cat("No non-missing values to show.")
} else if (is.numeric(item_nomiss) || dplyr::n_distinct(item_nomiss) < 20) {
plot_labelled(item_nomiss, item_name, wrap_at, go_vertical)
} else {
cat(dplyr::n_distinct(item_nomiss), " unique, categorical values, so not shown.")
}
knitr::opts_chunk$set(fig.height = old_height)3 missing values.
Summary statistics
attributes(item) <- item_attributes
df = data.frame(item, stringsAsFactors = FALSE)
names(df) = html_item_name
escaped_table(codebook_table(df))| name | label | data_type | value_labels | missing | complete | n | mean | sd | p0 | p25 | p50 | p75 | p100 | hist | format.spss |
|---|---|---|---|---|---|---|---|---|---|---|---|---|---|---|---|
| keepdrop | Exclusion for all critieria except conception risk | numeric | 0. keep, 1. drop |
3 | 2003 | 2006 | 0.59 | 0.49 | 0 | 0 | 1 | 1 | 1 | ▆▁▁▁▁▁▁▇ | F8.0 |
if (show_missing_values) {
plot_labelled(missing_values, item_name, wrap_at)
}if (!is.null(item_info)) {
# don't show choices again, if they're basically same thing as value labels
if (!is.null(choices) && !is.null(item_info$choices) &&
all(names(na.omit(choices)) == item_info$choices) &&
all(na.omit(choices) == names(item_info$choices))) {
item_info$choices <- NULL
}
item_info$label_parsed <-
item_info$choice_list <- item_info$study_id <- item_info$id <- NULL
pander::pander(item_info)
}Value labels
if (!is.null(choices) && length(choices) && length(choices) < 30) {
    pander::pander(as.list(choices))
}- keep: 0
- drop: 1
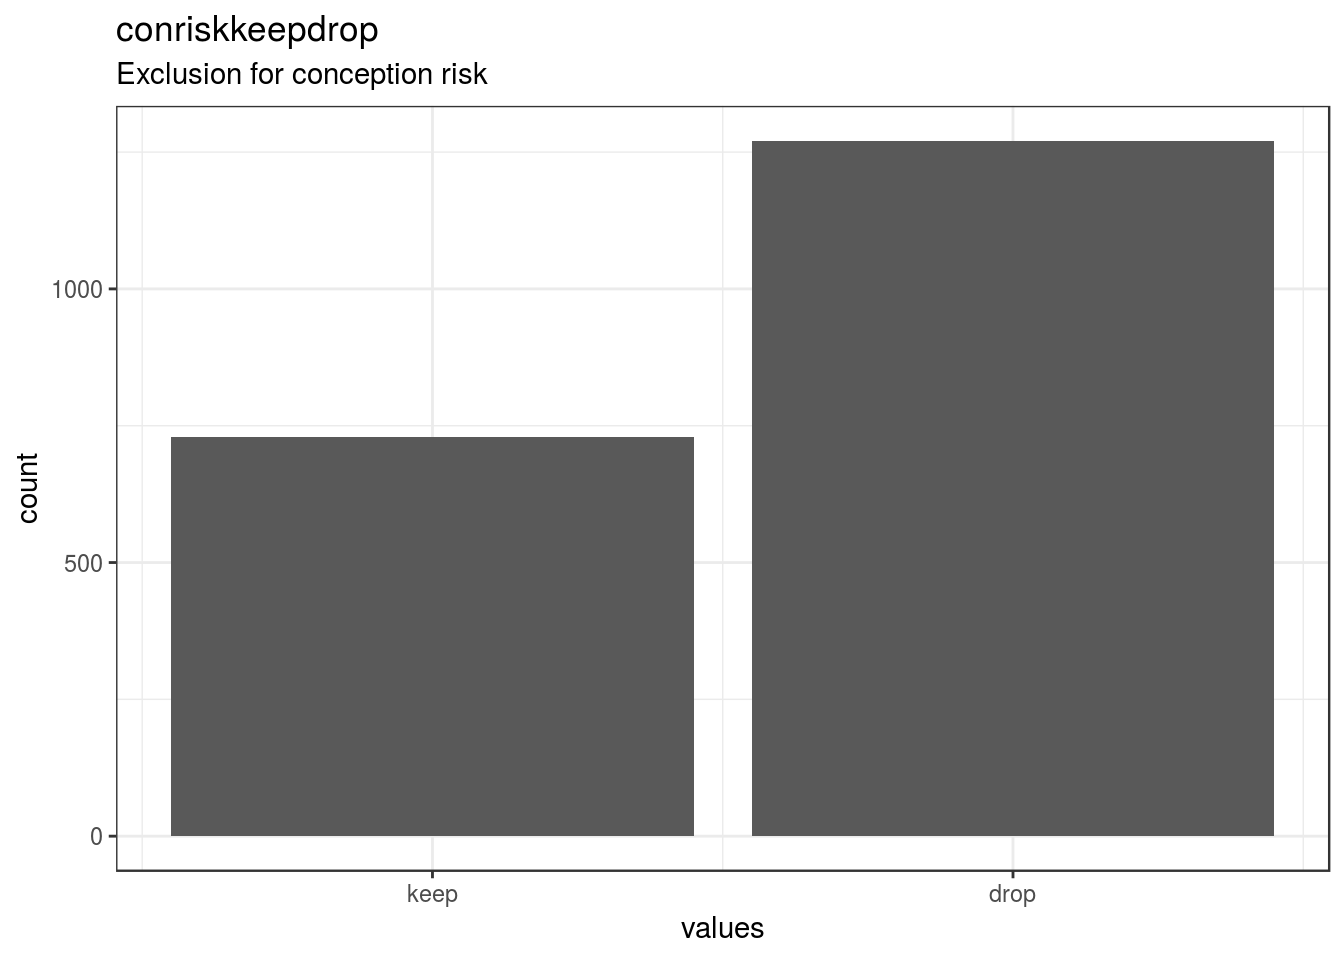
conriskkeepdrop
Exclusion for conception risk
Distribution
show_missing_values <- FALSE
if (has_labels(item)) {
  missing_values <- item[is.na(haven::zap_missing(item))]
  attributes(missing_values) <- attributes(item)
  if (!is.null(attributes(item)$labels)) {
    attributes(missing_values)$labels <- attributes(missing_values)$labels[is.na(attributes(missing_values)$labels)]
    attributes(item)$labels <- attributes(item)$labels[!is.na(attributes(item)$labels)]
  }
  if (is.double(item)) {
    show_missing_values <- length(unique(haven::na_tag(missing_values))) > 1
    item <- haven::zap_missing(item)
  }
  if (length(item_attributes$labels) == 0 && is.numeric(item)) {
    item <- haven::zap_labels(item)
  }
}
item_nomiss <- item[!is.na(item)]

# unnest mc_multiple and so on
if (
  is.character(item_nomiss) &&
  stringr::str_detect(item_nomiss, stringr::fixed(", ")) &&
  (exists("type", item_info) &&
    stringr::str_detect(item_info$type, pattern = stringr::fixed("multiple")))
  ) {
  item_nomiss <- unlist(stringr::str_split(item_nomiss, pattern = stringr::fixed(", ")))
}
attributes(item_nomiss) <- attributes(item)

old_height <- knitr::opts_chunk$get("fig.height")
non_missing_choices <- item_attributes[["labels"]]
many_labels <- length(non_missing_choices) > 7
go_vertical <- !is.numeric(item_nomiss) || many_labels
if ( go_vertical ) {
  # numeric items are plotted horizontally (because that's what usually expected)
  # categorical items are plotted vertically because we can use the screen real estate better this way

    if (is.null(choices) ||
        dplyr::n_distinct(item_nomiss) > length(non_missing_choices)) {
        non_missing_choices <- unique(item_nomiss)
        names(non_missing_choices) <- non_missing_choices
    }
  choice_multiplier <- old_height/6.5
    new_height <- 2 + choice_multiplier * length(non_missing_choices)
    new_height <- ifelse(new_height > 20, 20, new_height)
    new_height <- ifelse(new_height < 1, 1, new_height)
    knitr::opts_chunk$set(fig.height = new_height)
}

wrap_at <- knitr::opts_chunk$get("fig.width") * 10
# todo: if there are free-text choices mingled in with the pre-defined ones, don't show
# todo: show rare items if they are pre-defined
# todo: bin rare responses into "other category"
if (!length(item_nomiss)) {
cat("No non-missing values to show.")
} else if (is.numeric(item_nomiss) || dplyr::n_distinct(item_nomiss) < 20) {
plot_labelled(item_nomiss, item_name, wrap_at, go_vertical)
} else {
cat(dplyr::n_distinct(item_nomiss), " unique, categorical values, so not shown.")
}
knitr::opts_chunk$set(fig.height = old_height)6 missing values.
Summary statistics
attributes(item) <- item_attributes
df = data.frame(item, stringsAsFactors = FALSE)
names(df) = html_item_name
escaped_table(codebook_table(df))| name | label | data_type | value_labels | missing | complete | n | mean | sd | p0 | p25 | p50 | p75 | p100 | hist | format.spss |
|---|---|---|---|---|---|---|---|---|---|---|---|---|---|---|---|
| conriskkeepdrop | Exclusion for conception risk | numeric | 0. keep, 1. drop |
6 | 2000 | 2006 | 0.64 | 0.48 | 0 | 0 | 1 | 1 | 1 | ▅▁▁▁▁▁▁▇ | F8.0 |
if (show_missing_values) {
  plot_labelled(missing_values, item_name, wrap_at)
}
if (!is.null(item_info)) {
# don't show choices again, if they're basically same thing as value labels
if (!is.null(choices) && !is.null(item_info$choices) &&
all(names(na.omit(choices)) == item_info$choices) &&
all(na.omit(choices) == names(item_info$choices))) {
item_info$choices <- NULL
}
item_info$label_parsed <-
item_info$choice_list <- item_info$study_id <- item_info$id <- NULL
pander::pander(item_info)
}Value labels
if (!is.null(choices) && length(choices) && length(choices) < 30) {
    pander::pander(as.list(choices))
}- keep: 0
- drop: 1
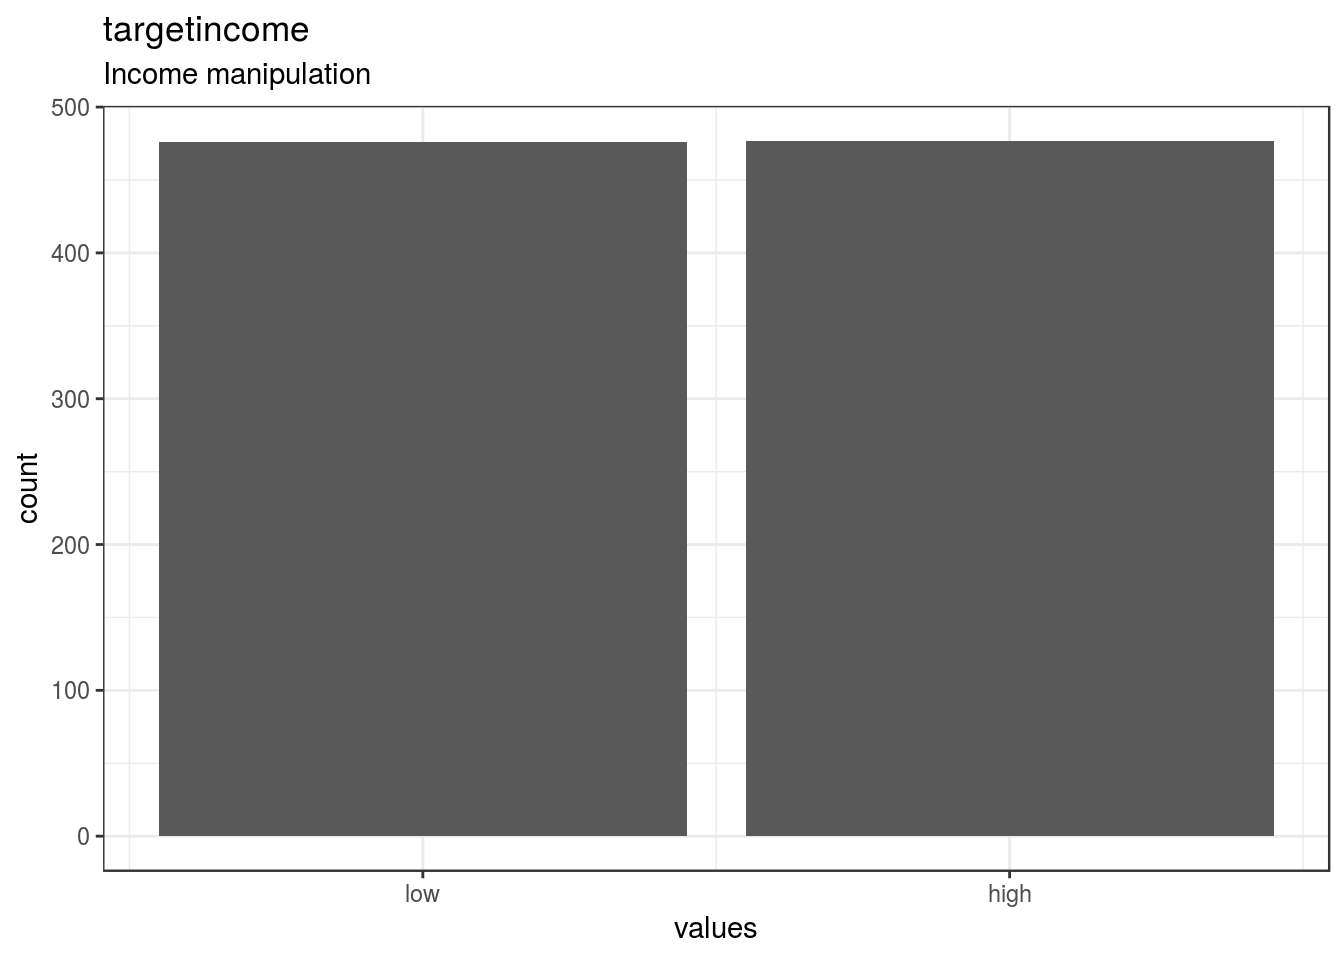
targetincome
Income manipulation
Distribution
show_missing_values <- FALSE
if (has_labels(item)) {
  missing_values <- item[is.na(haven::zap_missing(item))]
  attributes(missing_values) <- attributes(item)
  if (!is.null(attributes(item)$labels)) {
    attributes(missing_values)$labels <- attributes(missing_values)$labels[is.na(attributes(missing_values)$labels)]
    attributes(item)$labels <- attributes(item)$labels[!is.na(attributes(item)$labels)]
  }
  if (is.double(item)) {
    show_missing_values <- length(unique(haven::na_tag(missing_values))) > 1
    item <- haven::zap_missing(item)
  }
  if (length(item_attributes$labels) == 0 && is.numeric(item)) {
    item <- haven::zap_labels(item)
  }
}
item_nomiss <- item[!is.na(item)]

# unnest mc_multiple and so on
if (
  is.character(item_nomiss) &&
  stringr::str_detect(item_nomiss, stringr::fixed(", ")) &&
  (exists("type", item_info) &&
    stringr::str_detect(item_info$type, pattern = stringr::fixed("multiple")))
  ) {
  item_nomiss <- unlist(stringr::str_split(item_nomiss, pattern = stringr::fixed(", ")))
}
attributes(item_nomiss) <- attributes(item)

old_height <- knitr::opts_chunk$get("fig.height")
non_missing_choices <- item_attributes[["labels"]]
many_labels <- length(non_missing_choices) > 7
go_vertical <- !is.numeric(item_nomiss) || many_labels
if ( go_vertical ) {
  # numeric items are plotted horizontally (because that's what usually expected)
  # categorical items are plotted vertically because we can use the screen real estate better this way

    if (is.null(choices) ||
        dplyr::n_distinct(item_nomiss) > length(non_missing_choices)) {
        non_missing_choices <- unique(item_nomiss)
        names(non_missing_choices) <- non_missing_choices
    }
  choice_multiplier <- old_height/6.5
    new_height <- 2 + choice_multiplier * length(non_missing_choices)
    new_height <- ifelse(new_height > 20, 20, new_height)
    new_height <- ifelse(new_height < 1, 1, new_height)
    knitr::opts_chunk$set(fig.height = new_height)
}

wrap_at <- knitr::opts_chunk$get("fig.width") * 10
# todo: if there are free-text choices mingled in with the pre-defined ones, don't show
# todo: show rare items if they are pre-defined
# todo: bin rare responses into "other category"
if (!length(item_nomiss)) {
cat("No non-missing values to show.")
} else if (is.numeric(item_nomiss) || dplyr::n_distinct(item_nomiss) < 20) {
plot_labelled(item_nomiss, item_name, wrap_at, go_vertical)
} else {
cat(dplyr::n_distinct(item_nomiss), " unique, categorical values, so not shown.")
}
knitr::opts_chunk$set(fig.height = old_height)1053 missing values.
Summary statistics
attributes(item) <- item_attributes
df = data.frame(item, stringsAsFactors = FALSE)
names(df) = html_item_name
escaped_table(codebook_table(df))| name | label | data_type | value_labels | missing | complete | n | mean | sd | p0 | p25 | p50 | p75 | p100 | hist | format.spss |
|---|---|---|---|---|---|---|---|---|---|---|---|---|---|---|---|
| targetincome | Income manipulation | numeric | 0. low, 1. high |
1053 | 953 | 2006 | 0.5 | 0.5 | 0 | 0 | 1 | 1 | 1 | ▇▁▁▁▁▁▁▇ | F8.0 |
if (show_missing_values) {
  plot_labelled(missing_values, item_name, wrap_at)
}
if (!is.null(item_info)) {
# don't show choices again, if they're basically same thing as value labels
if (!is.null(choices) && !is.null(item_info$choices) &&
all(names(na.omit(choices)) == item_info$choices) &&
all(na.omit(choices) == names(item_info$choices))) {
item_info$choices <- NULL
}
item_info$label_parsed <-
item_info$choice_list <- item_info$study_id <- item_info$id <- NULL
pander::pander(item_info)
}Value labels
if (!is.null(choices) && length(choices) && length(choices) < 30) {
    pander::pander(as.list(choices))
}- low: 0
- high: 1
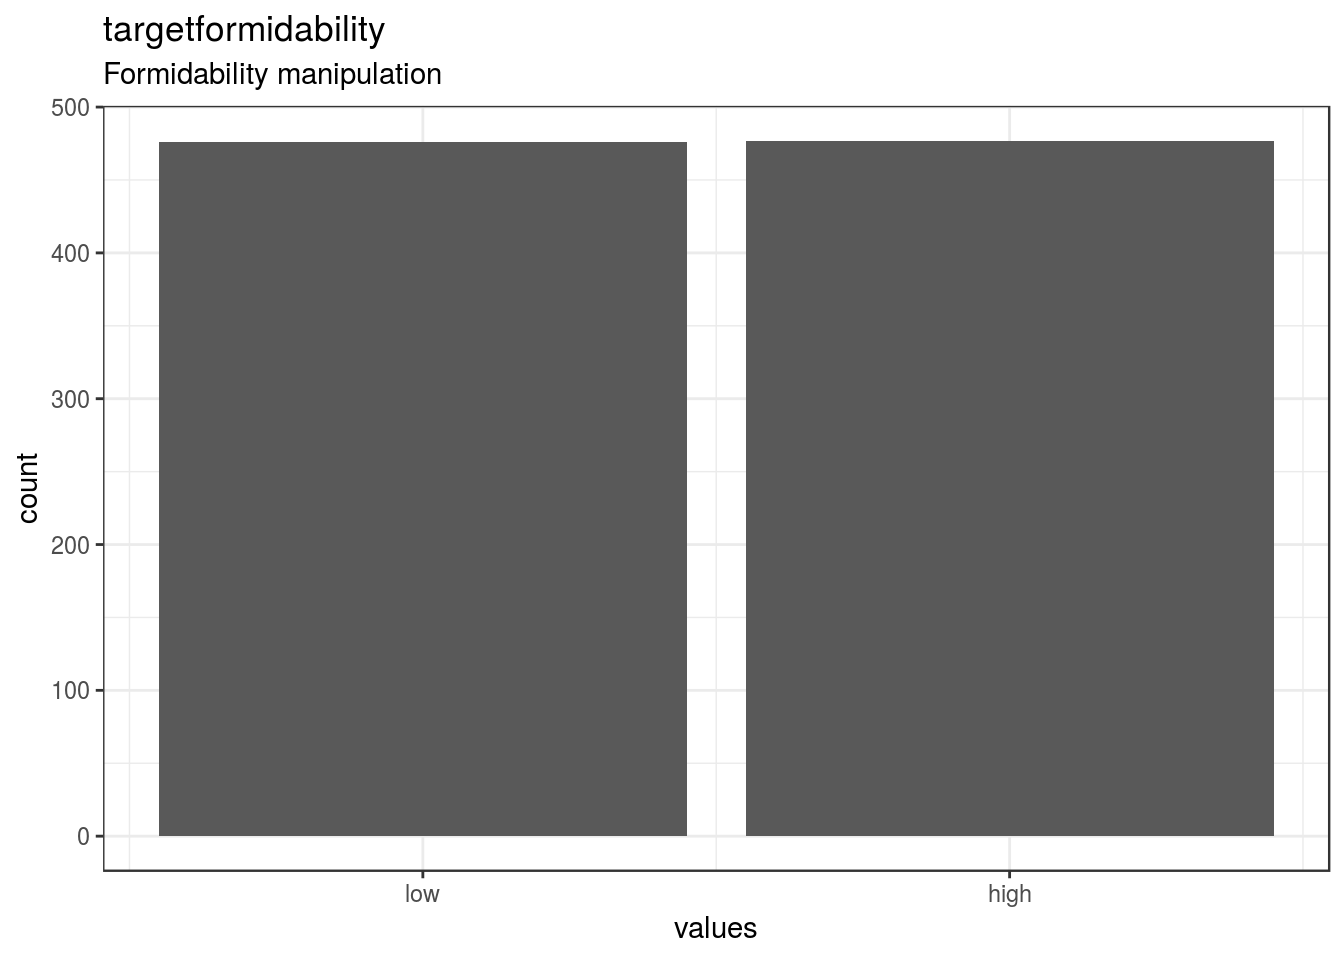
targetformidability
Formidability manipulation
Distribution
show_missing_values <- FALSE
if (has_labels(item)) {
  missing_values <- item[is.na(haven::zap_missing(item))]
  attributes(missing_values) <- attributes(item)
  if (!is.null(attributes(item)$labels)) {
    attributes(missing_values)$labels <- attributes(missing_values)$labels[is.na(attributes(missing_values)$labels)]
    attributes(item)$labels <- attributes(item)$labels[!is.na(attributes(item)$labels)]
  }
  if (is.double(item)) {
    show_missing_values <- length(unique(haven::na_tag(missing_values))) > 1
    item <- haven::zap_missing(item)
  }
  if (length(item_attributes$labels) == 0 && is.numeric(item)) {
    item <- haven::zap_labels(item)
  }
}
item_nomiss <- item[!is.na(item)]

# unnest mc_multiple and so on
if (
  is.character(item_nomiss) &&
  stringr::str_detect(item_nomiss, stringr::fixed(", ")) &&
  (exists("type", item_info) &&
    stringr::str_detect(item_info$type, pattern = stringr::fixed("multiple")))
  ) {
  item_nomiss <- unlist(stringr::str_split(item_nomiss, pattern = stringr::fixed(", ")))
}
attributes(item_nomiss) <- attributes(item)

old_height <- knitr::opts_chunk$get("fig.height")
non_missing_choices <- item_attributes[["labels"]]
many_labels <- length(non_missing_choices) > 7
go_vertical <- !is.numeric(item_nomiss) || many_labels
if ( go_vertical ) {
  # numeric items are plotted horizontally (because that's what usually expected)
  # categorical items are plotted vertically because we can use the screen real estate better this way

    if (is.null(choices) ||
        dplyr::n_distinct(item_nomiss) > length(non_missing_choices)) {
        non_missing_choices <- unique(item_nomiss)
        names(non_missing_choices) <- non_missing_choices
    }
  choice_multiplier <- old_height/6.5
    new_height <- 2 + choice_multiplier * length(non_missing_choices)
    new_height <- ifelse(new_height > 20, 20, new_height)
    new_height <- ifelse(new_height < 1, 1, new_height)
    knitr::opts_chunk$set(fig.height = new_height)
}

wrap_at <- knitr::opts_chunk$get("fig.width") * 10
# todo: if there are free-text choices mingled in with the pre-defined ones, don't show
# todo: show rare items if they are pre-defined
# todo: bin rare responses into "other category"
if (!length(item_nomiss)) {
cat("No non-missing values to show.")
} else if (is.numeric(item_nomiss) || dplyr::n_distinct(item_nomiss) < 20) {
plot_labelled(item_nomiss, item_name, wrap_at, go_vertical)
} else {
cat(dplyr::n_distinct(item_nomiss), " unique, categorical values, so not shown.")
}
knitr::opts_chunk$set(fig.height = old_height)1053 missing values.
Summary statistics
attributes(item) <- item_attributes
df = data.frame(item, stringsAsFactors = FALSE)
names(df) = html_item_name
escaped_table(codebook_table(df))| name | label | data_type | value_labels | missing | complete | n | mean | sd | p0 | p25 | p50 | p75 | p100 | hist | format.spss |
|---|---|---|---|---|---|---|---|---|---|---|---|---|---|---|---|
| targetformidability | Formidability manipulation | numeric | 0. low, 1. high |
1053 | 953 | 2006 | 0.5 | 0.5 | 0 | 0 | 1 | 1 | 1 | ▇▁▁▁▁▁▁▇ | F8.0 |
if (show_missing_values) {
  plot_labelled(missing_values, item_name, wrap_at)
}
if (!is.null(item_info)) {
# don't show choices again, if they're basically same thing as value labels
if (!is.null(choices) && !is.null(item_info$choices) &&
all(names(na.omit(choices)) == item_info$choices) &&
all(na.omit(choices) == names(item_info$choices))) {
item_info$choices <- NULL
}
item_info$label_parsed <-
item_info$choice_list <- item_info$study_id <- item_info$id <- NULL
pander::pander(item_info)
}Value labels
if (!is.null(choices) && length(choices) && length(choices) < 30) {
    pander::pander(as.list(choices))
}- low: 0
- high: 1
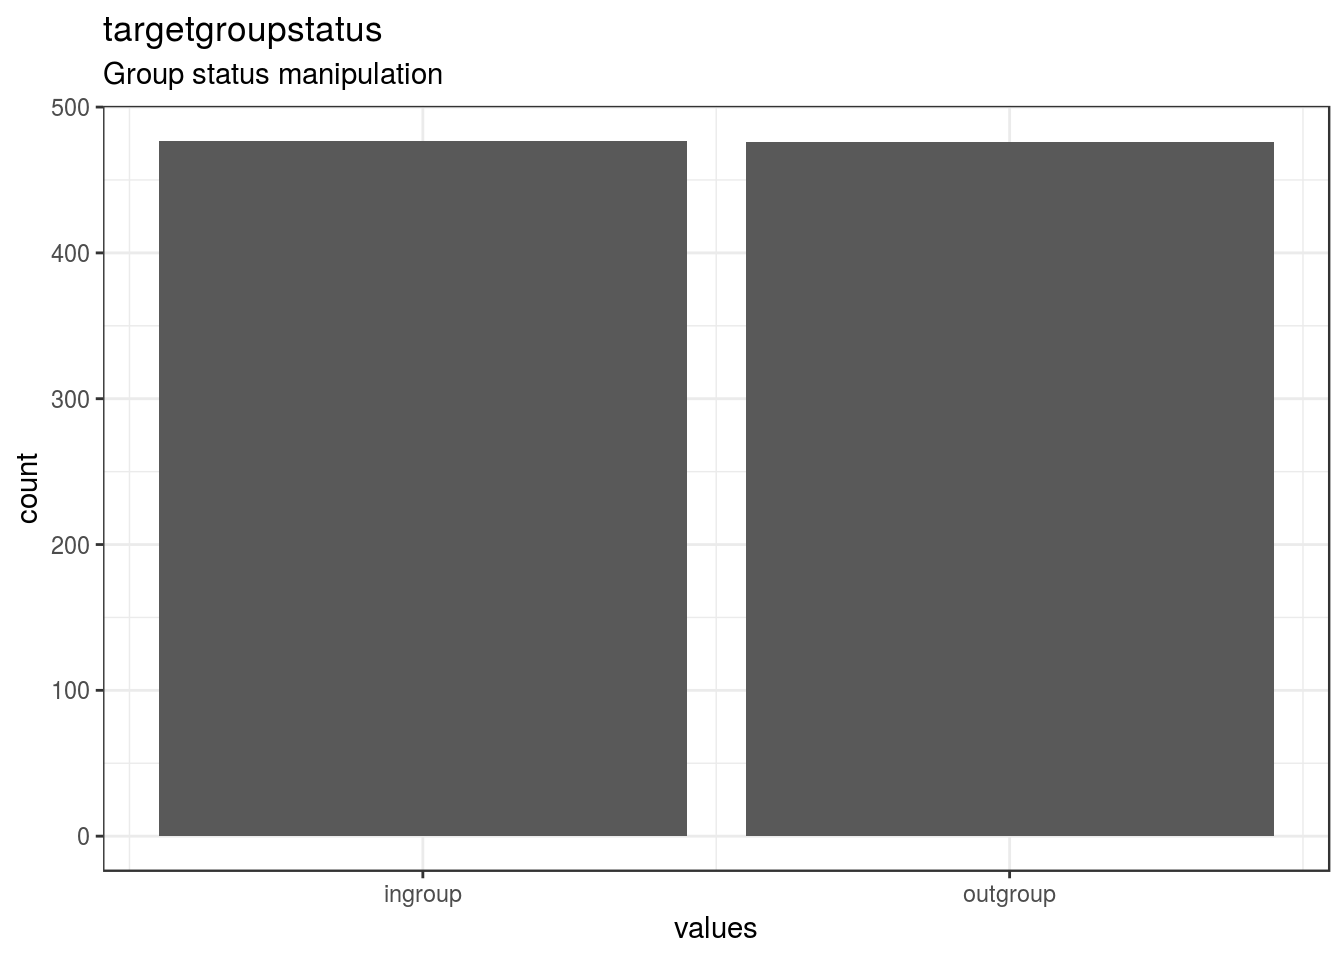
targetgroupstatus
Group status manipulation
Distribution
show_missing_values <- FALSE
if (has_labels(item)) {
  missing_values <- item[is.na(haven::zap_missing(item))]
  attributes(missing_values) <- attributes(item)
  if (!is.null(attributes(item)$labels)) {
    attributes(missing_values)$labels <- attributes(missing_values)$labels[is.na(attributes(missing_values)$labels)]
    attributes(item)$labels <- attributes(item)$labels[!is.na(attributes(item)$labels)]
  }
  if (is.double(item)) {
    show_missing_values <- length(unique(haven::na_tag(missing_values))) > 1
    item <- haven::zap_missing(item)
  }
  if (length(item_attributes$labels) == 0 && is.numeric(item)) {
    item <- haven::zap_labels(item)
  }
}
item_nomiss <- item[!is.na(item)]

# unnest mc_multiple and so on
if (
  is.character(item_nomiss) &&
  stringr::str_detect(item_nomiss, stringr::fixed(", ")) &&
  (exists("type", item_info) &&
    stringr::str_detect(item_info$type, pattern = stringr::fixed("multiple")))
  ) {
  item_nomiss <- unlist(stringr::str_split(item_nomiss, pattern = stringr::fixed(", ")))
}
attributes(item_nomiss) <- attributes(item)

old_height <- knitr::opts_chunk$get("fig.height")
non_missing_choices <- item_attributes[["labels"]]
many_labels <- length(non_missing_choices) > 7
go_vertical <- !is.numeric(item_nomiss) || many_labels
if ( go_vertical ) {
  # numeric items are plotted horizontally (because that's what usually expected)
  # categorical items are plotted vertically because we can use the screen real estate better this way

    if (is.null(choices) ||
        dplyr::n_distinct(item_nomiss) > length(non_missing_choices)) {
        non_missing_choices <- unique(item_nomiss)
        names(non_missing_choices) <- non_missing_choices
    }
  choice_multiplier <- old_height/6.5
    new_height <- 2 + choice_multiplier * length(non_missing_choices)
    new_height <- ifelse(new_height > 20, 20, new_height)
    new_height <- ifelse(new_height < 1, 1, new_height)
    knitr::opts_chunk$set(fig.height = new_height)
}

wrap_at <- knitr::opts_chunk$get("fig.width") * 10
# todo: if there are free-text choices mingled in with the pre-defined ones, don't show
# todo: show rare items if they are pre-defined
# todo: bin rare responses into "other category"
if (!length(item_nomiss)) {
cat("No non-missing values to show.")
} else if (is.numeric(item_nomiss) || dplyr::n_distinct(item_nomiss) < 20) {
plot_labelled(item_nomiss, item_name, wrap_at, go_vertical)
} else {
cat(dplyr::n_distinct(item_nomiss), " unique, categorical values, so not shown.")
}
knitr::opts_chunk$set(fig.height = old_height)1053 missing values.
Summary statistics
attributes(item) <- item_attributes
df = data.frame(item, stringsAsFactors = FALSE)
names(df) = html_item_name
escaped_table(codebook_table(df))| name | label | data_type | value_labels | missing | complete | n | mean | sd | p0 | p25 | p50 | p75 | p100 | hist | format.spss |
|---|---|---|---|---|---|---|---|---|---|---|---|---|---|---|---|
| targetgroupstatus | Group status manipulation | numeric | 0. ingroup, 1. outgroup |
1053 | 953 | 2006 | 0.5 | 0.5 | 0 | 0 | 0 | 1 | 1 | ▇▁▁▁▁▁▁▇ | F8.0 |
if (show_missing_values) {
  plot_labelled(missing_values, item_name, wrap_at)
}
if (!is.null(item_info)) {
# don't show choices again, if they're basically same thing as value labels
if (!is.null(choices) && !is.null(item_info$choices) &&
all(names(na.omit(choices)) == item_info$choices) &&
all(na.omit(choices) == names(item_info$choices))) {
item_info$choices <- NULL
}
item_info$label_parsed <-
item_info$choice_list <- item_info$study_id <- item_info$id <- NULL
pander::pander(item_info)
}Value labels
if (!is.null(choices) && length(choices) && length(choices) < 30) {
    pander::pander(as.list(choices))
}- ingroup: 0
- outgroup: 1
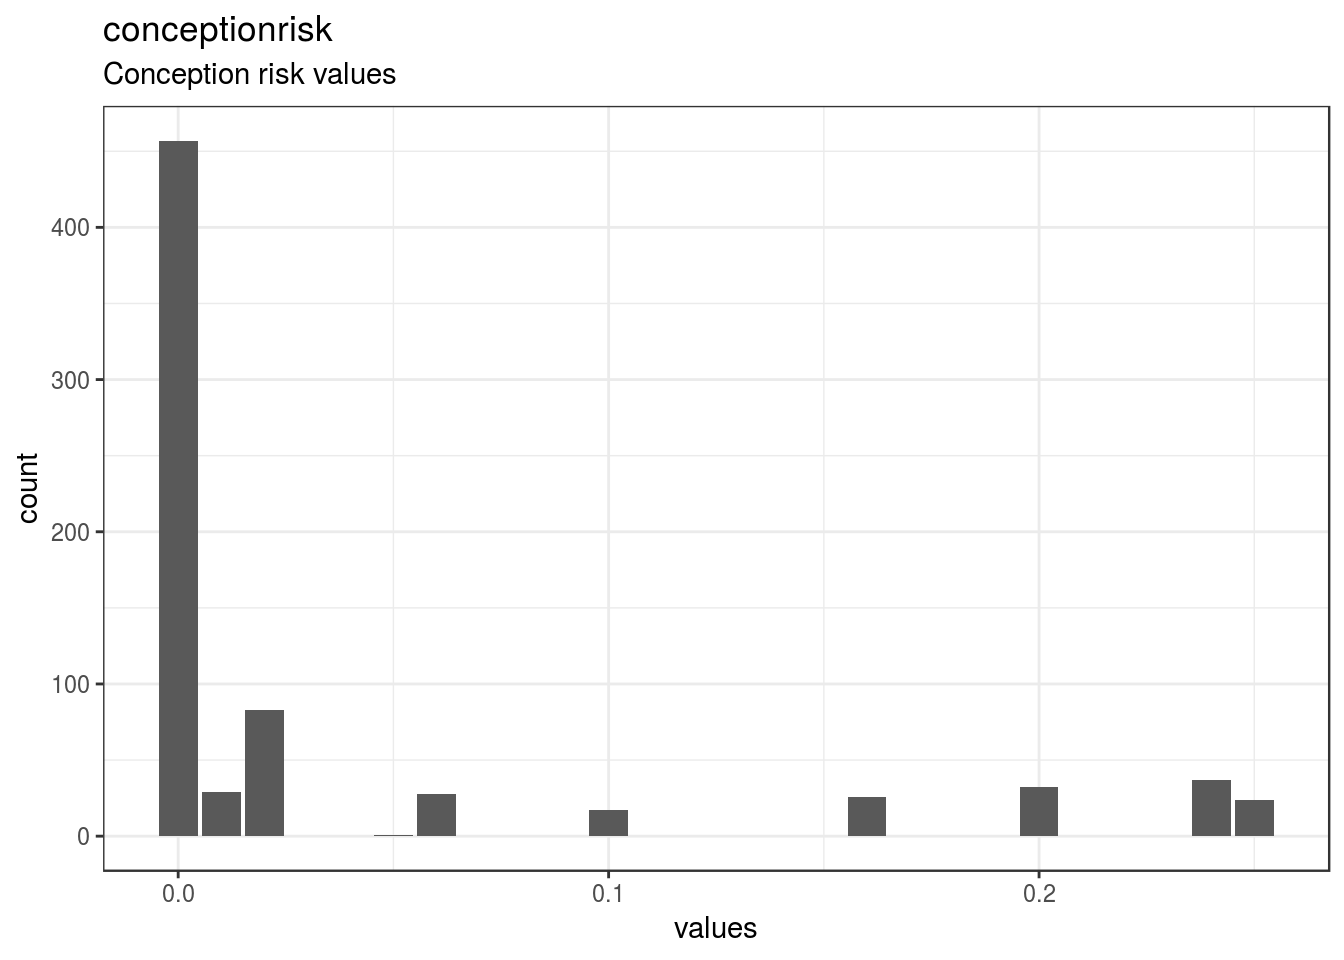
conceptionrisk
Conception risk values
Distribution
show_missing_values <- FALSE
if (has_labels(item)) {
  missing_values <- item[is.na(haven::zap_missing(item))]
  attributes(missing_values) <- attributes(item)
  if (!is.null(attributes(item)$labels)) {
    attributes(missing_values)$labels <- attributes(missing_values)$labels[is.na(attributes(missing_values)$labels)]
    attributes(item)$labels <- attributes(item)$labels[!is.na(attributes(item)$labels)]
  }
  if (is.double(item)) {
    show_missing_values <- length(unique(haven::na_tag(missing_values))) > 1
    item <- haven::zap_missing(item)
  }
  if (length(item_attributes$labels) == 0 && is.numeric(item)) {
    item <- haven::zap_labels(item)
  }
}
item_nomiss <- item[!is.na(item)]

# unnest mc_multiple and so on
if (
  is.character(item_nomiss) &&
  stringr::str_detect(item_nomiss, stringr::fixed(", ")) &&
  (exists("type", item_info) &&
    stringr::str_detect(item_info$type, pattern = stringr::fixed("multiple")))
  ) {
  item_nomiss <- unlist(stringr::str_split(item_nomiss, pattern = stringr::fixed(", ")))
}
attributes(item_nomiss) <- attributes(item)

old_height <- knitr::opts_chunk$get("fig.height")
non_missing_choices <- item_attributes[["labels"]]
many_labels <- length(non_missing_choices) > 7
go_vertical <- !is.numeric(item_nomiss) || many_labels
if ( go_vertical ) {
  # numeric items are plotted horizontally (because that's what usually expected)
  # categorical items are plotted vertically because we can use the screen real estate better this way

    if (is.null(choices) ||
        dplyr::n_distinct(item_nomiss) > length(non_missing_choices)) {
        non_missing_choices <- unique(item_nomiss)
        names(non_missing_choices) <- non_missing_choices
    }
  choice_multiplier <- old_height/6.5
    new_height <- 2 + choice_multiplier * length(non_missing_choices)
    new_height <- ifelse(new_height > 20, 20, new_height)
    new_height <- ifelse(new_height < 1, 1, new_height)
    knitr::opts_chunk$set(fig.height = new_height)
}

wrap_at <- knitr::opts_chunk$get("fig.width") * 10
# todo: if there are free-text choices mingled in with the pre-defined ones, don't show
# todo: show rare items if they are pre-defined
# todo: bin rare responses into "other category"
if (!length(item_nomiss)) {
cat("No non-missing values to show.")
} else if (is.numeric(item_nomiss) || dplyr::n_distinct(item_nomiss) < 20) {
plot_labelled(item_nomiss, item_name, wrap_at, go_vertical)
} else {
cat(dplyr::n_distinct(item_nomiss), " unique, categorical values, so not shown.")
}
knitr::opts_chunk$set(fig.height = old_height)1272 missing values.
Summary statistics
attributes(item) <- item_attributes
df = data.frame(item, stringsAsFactors = FALSE)
names(df) = html_item_name
escaped_table(codebook_table(df))| name | label | data_type | missing | complete | n | mean | sd | p0 | p25 | p50 | p75 | p100 | hist | format.spss |
|---|---|---|---|---|---|---|---|---|---|---|---|---|---|---|
| conceptionrisk | Conception risk values | numeric | 1272 | 734 | 2006 | 0.042 | 0.079 | 0 | 0 | 0 | 0.02 | 0.25 | ▇▁▁▁▁▁▁▁ | F8.0 |
if (show_missing_values) {
  plot_labelled(missing_values, item_name, wrap_at)
}
if (!is.null(item_info)) {
# don't show choices again, if they're basically same thing as value labels
if (!is.null(choices) && !is.null(item_info$choices) &&
all(names(na.omit(choices)) == item_info$choices) &&
all(na.omit(choices) == names(item_info$choices))) {
item_info$choices <- NULL
}
item_info$label_parsed <-
item_info$choice_list <- item_info$study_id <- item_info$id <- NULL
pander::pander(item_info)
}if (!is.null(choices) && length(choices) && length(choices) < 30) {
pander::pander(as.list(choices))
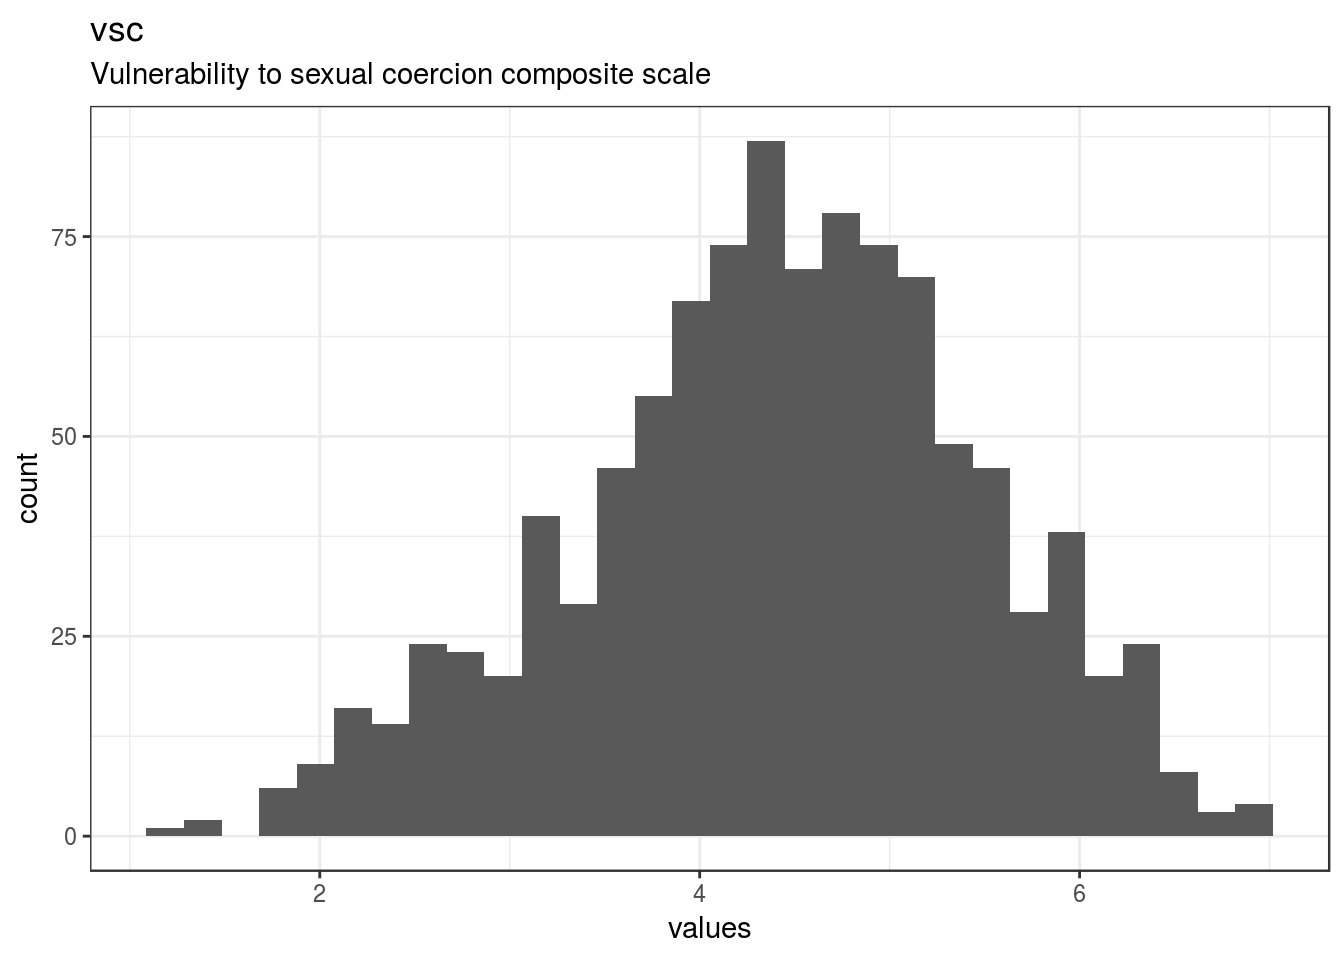
}vsc
Vulnerability to sexual coercion composite scale
Distribution
show_missing_values <- FALSE
if (has_labels(item)) {
missing_values <- item[is.na(haven::zap_missing(item))]
attributes(missing_values) <- attributes(item)
if (!is.null(attributes(item)$labels)) {
attributes(missing_values)$labels <- attributes(missing_values)$labels[is.na(attributes(missing_values)$labels)]
attributes(item)$labels <- attributes(item)$labels[!is.na(attributes(item)$labels)]
}
if (is.double(item)) {
show_missing_values <- length(unique(haven::na_tag(missing_values))) > 1
item <- haven::zap_missing(item)
}
if (length(item_attributes$labels) == 0 && is.numeric(item)) {
item <- haven::zap_labels(item)
}
}
item_nomiss <- item[!is.na(item)]
# unnest mc_multiple and so on
if (
is.character(item_nomiss) &&
stringr::str_detect(item_nomiss, stringr::fixed(", ")) &&
(exists("type", item_info) &&
stringr::str_detect(item_info$type, pattern = stringr::fixed("multiple")))
) {
item_nomiss <- unlist(stringr::str_split(item_nomiss, pattern = stringr::fixed(", ")))
}
attributes(item_nomiss) <- attributes(item)
old_height <- knitr::opts_chunk$get("fig.height")
non_missing_choices <- item_attributes[["labels"]]
many_labels <- length(non_missing_choices) > 7
go_vertical <- !is.numeric(item_nomiss) || many_labels
if ( go_vertical ) {
# numeric items are plotted horizontally (because that's what usually expected)
# categorical items are plotted vertically because we can use the screen real estate better this way
if (is.null(choices) ||
dplyr::n_distinct(item_nomiss) > length(non_missing_choices)) {
non_missing_choices <- unique(item_nomiss)
names(non_missing_choices) <- non_missing_choices
}
choice_multiplier <- old_height/6.5
new_height <- 2 + choice_multiplier * length(non_missing_choices)
new_height <- ifelse(new_height > 20, 20, new_height)
new_height <- ifelse(new_height < 1, 1, new_height)
knitr::opts_chunk$set(fig.height = new_height)
}
wrap_at <- knitr::opts_chunk$get("fig.width") * 10# todo: if there are free-text choices mingled in with the pre-defined ones, don't show
# todo: show rare items if they are pre-defined
# todo: bin rare responses into "other category"
if (!length(item_nomiss)) {
cat("No non-missing values to show.")
} else if (is.numeric(item_nomiss) || dplyr::n_distinct(item_nomiss) < 20) {
plot_labelled(item_nomiss, item_name, wrap_at, go_vertical)
} else {
cat(dplyr::n_distinct(item_nomiss), " unique, categorical values, so not shown.")
}
knitr::opts_chunk$set(fig.height = old_height)980 missing values.
Summary statistics
attributes(item) <- item_attributes
df = data.frame(item, stringsAsFactors = FALSE)
names(df) = html_item_name
escaped_table(codebook_table(df))| name | label | data_type | missing | complete | n | mean | sd | p0 | p25 | p50 | p75 | p100 | hist | format.spss | display_width |
|---|---|---|---|---|---|---|---|---|---|---|---|---|---|---|---|
| vsc | Vulnerability to sexual coercion composite scale | numeric | 980 | 1026 | 2006 | 4.41 | 1.06 | 1.27 | 3.74 | 4.44 | 5.17 | 7 | ▁▂▃▆▇▆▃▁ | F8.2 | 10 |
if (show_missing_values) {
plot_labelled(missing_values, item_name, wrap_at)
}if (!is.null(item_info)) {
# don't show choices again, if they're basically same thing as value labels
if (!is.null(choices) && !is.null(item_info$choices) &&
all(names(na.omit(choices)) == item_info$choices) &&
all(na.omit(choices) == names(item_info$choices))) {
item_info$choices <- NULL
}
item_info$label_parsed <-
item_info$choice_list <- item_info$study_id <- item_info$id <- NULL
pander::pander(item_info)
}if (!is.null(choices) && length(choices) && length(choices) < 30) {
pander::pander(as.list(choices))
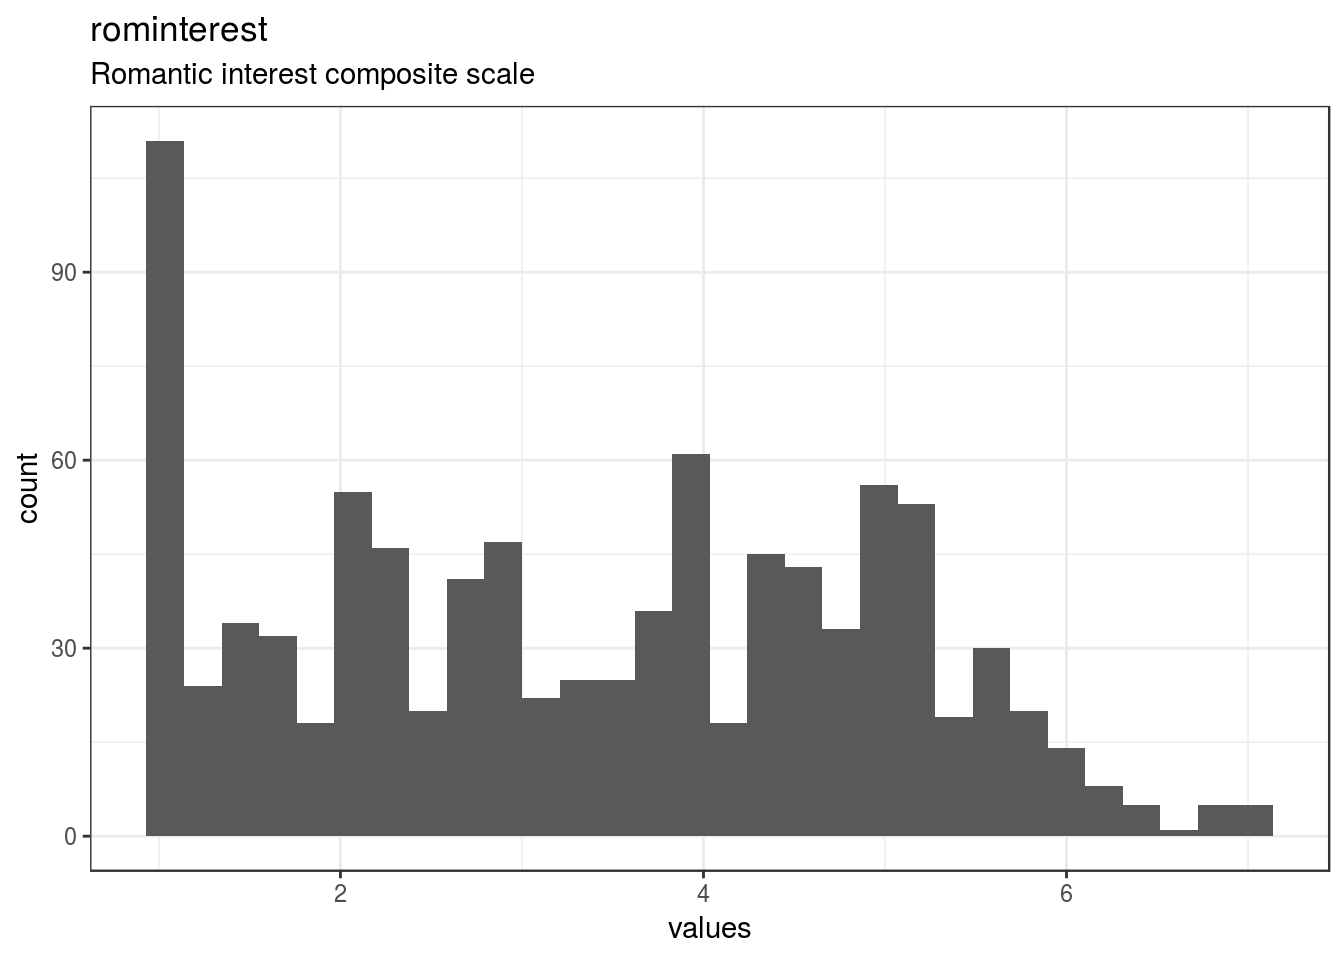
}rominterest
Romantic interest composite scale
Distribution
show_missing_values <- FALSE
if (has_labels(item)) {
missing_values <- item[is.na(haven::zap_missing(item))]
attributes(missing_values) <- attributes(item)
if (!is.null(attributes(item)$labels)) {
attributes(missing_values)$labels <- attributes(missing_values)$labels[is.na(attributes(missing_values)$labels)]
attributes(item)$labels <- attributes(item)$labels[!is.na(attributes(item)$labels)]
}
if (is.double(item)) {
show_missing_values <- length(unique(haven::na_tag(missing_values))) > 1
item <- haven::zap_missing(item)
}
if (length(item_attributes$labels) == 0 && is.numeric(item)) {
item <- haven::zap_labels(item)
}
}
item_nomiss <- item[!is.na(item)]
# unnest mc_multiple and so on
if (
is.character(item_nomiss) &&
stringr::str_detect(item_nomiss, stringr::fixed(", ")) &&
(exists("type", item_info) &&
stringr::str_detect(item_info$type, pattern = stringr::fixed("multiple")))
) {
item_nomiss <- unlist(stringr::str_split(item_nomiss, pattern = stringr::fixed(", ")))
}
attributes(item_nomiss) <- attributes(item)
old_height <- knitr::opts_chunk$get("fig.height")
non_missing_choices <- item_attributes[["labels"]]
many_labels <- length(non_missing_choices) > 7
go_vertical <- !is.numeric(item_nomiss) || many_labels
if ( go_vertical ) {
# numeric items are plotted horizontally (because that's what usually expected)
# categorical items are plotted vertically because we can use the screen real estate better this way
if (is.null(choices) ||
dplyr::n_distinct(item_nomiss) > length(non_missing_choices)) {
non_missing_choices <- unique(item_nomiss)
names(non_missing_choices) <- non_missing_choices
}
choice_multiplier <- old_height/6.5
new_height <- 2 + choice_multiplier * length(non_missing_choices)
new_height <- ifelse(new_height > 20, 20, new_height)
new_height <- ifelse(new_height < 1, 1, new_height)
knitr::opts_chunk$set(fig.height = new_height)
}
wrap_at <- knitr::opts_chunk$get("fig.width") * 10# todo: if there are free-text choices mingled in with the pre-defined ones, don't show
# todo: show rare items if they are pre-defined
# todo: bin rare responses into "other category"
if (!length(item_nomiss)) {
cat("No non-missing values to show.")
} else if (is.numeric(item_nomiss) || dplyr::n_distinct(item_nomiss) < 20) {
plot_labelled(item_nomiss, item_name, wrap_at, go_vertical)
} else {
cat(dplyr::n_distinct(item_nomiss), " unique, categorical values, so not shown.")
}
knitr::opts_chunk$set(fig.height = old_height)1054 missing values.
Summary statistics
attributes(item) <- item_attributes
df = data.frame(item, stringsAsFactors = FALSE)
names(df) = html_item_name
escaped_table(codebook_table(df))| name | label | data_type | missing | complete | n | mean | sd | p0 | p25 | p50 | p75 | p100 | hist | format.spss | display_width |
|---|---|---|---|---|---|---|---|---|---|---|---|---|---|---|---|
| rominterest | Romantic interest composite scale | numeric | 1054 | 952 | 2006 | 3.37 | 1.58 | 1 | 2 | 3.5 | 4.75 | 7 | ▇▆▅▅▆▆▂▁ | F8.2 | 13 |
if (show_missing_values) {
plot_labelled(missing_values, item_name, wrap_at)
}if (!is.null(item_info)) {
# don't show choices again, if they're basically same thing as value labels
if (!is.null(choices) && !is.null(item_info$choices) &&
all(names(na.omit(choices)) == item_info$choices) &&
all(na.omit(choices) == names(item_info$choices))) {
item_info$choices <- NULL
}
item_info$label_parsed <-
item_info$choice_list <- item_info$study_id <- item_info$id <- NULL
pander::pander(item_info)
}if (!is.null(choices) && length(choices) && length(choices) < 30) {
pander::pander(as.list(choices))
}Scale: matevalue
Overview
Reliability: Cronbach’s α [95% CI] = 0.91 [0.9;0.91].
Missing: 1048.
old_height <- knitr::opts_chunk$get("fig.height")
new_height <- length(scale_info$scale_item_names)
new_height <- ifelse(new_height > 20, 20, new_height)
new_height <- ifelse(new_height < 1, 1, new_height)
new_height <- ifelse(is.na(new_height) | is.nan(new_height),
old_height, new_height)
knitr::opts_chunk$set(fig.height = new_height)likert_plot <- likert_from_items(items)
if (!is.null(likert_plot)) {
graphics::plot(likert_plot)
}
knitr::opts_chunk$set(fig.height = old_height)binwidth <- mean(diff(sort(unique(scale))))
wrap_at <- knitr::opts_chunk$get("fig.width") * 10dist_plot <- plot_labelled(scale, scale_name, wrap_at)
choices <- attributes(items[[1]])$item$choices
breaks <- as.numeric(names(choices))
if (length(breaks)) {
suppressMessages( # ignore message about overwriting x axis
dist_plot <- dist_plot +
ggplot2::scale_x_continuous("values",
breaks = breaks,
labels = stringr::str_wrap(unlist(choices), ceiling(wrap_at * 0.21))) +
ggplot2::expand_limits(x = range(breaks)))
}
dist_plot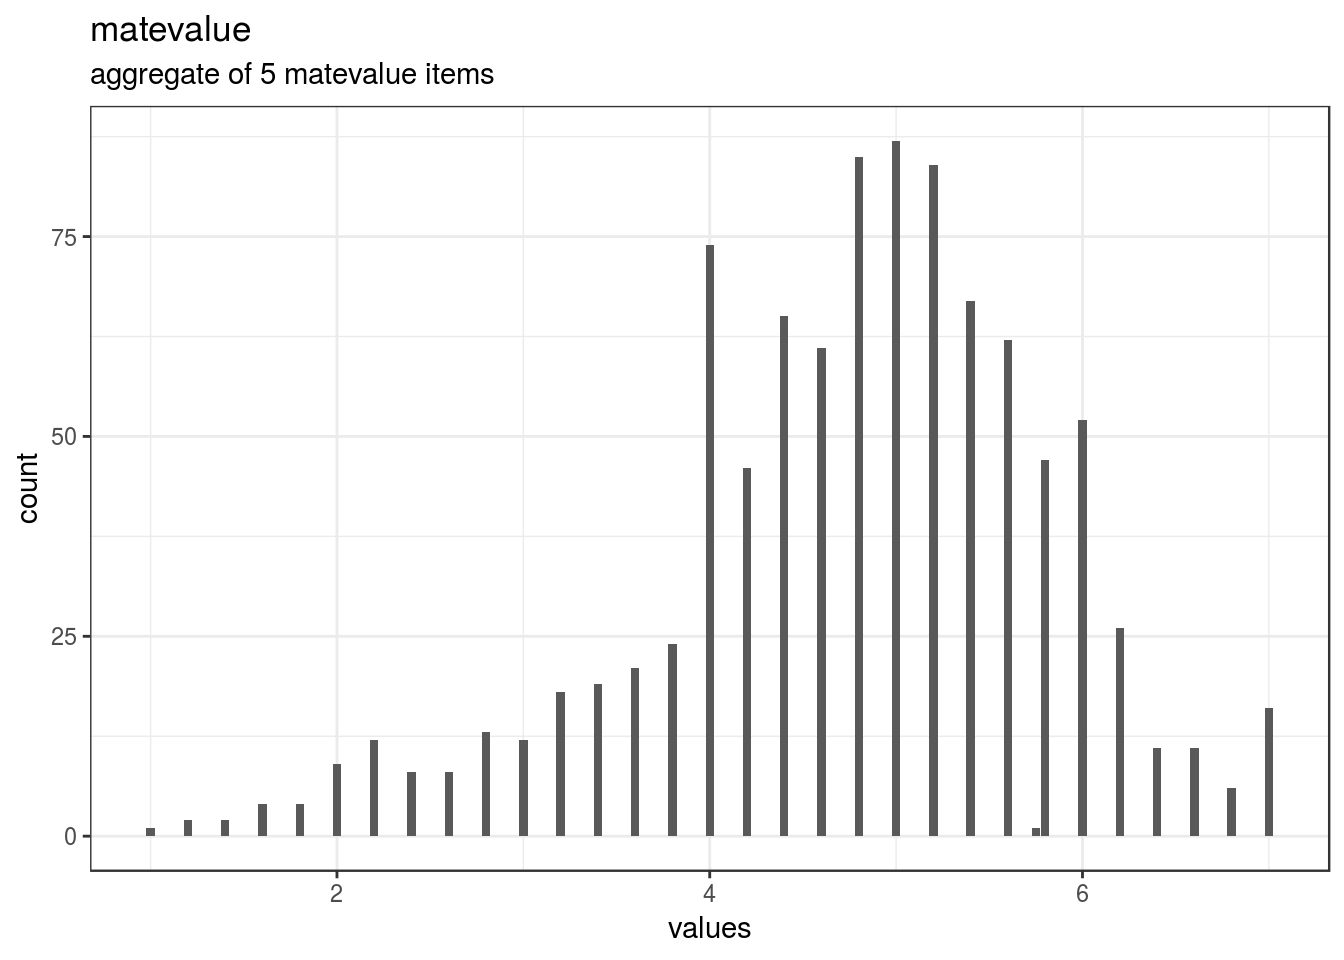
Reliability details
for (i in seq_along(reliabilities)) {
rel <- reliabilities[[i]]
cat(knitr::knit_print(rel, indent = paste0(indent, "####")))
}Reliability
95% Confidence Interval
if (!is.null(x$total$ase)) {
pander::pander(data.frame(lower = x$total$raw_alpha - 1.96 * x$total$ase,
estimate = x$total$raw_alpha,
upper = x$total$raw_alpha + 1.96 *
x$total$ase))
}| lower | estimate | upper |
|---|---|---|
| 0.9002 | 0.9066 | 0.9131 |
pander::pander(x$total)| raw_alpha | std.alpha | G6(smc) | average_r | S/N | ase | mean | sd | median_r |
|---|---|---|---|---|---|---|---|---|
| 0.9066 | 0.9073 | 0.8904 | 0.6619 | 9.79 | 0.003306 | 4.757 | 1.072 | 0.6547 |
Reliability if an item is dropped:
rownames(x$alpha.drop) <- recursive_escape(rownames(x$alpha.drop))
pander::pander(x$alpha.drop)| raw_alpha | std.alpha | G6(smc) | average_r | S/N | alpha se | var.r | med.r | |
|---|---|---|---|---|---|---|---|---|
| matevalue1 | 0.8826 | 0.8833 | 0.8524 | 0.6542 | 7.567 | 0.004291 | 0.001962 | 0.6532 |
| matevalue2 | 0.8847 | 0.8854 | 0.8545 | 0.6589 | 7.725 | 0.004204 | 0.001204 | 0.6516 |
| matevalue3 | 0.8794 | 0.8803 | 0.8509 | 0.6477 | 7.353 | 0.004412 | 0.002322 | 0.6402 |
| matevalue4 | 0.8973 | 0.898 | 0.872 | 0.6876 | 8.805 | 0.00375 | 0.001033 | 0.6832 |
| matevalue5 | 0.8856 | 0.8865 | 0.8586 | 0.6613 | 7.81 | 0.004193 | 0.002489 | 0.6653 |
Item statistics
rownames(x$item.stats) <- recursive_escape(rownames(x$item.stats))
pander::pander(x$item.stats)| n | raw.r | std.r | r.cor | r.drop | mean | sd | |
|---|---|---|---|---|---|---|---|
| matevalue1 | 958 | 0.8615 | 0.865 | 0.8247 | 0.7828 | 4.793 | 1.193 |
| matevalue2 | 958 | 0.8596 | 0.8585 | 0.8157 | 0.7711 | 4.742 | 1.29 |
| matevalue3 | 958 | 0.8722 | 0.8742 | 0.8369 | 0.7971 | 4.499 | 1.213 |
| matevalue4 | 957 | 0.8194 | 0.818 | 0.7462 | 0.7119 | 5.178 | 1.278 |
| matevalue5 | 958 | 0.8578 | 0.855 | 0.8064 | 0.7671 | 4.574 | 1.305 |
Non missing response frequency for each item
rownames(x$response.freq) <- recursive_escape(rownames(x$response.freq))
pander::pander(x$response.freq)| 1 | 2 | 3 | 4 | 5 | 6 | 7 | miss | |
|---|---|---|---|---|---|---|---|---|
| matevalue1 | 0.01148 | 0.03132 | 0.08246 | 0.2255 | 0.3852 | 0.2046 | 0.0595 | 0.5224 |
| matevalue2 | 0.02088 | 0.04175 | 0.08664 | 0.2077 | 0.3779 | 0.1983 | 0.06681 | 0.5224 |
| matevalue3 | 0.01461 | 0.06159 | 0.08351 | 0.3163 | 0.3267 | 0.1691 | 0.02818 | 0.5224 |
| matevalue4 | 0.01149 | 0.02508 | 0.04911 | 0.2006 | 0.2456 | 0.3386 | 0.1296 | 0.5229 |
| matevalue5 | 0.0261 | 0.05532 | 0.06889 | 0.3006 | 0.3205 | 0.1743 | 0.05428 | 0.5224 |
Summary statistics
for (i in seq_along(names(items))) {
attributes(items[[i]]) = recursive_escape(attributes(items[[i]]))
}
escaped_table(codebook_table(items))| name | label | data_type | missing | complete | n | mean | sd | p0 | p25 | p50 | p75 | p100 | hist | format.spss |
|---|---|---|---|---|---|---|---|---|---|---|---|---|---|---|
| matevalue1 | Overall, how would you rate your level of desirability as a partner on the following scale?-Your level of desirability as a partner | numeric | 1048 | 958 | 2006 | 4.79 | 1.19 | 1 | 4 | 5 | 6 | 7 | ▁▁▂▅▁▇▅▁ | F8.0 |
| matevalue2 | Overall, how would members of the opposite sex rate your level of desirability as a partner on th…-Opposite sex rating of your desirability as a partner | numeric | 1048 | 958 | 2006 | 4.74 | 1.29 | 1 | 4 | 5 | 6 | 7 | ▁▁▂▅▁▇▅▂ | F8.0 |
| matevalue3 | Overall, how would you believe you compare to other people in desirability as a partner on the fo…-Personal desirability comparison to other people | numeric | 1048 | 958 | 2006 | 4.5 | 1.21 | 1 | 4 | 5 | 5 | 7 | ▁▂▂▇▁▇▅▁ | F8.0 |
| matevalue4 | Overall, how good of a catch are you?-How good of a catch are you? | numeric | 1049 | 957 | 2006 | 5.18 | 1.28 | 1 | 4 | 5 | 6 | 7 | ▁▁▁▅▁▆▇▃ | F8.0 |
| matevalue5 | Overall, how physically attractive do you believe you are?-Personal physical attractiveness | numeric | 1048 | 958 | 2006 | 4.57 | 1.31 | 1 | 4 | 5 | 5 | 7 | ▁▂▂▇▁▇▅▂ | F8.0 |
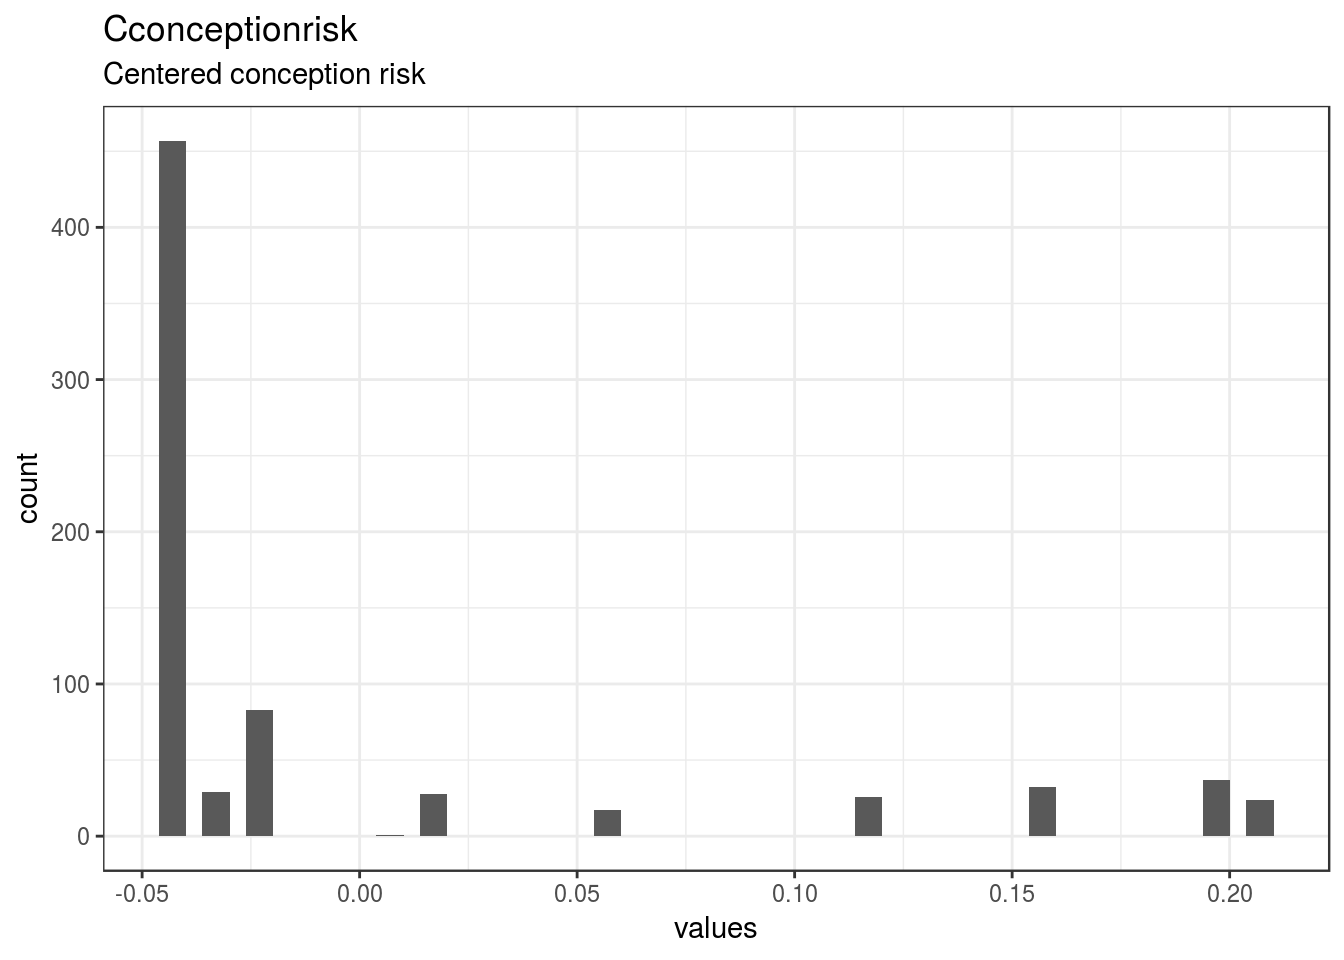
Cconceptionrisk
Centered conception risk
Distribution
show_missing_values <- FALSE
if (has_labels(item)) {
missing_values <- item[is.na(haven::zap_missing(item))]
attributes(missing_values) <- attributes(item)
if (!is.null(attributes(item)$labels)) {
attributes(missing_values)$labels <- attributes(missing_values)$labels[is.na(attributes(missing_values)$labels)]
attributes(item)$labels <- attributes(item)$labels[!is.na(attributes(item)$labels)]
}
if (is.double(item)) {
show_missing_values <- length(unique(haven::na_tag(missing_values))) > 1
item <- haven::zap_missing(item)
}
if (length(item_attributes$labels) == 0 && is.numeric(item)) {
item <- haven::zap_labels(item)
}
}
item_nomiss <- item[!is.na(item)]
# unnest mc_multiple and so on
if (
is.character(item_nomiss) &&
stringr::str_detect(item_nomiss, stringr::fixed(", ")) &&
(exists("type", item_info) &&
stringr::str_detect(item_info$type, pattern = stringr::fixed("multiple")))
) {
item_nomiss <- unlist(stringr::str_split(item_nomiss, pattern = stringr::fixed(", ")))
}
attributes(item_nomiss) <- attributes(item)
old_height <- knitr::opts_chunk$get("fig.height")
non_missing_choices <- item_attributes[["labels"]]
many_labels <- length(non_missing_choices) > 7
go_vertical <- !is.numeric(item_nomiss) || many_labels
if ( go_vertical ) {
# numeric items are plotted horizontally (because that's what usually expected)
# categorical items are plotted vertically because we can use the screen real estate better this way
if (is.null(choices) ||
dplyr::n_distinct(item_nomiss) > length(non_missing_choices)) {
non_missing_choices <- unique(item_nomiss)
names(non_missing_choices) <- non_missing_choices
}
choice_multiplier <- old_height/6.5
new_height <- 2 + choice_multiplier * length(non_missing_choices)
new_height <- ifelse(new_height > 20, 20, new_height)
new_height <- ifelse(new_height < 1, 1, new_height)
knitr::opts_chunk$set(fig.height = new_height)
}
wrap_at <- knitr::opts_chunk$get("fig.width") * 10# todo: if there are free-text choices mingled in with the pre-defined ones, don't show
# todo: show rare items if they are pre-defined
# todo: bin rare responses into "other category"
if (!length(item_nomiss)) {
cat("No non-missing values to show.")
} else if (is.numeric(item_nomiss) || dplyr::n_distinct(item_nomiss) < 20) {
plot_labelled(item_nomiss, item_name, wrap_at, go_vertical)
} else {
cat(dplyr::n_distinct(item_nomiss), " unique, categorical values, so not shown.")
}
knitr::opts_chunk$set(fig.height = old_height)1272 missing values.
Summary statistics
attributes(item) <- item_attributes
df = data.frame(item, stringsAsFactors = FALSE)
names(df) = html_item_name
escaped_table(codebook_table(df))| name | label | data_type | missing | complete | n | mean | sd | p0 | p25 | p50 | p75 | p100 | hist | format.spss | display_width |
|---|---|---|---|---|---|---|---|---|---|---|---|---|---|---|---|
| Cconceptionrisk | Centered conception risk | numeric | 1272 | 734 | 2006 | -0.001 | 0.079 | -0.043 | -0.043 | -0.043 | -0.023 | 0.21 | ▇▁▁▁▁▁▁▁ | F8.2 | 17 |
if (show_missing_values) {
plot_labelled(missing_values, item_name, wrap_at)
}if (!is.null(item_info)) {
# don't show choices again, if they're basically same thing as value labels
if (!is.null(choices) && !is.null(item_info$choices) &&
all(names(na.omit(choices)) == item_info$choices) &&
all(na.omit(choices) == names(item_info$choices))) {
item_info$choices <- NULL
}
item_info$label_parsed <-
item_info$choice_list <- item_info$study_id <- item_info$id <- NULL
pander::pander(item_info)
}if (!is.null(choices) && length(choices) && length(choices) < 30) {
pander::pander(as.list(choices))
}Cvsc
Centered vsc
Distribution
show_missing_values <- FALSE
if (has_labels(item)) {
missing_values <- item[is.na(haven::zap_missing(item))]
attributes(missing_values) <- attributes(item)
if (!is.null(attributes(item)$labels)) {
attributes(missing_values)$labels <- attributes(missing_values)$labels[is.na(attributes(missing_values)$labels)]
attributes(item)$labels <- attributes(item)$labels[!is.na(attributes(item)$labels)]
}
if (is.double(item)) {
show_missing_values <- length(unique(haven::na_tag(missing_values))) > 1
item <- haven::zap_missing(item)
}
if (length(item_attributes$labels) == 0 && is.numeric(item)) {
item <- haven::zap_labels(item)
}
}
item_nomiss <- item[!is.na(item)]
# unnest mc_multiple and so on
if (
is.character(item_nomiss) &&
stringr::str_detect(item_nomiss, stringr::fixed(", ")) &&
(exists("type", item_info) &&
stringr::str_detect(item_info$type, pattern = stringr::fixed("multiple")))
) {
item_nomiss <- unlist(stringr::str_split(item_nomiss, pattern = stringr::fixed(", ")))
}
attributes(item_nomiss) <- attributes(item)
old_height <- knitr::opts_chunk$get("fig.height")
non_missing_choices <- item_attributes[["labels"]]
many_labels <- length(non_missing_choices) > 7
go_vertical <- !is.numeric(item_nomiss) || many_labels
if ( go_vertical ) {
# numeric items are plotted horizontally (because that's what usually expected)
# categorical items are plotted vertically because we can use the screen real estate better this way
if (is.null(choices) ||
dplyr::n_distinct(item_nomiss) > length(non_missing_choices)) {
non_missing_choices <- unique(item_nomiss)
names(non_missing_choices) <- non_missing_choices
}
choice_multiplier <- old_height/6.5
new_height <- 2 + choice_multiplier * length(non_missing_choices)
new_height <- ifelse(new_height > 20, 20, new_height)
new_height <- ifelse(new_height < 1, 1, new_height)
knitr::opts_chunk$set(fig.height = new_height)
}
wrap_at <- knitr::opts_chunk$get("fig.width") * 10# todo: if there are free-text choices mingled in with the pre-defined ones, don't show
# todo: show rare items if they are pre-defined
# todo: bin rare responses into "other category"
if (!length(item_nomiss)) {
cat("No non-missing values to show.")
} else if (is.numeric(item_nomiss) || dplyr::n_distinct(item_nomiss) < 20) {
plot_labelled(item_nomiss, item_name, wrap_at, go_vertical)
} else {
cat(dplyr::n_distinct(item_nomiss), " unique, categorical values, so not shown.")
}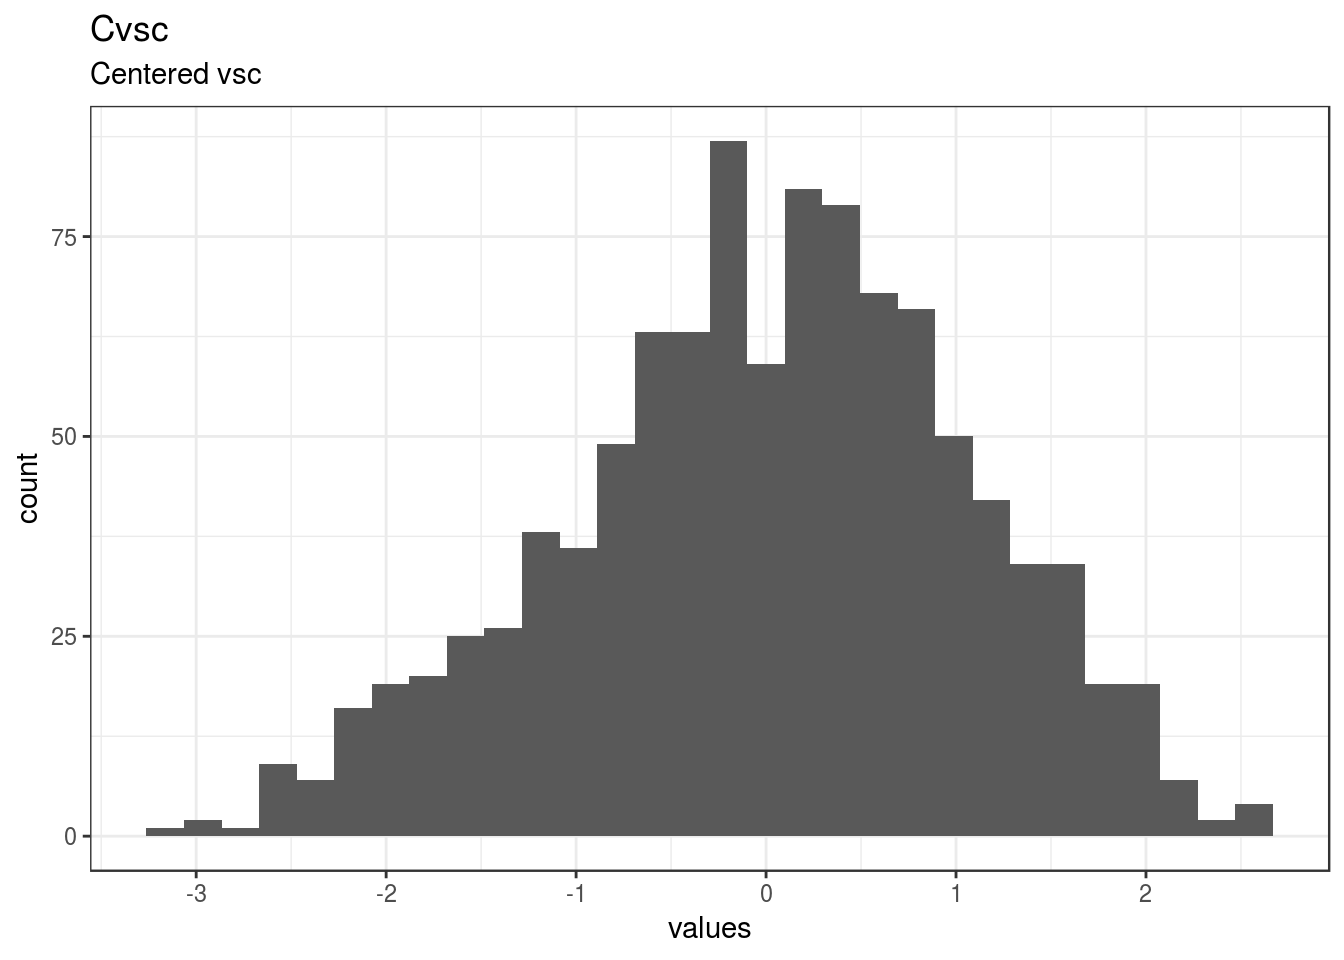
knitr::opts_chunk$set(fig.height = old_height)980 missing values.
Summary statistics
attributes(item) <- item_attributes
df = data.frame(item, stringsAsFactors = FALSE)
names(df) = html_item_name
escaped_table(codebook_table(df))| name | label | data_type | missing | complete | n | mean | sd | p0 | p25 | p50 | p75 | p100 | hist | format.spss | display_width |
|---|---|---|---|---|---|---|---|---|---|---|---|---|---|---|---|
| Cvsc | Centered vsc | numeric | 980 | 1026 | 2006 | 0.0094 | 1.06 | -3.13 | -0.66 | 0.041 | 0.77 | 2.6 | ▁▂▃▆▇▆▃▁ | F8.2 | 10 |
if (show_missing_values) {
plot_labelled(missing_values, item_name, wrap_at)
}if (!is.null(item_info)) {
# don't show choices again, if they're basically same thing as value labels
if (!is.null(choices) && !is.null(item_info$choices) &&
all(names(na.omit(choices)) == item_info$choices) &&
all(na.omit(choices) == names(item_info$choices))) {
item_info$choices <- NULL
}
item_info$label_parsed <-
item_info$choice_list <- item_info$study_id <- item_info$id <- NULL
pander::pander(item_info)
}if (!is.null(choices) && length(choices) && length(choices) < 30) {
pander::pander(as.list(choices))
}age
Participant age
Distribution
show_missing_values <- FALSE
if (has_labels(item)) {
missing_values <- item[is.na(haven::zap_missing(item))]
attributes(missing_values) <- attributes(item)
if (!is.null(attributes(item)$labels)) {
attributes(missing_values)$labels <- attributes(missing_values)$labels[is.na(attributes(missing_values)$labels)]
attributes(item)$labels <- attributes(item)$labels[!is.na(attributes(item)$labels)]
}
if (is.double(item)) {
show_missing_values <- length(unique(haven::na_tag(missing_values))) > 1
item <- haven::zap_missing(item)
}
if (length(item_attributes$labels) == 0 && is.numeric(item)) {
item <- haven::zap_labels(item)
}
}
item_nomiss <- item[!is.na(item)]
# unnest mc_multiple and so on
if (
is.character(item_nomiss) &&
stringr::str_detect(item_nomiss, stringr::fixed(", ")) &&
(exists("type", item_info) &&
stringr::str_detect(item_info$type, pattern = stringr::fixed("multiple")))
) {
item_nomiss <- unlist(stringr::str_split(item_nomiss, pattern = stringr::fixed(", ")))
}
attributes(item_nomiss) <- attributes(item)
old_height <- knitr::opts_chunk$get("fig.height")
non_missing_choices <- item_attributes[["labels"]]
many_labels <- length(non_missing_choices) > 7
go_vertical <- !is.numeric(item_nomiss) || many_labels
if ( go_vertical ) {
# numeric items are plotted horizontally (because that's what usually expected)
# categorical items are plotted vertically because we can use the screen real estate better this way
if (is.null(choices) ||
dplyr::n_distinct(item_nomiss) > length(non_missing_choices)) {
non_missing_choices <- unique(item_nomiss)
names(non_missing_choices) <- non_missing_choices
}
choice_multiplier <- old_height/6.5
new_height <- 2 + choice_multiplier * length(non_missing_choices)
new_height <- ifelse(new_height > 20, 20, new_height)
new_height <- ifelse(new_height < 1, 1, new_height)
knitr::opts_chunk$set(fig.height = new_height)
}
wrap_at <- knitr::opts_chunk$get("fig.width") * 10# todo: if there are free-text choices mingled in with the pre-defined ones, don't show
# todo: show rare items if they are pre-defined
# todo: bin rare responses into "other category"
if (!length(item_nomiss)) {
cat("No non-missing values to show.")
} else if (is.numeric(item_nomiss) || dplyr::n_distinct(item_nomiss) < 20) {
plot_labelled(item_nomiss, item_name, wrap_at, go_vertical)
} else {
cat(dplyr::n_distinct(item_nomiss), " unique, categorical values, so not shown.")
}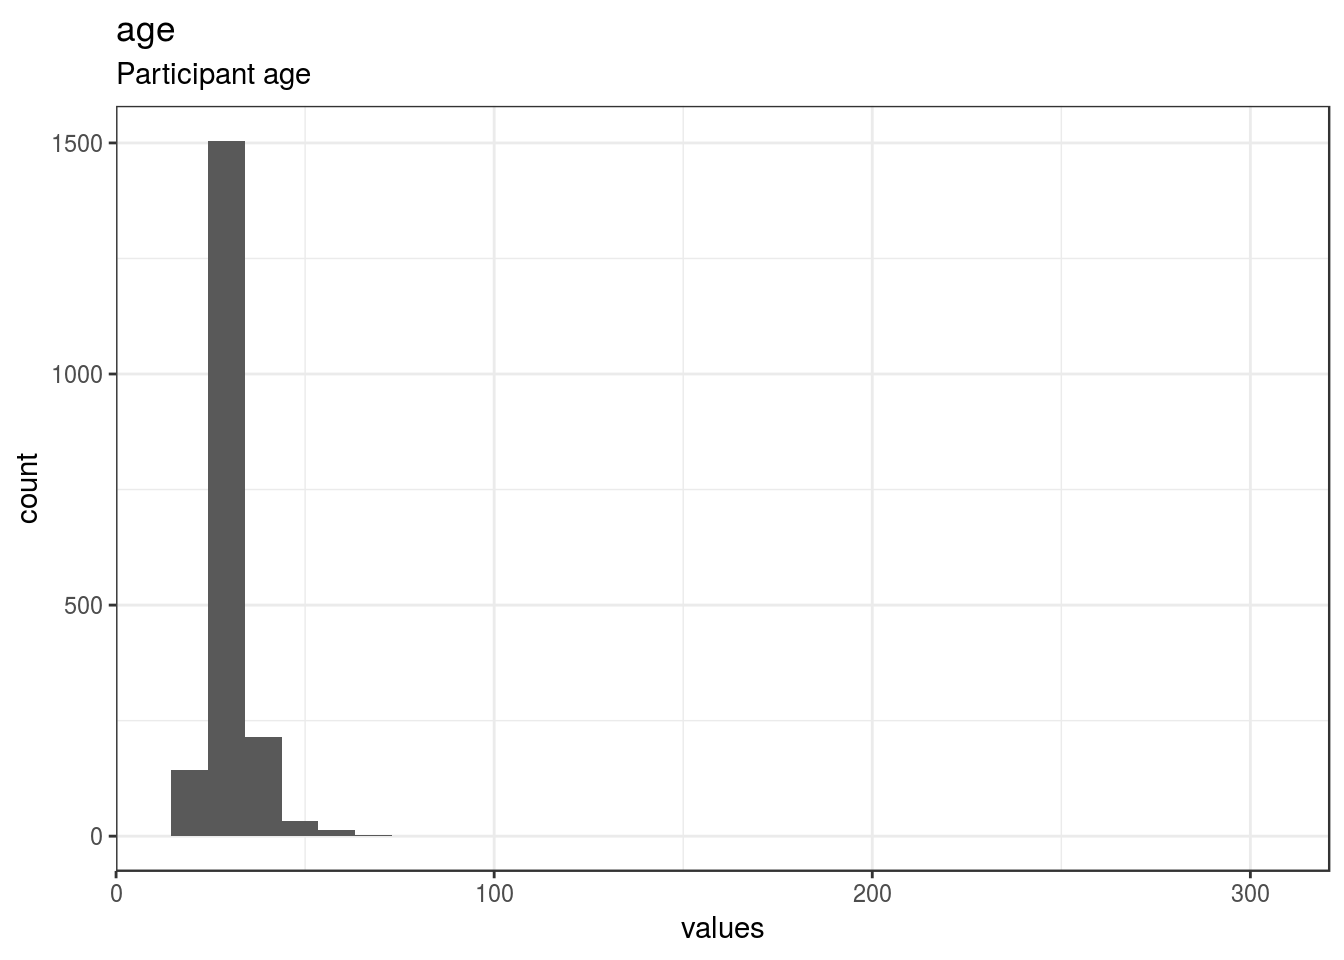
knitr::opts_chunk$set(fig.height = old_height)94 missing values.
Summary statistics
attributes(item) <- item_attributes
df = data.frame(item, stringsAsFactors = FALSE)
names(df) = html_item_name
escaped_table(codebook_table(df))| name | label | data_type | missing | complete | n | mean | sd | p0 | p25 | p50 | p75 | p100 | hist | format.spss |
|---|---|---|---|---|---|---|---|---|---|---|---|---|---|---|
| age | Participant age | numeric | 94 | 1912 | 2006 | 29.95 | 8.22 | 18 | 26 | 29 | 33 | 300 | ▇▁▁▁▁▁▁▁ | F8.0 |
if (show_missing_values) {
plot_labelled(missing_values, item_name, wrap_at)
}if (!is.null(item_info)) {
# don't show choices again, if they're basically same thing as value labels
if (!is.null(choices) && !is.null(item_info$choices) &&
all(names(na.omit(choices)) == item_info$choices) &&
all(na.omit(choices) == names(item_info$choices))) {
item_info$choices <- NULL
}
item_info$label_parsed <-
item_info$choice_list <- item_info$study_id <- item_info$id <- NULL
pander::pander(item_info)
}if (!is.null(choices) && length(choices) && length(choices) < 30) {
pander::pander(as.list(choices))
}gender
Participange gender
Distribution
show_missing_values <- FALSE
if (has_labels(item)) {
missing_values <- item[is.na(haven::zap_missing(item))]
attributes(missing_values) <- attributes(item)
if (!is.null(attributes(item)$labels)) {
attributes(missing_values)$labels <- attributes(missing_values)$labels[is.na(attributes(missing_values)$labels)]
attributes(item)$labels <- attributes(item)$labels[!is.na(attributes(item)$labels)]
}
if (is.double(item)) {
show_missing_values <- length(unique(haven::na_tag(missing_values))) > 1
item <- haven::zap_missing(item)
}
if (length(item_attributes$labels) == 0 && is.numeric(item)) {
item <- haven::zap_labels(item)
}
}
item_nomiss <- item[!is.na(item)]
# unnest mc_multiple and so on
if (
is.character(item_nomiss) &&
stringr::str_detect(item_nomiss, stringr::fixed(", ")) &&
(exists("type", item_info) &&
stringr::str_detect(item_info$type, pattern = stringr::fixed("multiple")))
) {
item_nomiss <- unlist(stringr::str_split(item_nomiss, pattern = stringr::fixed(", ")))
}
attributes(item_nomiss) <- attributes(item)
old_height <- knitr::opts_chunk$get("fig.height")
non_missing_choices <- item_attributes[["labels"]]
many_labels <- length(non_missing_choices) > 7
go_vertical <- !is.numeric(item_nomiss) || many_labels
if ( go_vertical ) {
# numeric items are plotted horizontally (because that's what usually expected)
# categorical items are plotted vertically because we can use the screen real estate better this way
if (is.null(choices) ||
dplyr::n_distinct(item_nomiss) > length(non_missing_choices)) {
non_missing_choices <- unique(item_nomiss)
names(non_missing_choices) <- non_missing_choices
}
choice_multiplier <- old_height/6.5
new_height <- 2 + choice_multiplier * length(non_missing_choices)
new_height <- ifelse(new_height > 20, 20, new_height)
new_height <- ifelse(new_height < 1, 1, new_height)
knitr::opts_chunk$set(fig.height = new_height)
}
wrap_at <- knitr::opts_chunk$get("fig.width") * 10# todo: if there are free-text choices mingled in with the pre-defined ones, don't show
# todo: show rare items if they are pre-defined
# todo: bin rare responses into "other category"
if (!length(item_nomiss)) {
cat("No non-missing values to show.")
} else if (is.numeric(item_nomiss) || dplyr::n_distinct(item_nomiss) < 20) {
plot_labelled(item_nomiss, item_name, wrap_at, go_vertical)
} else {
cat(dplyr::n_distinct(item_nomiss), " unique, categorical values, so not shown.")
}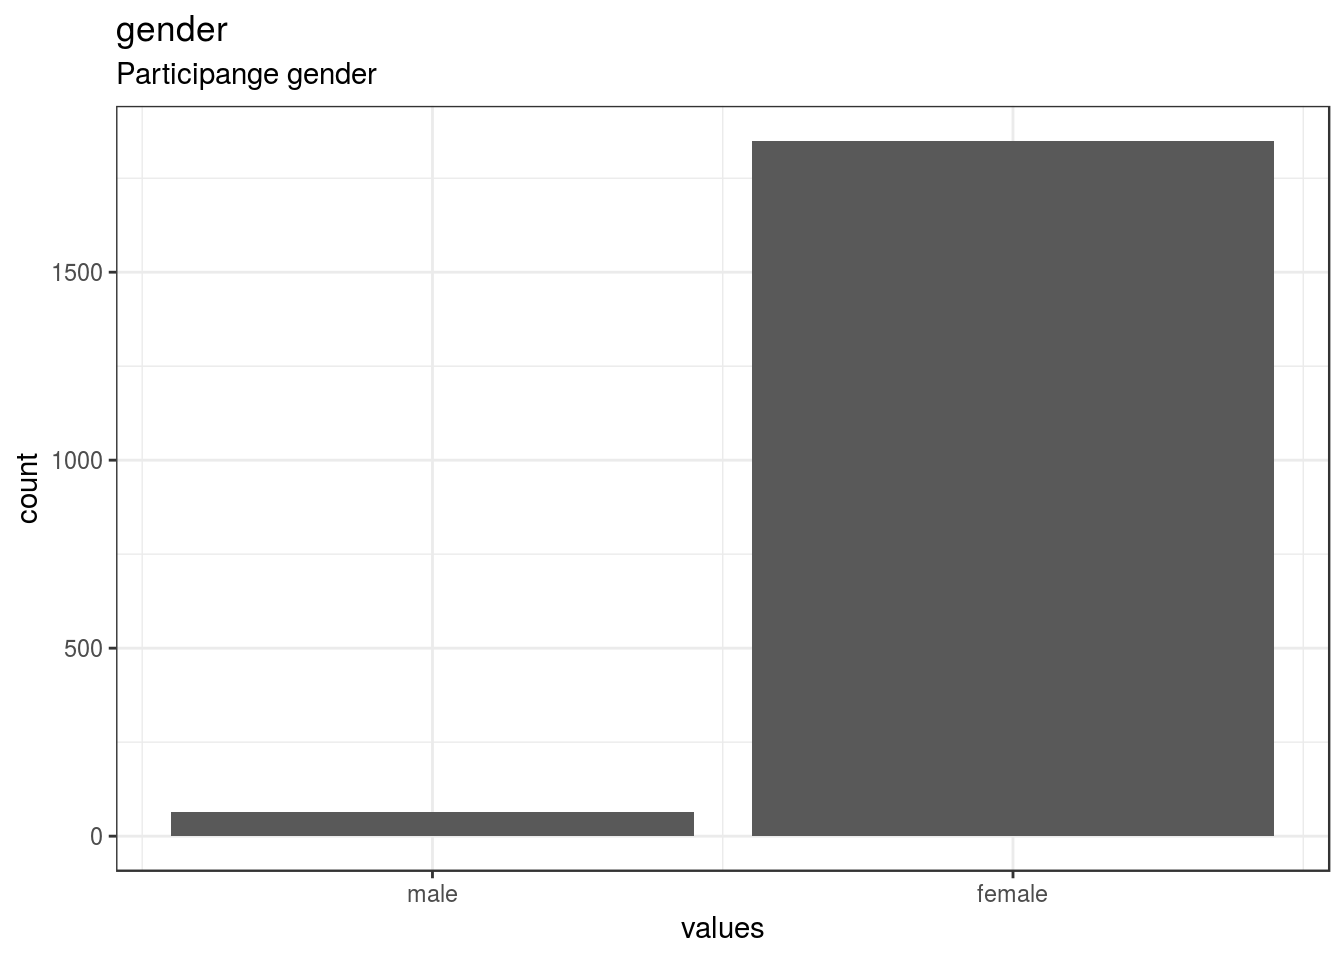
knitr::opts_chunk$set(fig.height = old_height)93 missing values.
Summary statistics
attributes(item) <- item_attributes
df = data.frame(item, stringsAsFactors = FALSE)
names(df) = html_item_name
escaped_table(codebook_table(df))| name | label | data_type | value_labels | missing | complete | n | mean | sd | p0 | p25 | p50 | p75 | p100 | hist | format.spss |
|---|---|---|---|---|---|---|---|---|---|---|---|---|---|---|---|
| gender | Participange gender | numeric | 1. male, 2. female |
93 | 1913 | 2006 | 1.97 | 0.18 | 1 | 2 | 2 | 2 | 2 | ▁▁▁▁▁▁▁▇ | F8.0 |
if (show_missing_values) {
plot_labelled(missing_values, item_name, wrap_at)
}if (!is.null(item_info)) {
# don't show choices again, if they're basically same thing as value labels
if (!is.null(choices) && !is.null(item_info$choices) &&
all(names(na.omit(choices)) == item_info$choices) &&
all(na.omit(choices) == names(item_info$choices))) {
item_info$choices <- NULL
}
item_info$label_parsed <-
item_info$choice_list <- item_info$study_id <- item_info$id <- NULL
pander::pander(item_info)
}Value labels
if (!is.null(choices) && length(choices) && length(choices) < 30) {
    pander::pander(as.list(choices))
}- male: 1
- female: 2
turkprimegender
Gender as indicated by Turkprime
Distribution
show_missing_values <- FALSE
if (has_labels(item)) {
  missing_values <- item[is.na(haven::zap_missing(item))]
  attributes(missing_values) <- attributes(item)
  if (!is.null(attributes(item)$labels)) {
    attributes(missing_values)$labels <- attributes(missing_values)$labels[is.na(attributes(missing_values)$labels)]
    attributes(item)$labels <- attributes(item)$labels[!is.na(attributes(item)$labels)]
  }
  if (is.double(item)) {
    show_missing_values <- length(unique(haven::na_tag(missing_values))) > 1
    item <- haven::zap_missing(item)
  }
  if (length(item_attributes$labels) == 0 && is.numeric(item)) {
    item <- haven::zap_labels(item)
  }
}
item_nomiss <- item[!is.na(item)]

# unnest mc_multiple and so on
if (
  is.character(item_nomiss) &&
  stringr::str_detect(item_nomiss, stringr::fixed(", ")) &&
  (exists("type", item_info) &&
    stringr::str_detect(item_info$type, pattern = stringr::fixed("multiple")))
  ) {
  item_nomiss <- unlist(stringr::str_split(item_nomiss, pattern = stringr::fixed(", ")))
}
attributes(item_nomiss) <- attributes(item)

old_height <- knitr::opts_chunk$get("fig.height")
non_missing_choices <- item_attributes[["labels"]]
many_labels <- length(non_missing_choices) > 7
go_vertical <- !is.numeric(item_nomiss) || many_labels
if ( go_vertical ) {
  # numeric items are plotted horizontally (because that's what usually expected)
  # categorical items are plotted vertically because we can use the screen real estate better this way

    if (is.null(choices) ||
        dplyr::n_distinct(item_nomiss) > length(non_missing_choices)) {
        non_missing_choices <- unique(item_nomiss)
        names(non_missing_choices) <- non_missing_choices
    }
  choice_multiplier <- old_height/6.5
    new_height <- 2 + choice_multiplier * length(non_missing_choices)
    new_height <- ifelse(new_height > 20, 20, new_height)
    new_height <- ifelse(new_height < 1, 1, new_height)
    knitr::opts_chunk$set(fig.height = new_height)
}

wrap_at <- knitr::opts_chunk$get("fig.width") * 10
# todo: if there are free-text choices mingled in with the pre-defined ones, don't show
# todo: show rare items if they are pre-defined
# todo: bin rare responses into "other category"
if (!length(item_nomiss)) {
cat("No non-missing values to show.")
} else if (is.numeric(item_nomiss) || dplyr::n_distinct(item_nomiss) < 20) {
plot_labelled(item_nomiss, item_name, wrap_at, go_vertical)
} else {
cat(dplyr::n_distinct(item_nomiss), " unique, categorical values, so not shown.")
}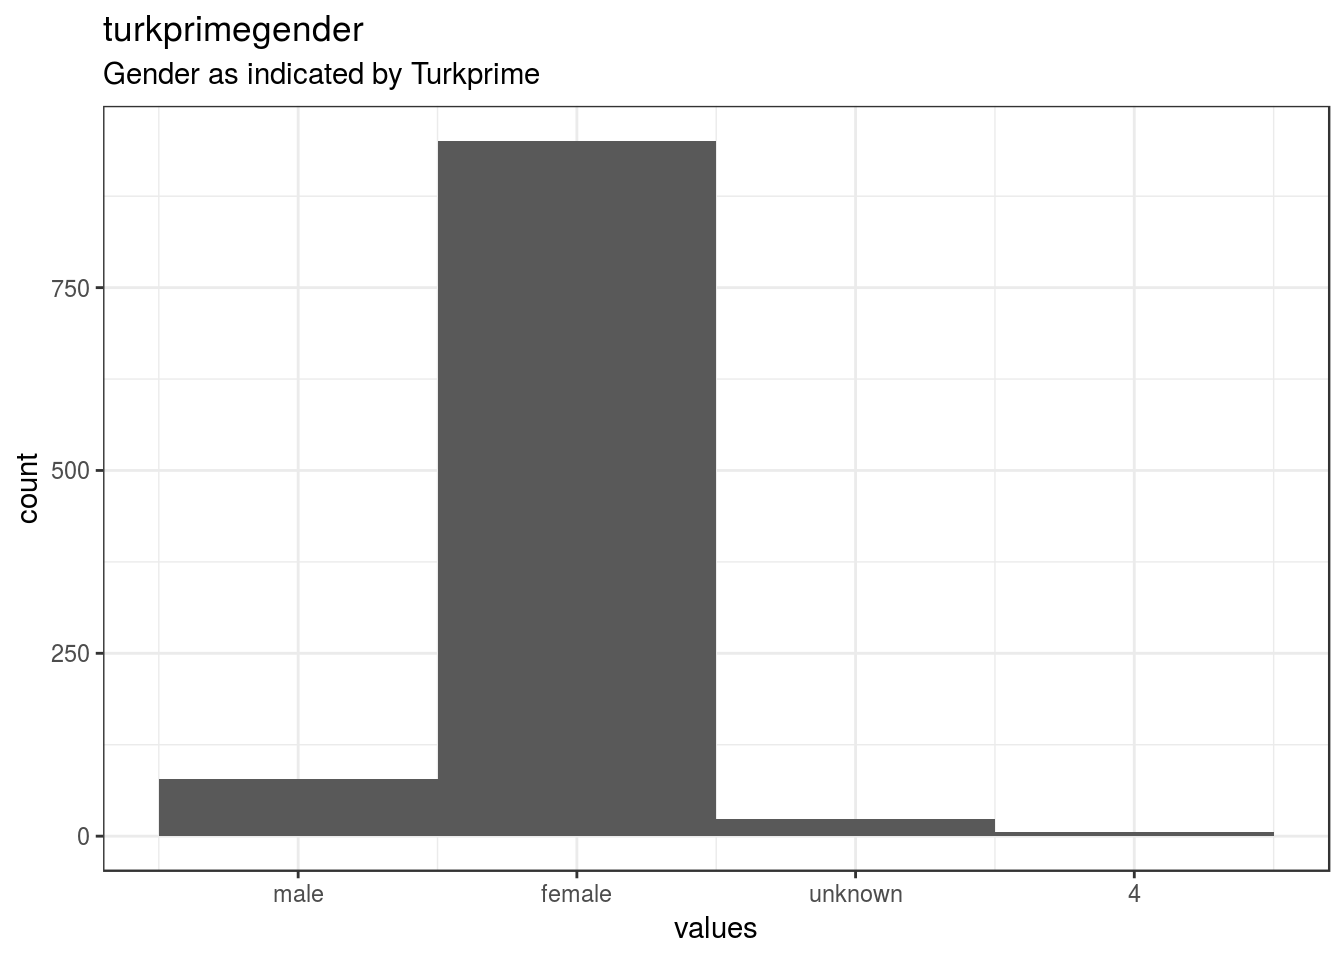
knitr::opts_chunk$set(fig.height = old_height)947 missing values.
Summary statistics
attributes(item) <- item_attributes
df = data.frame(item, stringsAsFactors = FALSE)
names(df) = html_item_name
escaped_table(codebook_table(df))| name | label | data_type | value_labels | missing | complete | n | mean | sd | p0 | p25 | p50 | p75 | p100 | hist | format.spss | display_width |
|---|---|---|---|---|---|---|---|---|---|---|---|---|---|---|---|---|
| turkprimegender | Gender as indicated by Turkprime | numeric | 1. male, 2. female, 3. unknown |
947 | 1059 | 2006 | 1.96 | 0.34 | 1 | 2 | 2 | 2 | 4 | ▁▁▇▁▁▁▁▁ | F8.0 | 13 |
if (show_missing_values) {
  plot_labelled(missing_values, item_name, wrap_at)
}
if (!is.null(item_info)) {
# don't show choices again, if they're basically same thing as value labels
if (!is.null(choices) && !is.null(item_info$choices) &&
all(names(na.omit(choices)) == item_info$choices) &&
all(na.omit(choices) == names(item_info$choices))) {
item_info$choices <- NULL
}
item_info$label_parsed <-
item_info$choice_list <- item_info$study_id <- item_info$id <- NULL
pander::pander(item_info)
}Value labels
if (!is.null(choices) && length(choices) && length(choices) < 30) {
    pander::pander(as.list(choices))
}- male: 1
- female: 2
- unknown: 3
sexorien
Do you consider yourself to be heterosexual?
Distribution
show_missing_values <- FALSE
if (has_labels(item)) {
  missing_values <- item[is.na(haven::zap_missing(item))]
  attributes(missing_values) <- attributes(item)
  if (!is.null(attributes(item)$labels)) {
    attributes(missing_values)$labels <- attributes(missing_values)$labels[is.na(attributes(missing_values)$labels)]
    attributes(item)$labels <- attributes(item)$labels[!is.na(attributes(item)$labels)]
  }
  if (is.double(item)) {
    show_missing_values <- length(unique(haven::na_tag(missing_values))) > 1
    item <- haven::zap_missing(item)
  }
  if (length(item_attributes$labels) == 0 && is.numeric(item)) {
    item <- haven::zap_labels(item)
  }
}
item_nomiss <- item[!is.na(item)]

# unnest mc_multiple and so on
if (
  is.character(item_nomiss) &&
  stringr::str_detect(item_nomiss, stringr::fixed(", ")) &&
  (exists("type", item_info) &&
    stringr::str_detect(item_info$type, pattern = stringr::fixed("multiple")))
  ) {
  item_nomiss <- unlist(stringr::str_split(item_nomiss, pattern = stringr::fixed(", ")))
}
attributes(item_nomiss) <- attributes(item)

old_height <- knitr::opts_chunk$get("fig.height")
non_missing_choices <- item_attributes[["labels"]]
many_labels <- length(non_missing_choices) > 7
go_vertical <- !is.numeric(item_nomiss) || many_labels
if ( go_vertical ) {
  # numeric items are plotted horizontally (because that's what usually expected)
  # categorical items are plotted vertically because we can use the screen real estate better this way

    if (is.null(choices) ||
        dplyr::n_distinct(item_nomiss) > length(non_missing_choices)) {
        non_missing_choices <- unique(item_nomiss)
        names(non_missing_choices) <- non_missing_choices
    }
  choice_multiplier <- old_height/6.5
    new_height <- 2 + choice_multiplier * length(non_missing_choices)
    new_height <- ifelse(new_height > 20, 20, new_height)
    new_height <- ifelse(new_height < 1, 1, new_height)
    knitr::opts_chunk$set(fig.height = new_height)
}

wrap_at <- knitr::opts_chunk$get("fig.width") * 10
# todo: if there are free-text choices mingled in with the pre-defined ones, don't show
# todo: show rare items if they are pre-defined
# todo: bin rare responses into "other category"
if (!length(item_nomiss)) {
cat("No non-missing values to show.")
} else if (is.numeric(item_nomiss) || dplyr::n_distinct(item_nomiss) < 20) {
plot_labelled(item_nomiss, item_name, wrap_at, go_vertical)
} else {
cat(dplyr::n_distinct(item_nomiss), " unique, categorical values, so not shown.")
}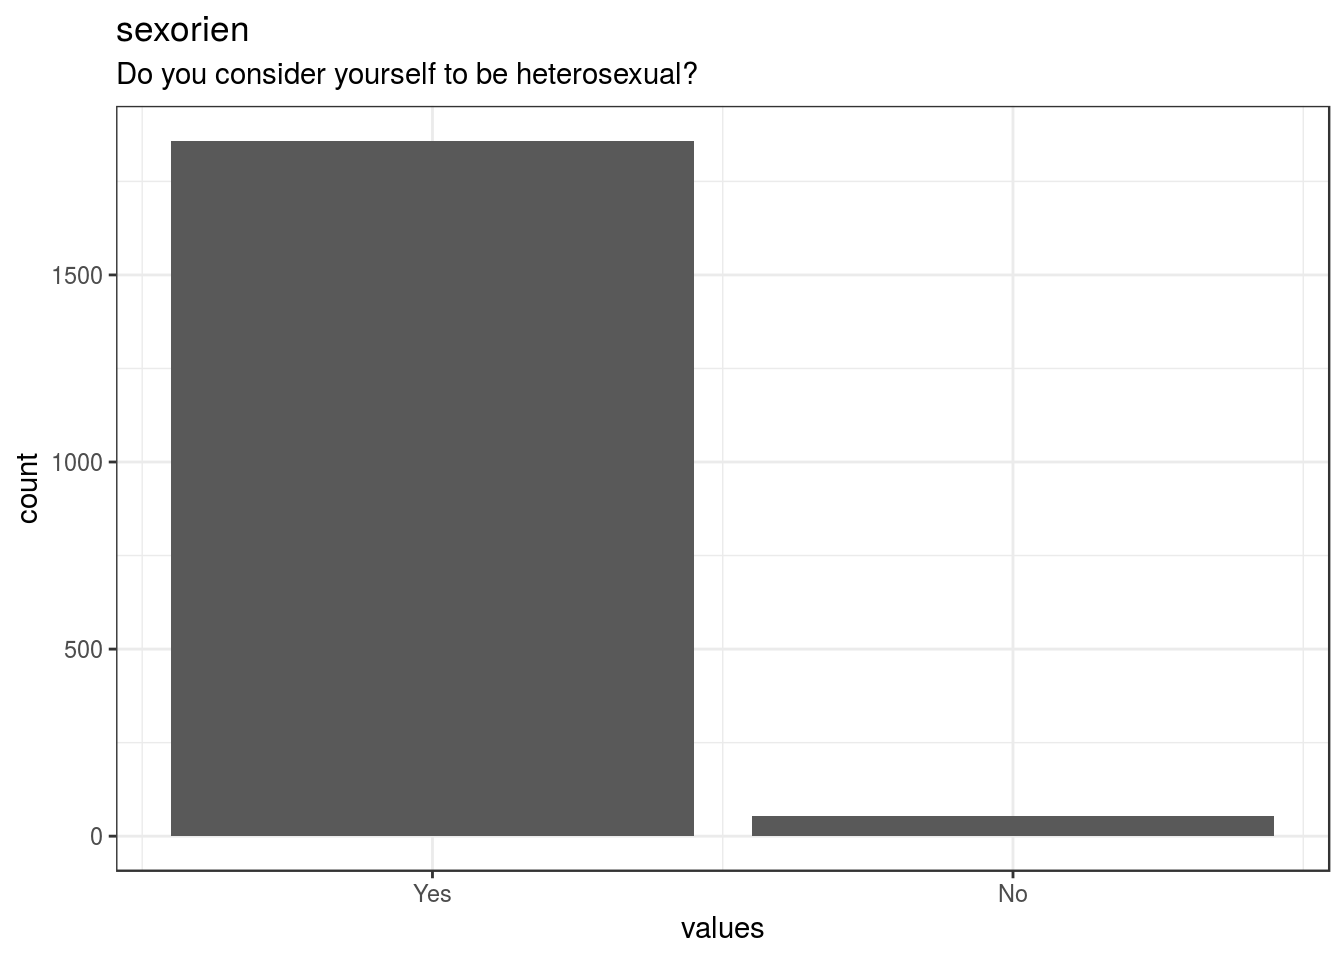
knitr::opts_chunk$set(fig.height = old_height)93 missing values.
Summary statistics
attributes(item) <- item_attributes
df = data.frame(item, stringsAsFactors = FALSE)
names(df) = html_item_name
escaped_table(codebook_table(df))| name | label | data_type | value_labels | missing | complete | n | mean | sd | p0 | p25 | p50 | p75 | p100 | hist | format.spss |
|---|---|---|---|---|---|---|---|---|---|---|---|---|---|---|---|
| sexorien | Do you consider yourself to be heterosexual? | numeric | 1. Yes, 2. No |
93 | 1913 | 2006 | 1.03 | 0.17 | 1 | 1 | 1 | 1 | 2 | ▇▁▁▁▁▁▁▁ | F8.0 |
if (show_missing_values) {
  plot_labelled(missing_values, item_name, wrap_at)
}
if (!is.null(item_info)) {
# don't show choices again, if they're basically same thing as value labels
if (!is.null(choices) && !is.null(item_info$choices) &&
all(names(na.omit(choices)) == item_info$choices) &&
all(na.omit(choices) == names(item_info$choices))) {
item_info$choices <- NULL
}
item_info$label_parsed <-
item_info$choice_list <- item_info$study_id <- item_info$id <- NULL
pander::pander(item_info)
}Value labels
if (!is.null(choices) && length(choices) && length(choices) < 30) {
    pander::pander(as.list(choices))
}- Yes: 1
- No: 2
citizen
Were you born a United States citizen?
Distribution
show_missing_values <- FALSE
if (has_labels(item)) {
  missing_values <- item[is.na(haven::zap_missing(item))]
  attributes(missing_values) <- attributes(item)
  if (!is.null(attributes(item)$labels)) {
    attributes(missing_values)$labels <- attributes(missing_values)$labels[is.na(attributes(missing_values)$labels)]
    attributes(item)$labels <- attributes(item)$labels[!is.na(attributes(item)$labels)]
  }
  if (is.double(item)) {
    show_missing_values <- length(unique(haven::na_tag(missing_values))) > 1
    item <- haven::zap_missing(item)
  }
  if (length(item_attributes$labels) == 0 && is.numeric(item)) {
    item <- haven::zap_labels(item)
  }
}
item_nomiss <- item[!is.na(item)]

# unnest mc_multiple and so on
if (
  is.character(item_nomiss) &&
  stringr::str_detect(item_nomiss, stringr::fixed(", ")) &&
  (exists("type", item_info) &&
    stringr::str_detect(item_info$type, pattern = stringr::fixed("multiple")))
  ) {
  item_nomiss <- unlist(stringr::str_split(item_nomiss, pattern = stringr::fixed(", ")))
}
attributes(item_nomiss) <- attributes(item)

old_height <- knitr::opts_chunk$get("fig.height")
non_missing_choices <- item_attributes[["labels"]]
many_labels <- length(non_missing_choices) > 7
go_vertical <- !is.numeric(item_nomiss) || many_labels
if ( go_vertical ) {
  # numeric items are plotted horizontally (because that's what usually expected)
  # categorical items are plotted vertically because we can use the screen real estate better this way

    if (is.null(choices) ||
        dplyr::n_distinct(item_nomiss) > length(non_missing_choices)) {
        non_missing_choices <- unique(item_nomiss)
        names(non_missing_choices) <- non_missing_choices
    }
  choice_multiplier <- old_height/6.5
    new_height <- 2 + choice_multiplier * length(non_missing_choices)
    new_height <- ifelse(new_height > 20, 20, new_height)
    new_height <- ifelse(new_height < 1, 1, new_height)
    knitr::opts_chunk$set(fig.height = new_height)
}

wrap_at <- knitr::opts_chunk$get("fig.width") * 10
# todo: if there are free-text choices mingled in with the pre-defined ones, don't show
# todo: show rare items if they are pre-defined
# todo: bin rare responses into "other category"
if (!length(item_nomiss)) {
cat("No non-missing values to show.")
} else if (is.numeric(item_nomiss) || dplyr::n_distinct(item_nomiss) < 20) {
plot_labelled(item_nomiss, item_name, wrap_at, go_vertical)
} else {
cat(dplyr::n_distinct(item_nomiss), " unique, categorical values, so not shown.")
}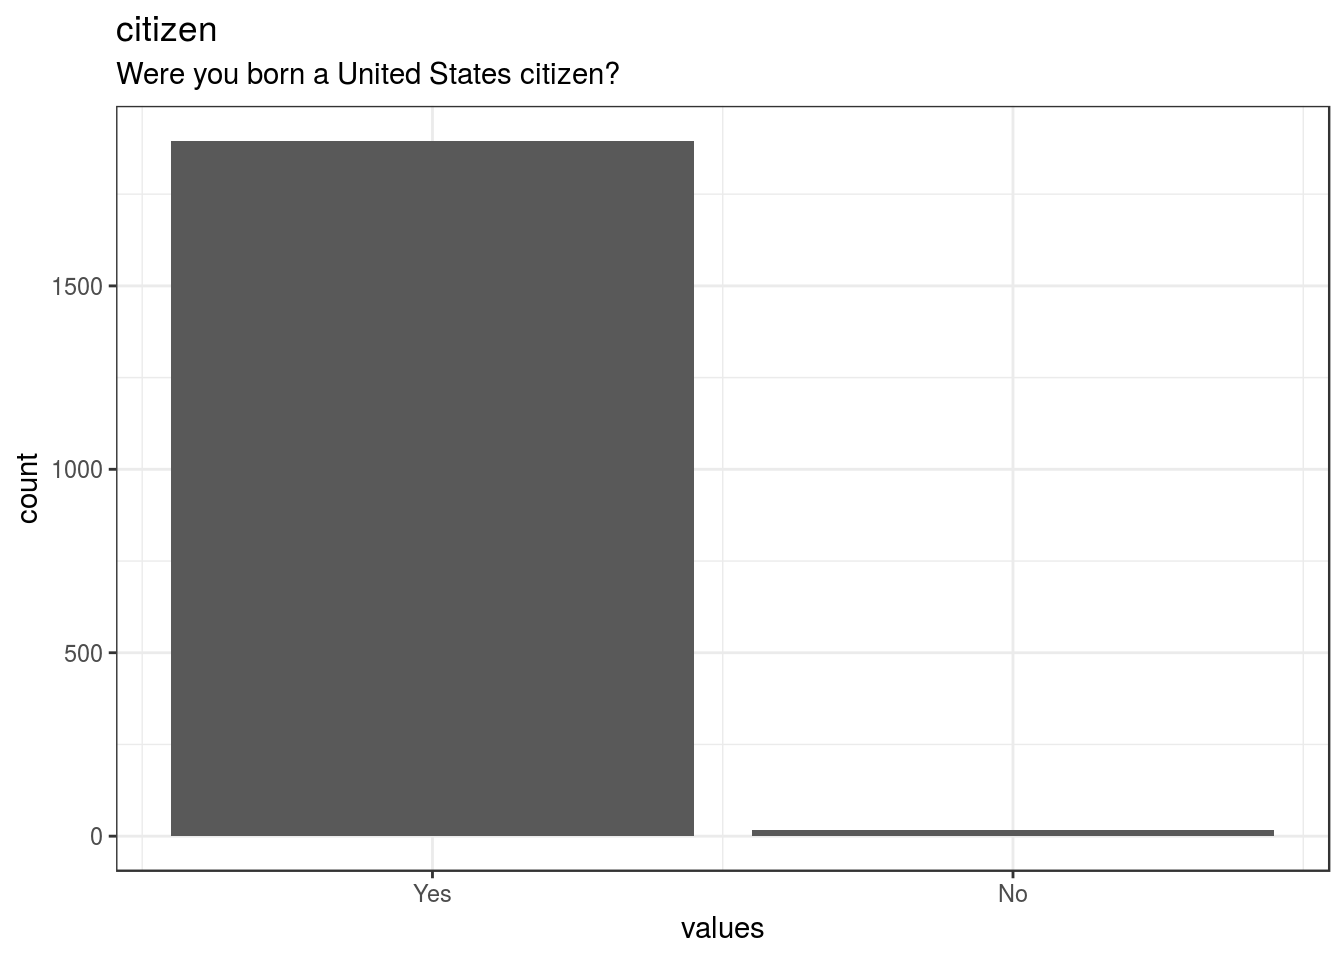
knitr::opts_chunk$set(fig.height = old_height)94 missing values.
Summary statistics
attributes(item) <- item_attributes
df = data.frame(item, stringsAsFactors = FALSE)
names(df) = html_item_name
escaped_table(codebook_table(df))| name | label | data_type | ordered | value_labels | missing | complete | n | n_unique | top_counts | format.spss |
|---|---|---|---|---|---|---|---|---|---|---|
| citizen | Were you born a United States citizen? | labelled | FALSE | 1. Yes, 2. No |
94 | 1912 | 2006 | 2 | 1: 1896, NA: 94, 2: 16 | F8.0 |
if (show_missing_values) {
  plot_labelled(missing_values, item_name, wrap_at)
}
if (!is.null(item_info)) {
# don't show choices again, if they're basically same thing as value labels
if (!is.null(choices) && !is.null(item_info$choices) &&
all(names(na.omit(choices)) == item_info$choices) &&
all(na.omit(choices) == names(item_info$choices))) {
item_info$choices <- NULL
}
item_info$label_parsed <-
item_info$choice_list <- item_info$study_id <- item_info$id <- NULL
pander::pander(item_info)
}Value labels
if (!is.null(choices) && length(choices) && length(choices) < 30) {
    pander::pander(as.list(choices))
}- Yes: 1
- No: 2
hormcon
Are you currently using hormonal contraceptives (e.g. birth control pills, patches, rings, shots,…
Distribution
show_missing_values <- FALSE
if (has_labels(item)) {
  missing_values <- item[is.na(haven::zap_missing(item))]
  attributes(missing_values) <- attributes(item)
  if (!is.null(attributes(item)$labels)) {
    attributes(missing_values)$labels <- attributes(missing_values)$labels[is.na(attributes(missing_values)$labels)]
    attributes(item)$labels <- attributes(item)$labels[!is.na(attributes(item)$labels)]
  }
  if (is.double(item)) {
    show_missing_values <- length(unique(haven::na_tag(missing_values))) > 1
    item <- haven::zap_missing(item)
  }
  if (length(item_attributes$labels) == 0 && is.numeric(item)) {
    item <- haven::zap_labels(item)
  }
}
item_nomiss <- item[!is.na(item)]

# unnest mc_multiple and so on
if (
  is.character(item_nomiss) &&
  stringr::str_detect(item_nomiss, stringr::fixed(", ")) &&
  (exists("type", item_info) &&
    stringr::str_detect(item_info$type, pattern = stringr::fixed("multiple")))
  ) {
  item_nomiss <- unlist(stringr::str_split(item_nomiss, pattern = stringr::fixed(", ")))
}
attributes(item_nomiss) <- attributes(item)

old_height <- knitr::opts_chunk$get("fig.height")
non_missing_choices <- item_attributes[["labels"]]
many_labels <- length(non_missing_choices) > 7
go_vertical <- !is.numeric(item_nomiss) || many_labels
if ( go_vertical ) {
  # numeric items are plotted horizontally (because that's what usually expected)
  # categorical items are plotted vertically because we can use the screen real estate better this way

    if (is.null(choices) ||
        dplyr::n_distinct(item_nomiss) > length(non_missing_choices)) {
        non_missing_choices <- unique(item_nomiss)
        names(non_missing_choices) <- non_missing_choices
    }
  choice_multiplier <- old_height/6.5
    new_height <- 2 + choice_multiplier * length(non_missing_choices)
    new_height <- ifelse(new_height > 20, 20, new_height)
    new_height <- ifelse(new_height < 1, 1, new_height)
    knitr::opts_chunk$set(fig.height = new_height)
}

wrap_at <- knitr::opts_chunk$get("fig.width") * 10
# todo: if there are free-text choices mingled in with the pre-defined ones, don't show
# todo: show rare items if they are pre-defined
# todo: bin rare responses into "other category"
if (!length(item_nomiss)) {
cat("No non-missing values to show.")
} else if (is.numeric(item_nomiss) || dplyr::n_distinct(item_nomiss) < 20) {
plot_labelled(item_nomiss, item_name, wrap_at, go_vertical)
} else {
cat(dplyr::n_distinct(item_nomiss), " unique, categorical values, so not shown.")
}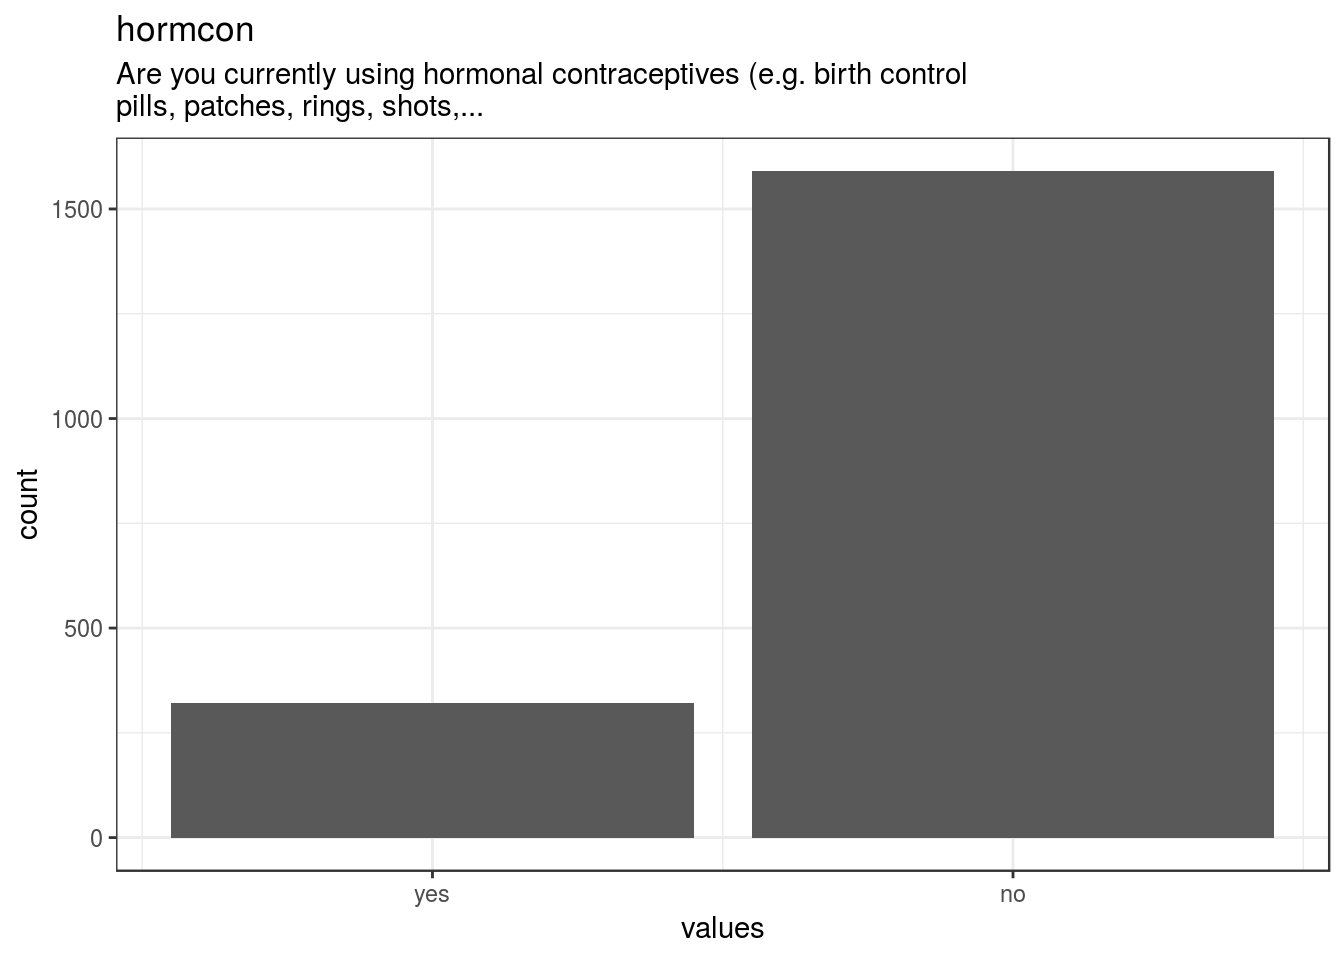
knitr::opts_chunk$set(fig.height = old_height)93 missing values.
Summary statistics
attributes(item) <- item_attributes
df = data.frame(item, stringsAsFactors = FALSE)
names(df) = html_item_name
escaped_table(codebook_table(df))| name | label | data_type | value_labels | missing | complete | n | mean | sd | p0 | p25 | p50 | p75 | p100 | hist | format.spss |
|---|---|---|---|---|---|---|---|---|---|---|---|---|---|---|---|
| hormcon | Are you currently using hormonal contraceptives (e.g. birth control pills, patches, rings, shots,… | numeric | 1. yes, 2. no |
93 | 1913 | 2006 | 1.83 | 0.37 | 1 | 2 | 2 | 2 | 2 | ▂▁▁▁▁▁▁▇ | F8.0 |
if (show_missing_values) {
  plot_labelled(missing_values, item_name, wrap_at)
}
if (!is.null(item_info)) {
# don't show choices again, if they're basically same thing as value labels
if (!is.null(choices) && !is.null(item_info$choices) &&
all(names(na.omit(choices)) == item_info$choices) &&
all(na.omit(choices) == names(item_info$choices))) {
item_info$choices <- NULL
}
item_info$label_parsed <-
item_info$choice_list <- item_info$study_id <- item_info$id <- NULL
pander::pander(item_info)
}Value labels
if (!is.null(choices) && length(choices) && length(choices) < 30) {
    pander::pander(as.list(choices))
}- yes: 1
- no: 2
education
What is the highest level of education that you have completed?
Distribution
show_missing_values <- FALSE
if (has_labels(item)) {
  missing_values <- item[is.na(haven::zap_missing(item))]
  attributes(missing_values) <- attributes(item)
  if (!is.null(attributes(item)$labels)) {
    attributes(missing_values)$labels <- attributes(missing_values)$labels[is.na(attributes(missing_values)$labels)]
    attributes(item)$labels <- attributes(item)$labels[!is.na(attributes(item)$labels)]
  }
  if (is.double(item)) {
    show_missing_values <- length(unique(haven::na_tag(missing_values))) > 1
    item <- haven::zap_missing(item)
  }
  if (length(item_attributes$labels) == 0 && is.numeric(item)) {
    item <- haven::zap_labels(item)
  }
}
item_nomiss <- item[!is.na(item)]

# unnest mc_multiple and so on
if (
  is.character(item_nomiss) &&
  stringr::str_detect(item_nomiss, stringr::fixed(", ")) &&
  (exists("type", item_info) &&
    stringr::str_detect(item_info$type, pattern = stringr::fixed("multiple")))
  ) {
  item_nomiss <- unlist(stringr::str_split(item_nomiss, pattern = stringr::fixed(", ")))
}
attributes(item_nomiss) <- attributes(item)

old_height <- knitr::opts_chunk$get("fig.height")
non_missing_choices <- item_attributes[["labels"]]
many_labels <- length(non_missing_choices) > 7
go_vertical <- !is.numeric(item_nomiss) || many_labels
if ( go_vertical ) {
  # numeric items are plotted horizontally (because that's what usually expected)
  # categorical items are plotted vertically because we can use the screen real estate better this way

    if (is.null(choices) ||
        dplyr::n_distinct(item_nomiss) > length(non_missing_choices)) {
        non_missing_choices <- unique(item_nomiss)
        names(non_missing_choices) <- non_missing_choices
    }
  choice_multiplier <- old_height/6.5
    new_height <- 2 + choice_multiplier * length(non_missing_choices)
    new_height <- ifelse(new_height > 20, 20, new_height)
    new_height <- ifelse(new_height < 1, 1, new_height)
    knitr::opts_chunk$set(fig.height = new_height)
}

wrap_at <- knitr::opts_chunk$get("fig.width") * 10
# todo: if there are free-text choices mingled in with the pre-defined ones, don't show
# todo: show rare items if they are pre-defined
# todo: bin rare responses into "other category"
if (!length(item_nomiss)) {
cat("No non-missing values to show.")
} else if (is.numeric(item_nomiss) || dplyr::n_distinct(item_nomiss) < 20) {
plot_labelled(item_nomiss, item_name, wrap_at, go_vertical)
} else {
cat(dplyr::n_distinct(item_nomiss), " unique, categorical values, so not shown.")
}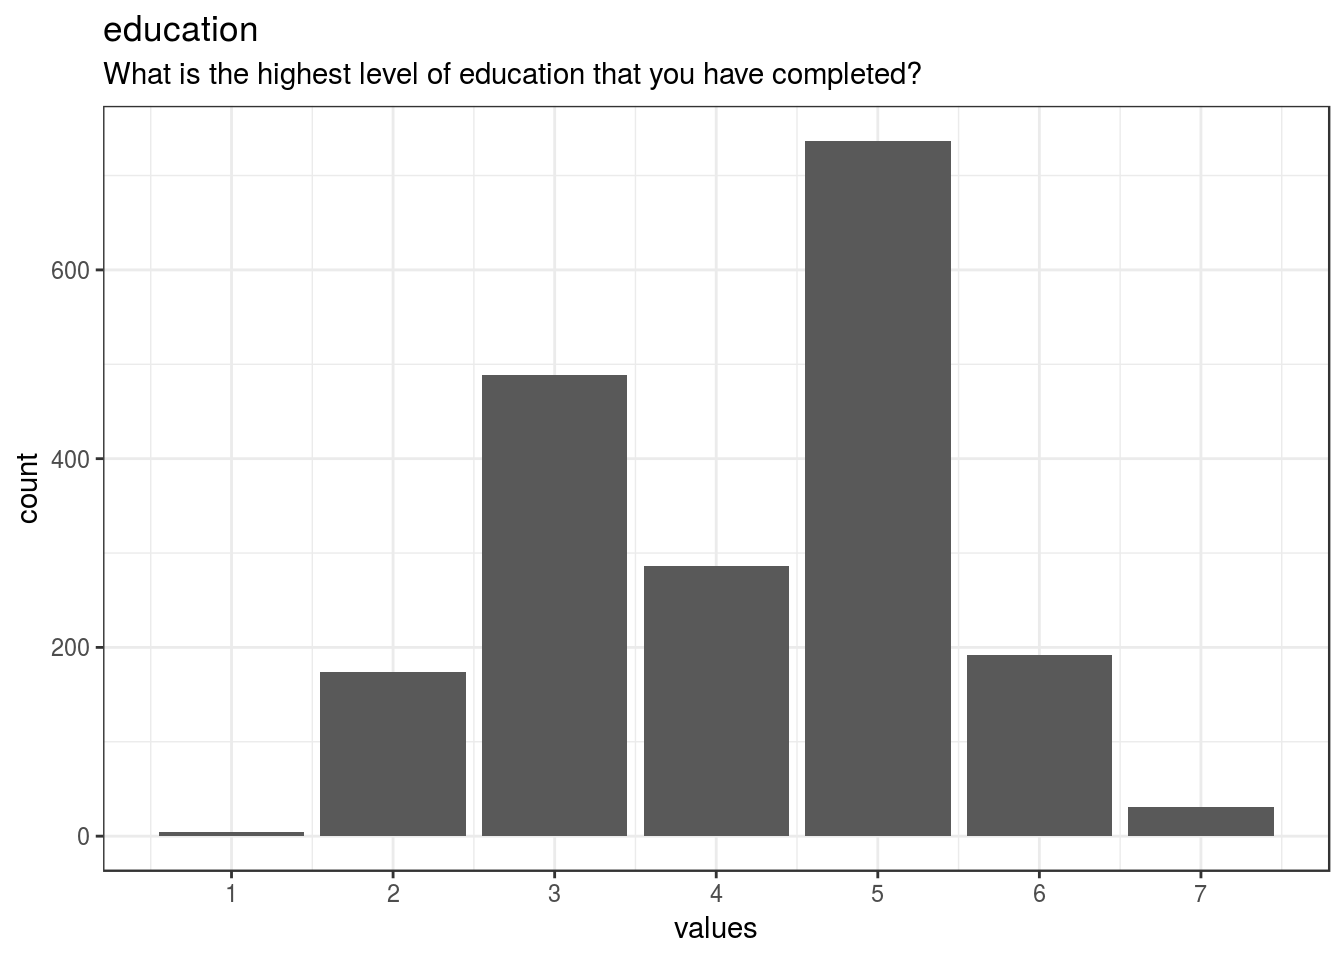
knitr::opts_chunk$set(fig.height = old_height)93 missing values.
Summary statistics
attributes(item) <- item_attributes
df = data.frame(item, stringsAsFactors = FALSE)
names(df) = html_item_name
escaped_table(codebook_table(df))| name | label | data_type | ordered | value_labels | missing | complete | n | n_unique | top_counts | format.spss |
|---|---|---|---|---|---|---|---|---|---|---|
| education | What is the highest level of education that you have completed? | labelled | FALSE | 1. 1, 2. 2, 3. 3, 4. 4, 5. 5, 6. 6, 7. 7 |
93 | 1913 | 2006 | 7 | 5: 737, 3: 489, 4: 286, 6: 192 | F8.0 |
if (show_missing_values) {
  plot_labelled(missing_values, item_name, wrap_at)
}
if (!is.null(item_info)) {
# don't show choices again, if they're basically same thing as value labels
if (!is.null(choices) && !is.null(item_info$choices) &&
all(names(na.omit(choices)) == item_info$choices) &&
all(na.omit(choices) == names(item_info$choices))) {
item_info$choices <- NULL
}
item_info$label_parsed <-
item_info$choice_list <- item_info$study_id <- item_info$id <- NULL
pander::pander(item_info)
}Value labels
if (!is.null(choices) && length(choices) && length(choices) < 30) {
    pander::pander(as.list(choices))
}- 1: 1
- 2: 2
- 3: 3
- 4: 4
- 5: 5
- 6: 6
- 7: 7
single
Would you consider your relationship status as single?
Distribution
show_missing_values <- FALSE
if (has_labels(item)) {
missing_values <- item[is.na(haven::zap_missing(item))]
attributes(missing_values) <- attributes(item)
if (!is.null(attributes(item)$labels)) {
attributes(missing_values)$labels <- attributes(missing_values)$labels[is.na(attributes(missing_values)$labels)]
attributes(item)$labels <- attributes(item)$labels[!is.na(attributes(item)$labels)]
}
if (is.double(item)) {
show_missing_values <- length(unique(haven::na_tag(missing_values))) > 1
item <- haven::zap_missing(item)
}
if (length(item_attributes$labels) == 0 && is.numeric(item)) {
item <- haven::zap_labels(item)
}
}
item_nomiss <- item[!is.na(item)]
# unnest mc_multiple and so on
if (
is.character(item_nomiss) &&
stringr::str_detect(item_nomiss, stringr::fixed(", ")) &&
(exists("type", item_info) &&
stringr::str_detect(item_info$type, pattern = stringr::fixed("multiple")))
) {
item_nomiss <- unlist(stringr::str_split(item_nomiss, pattern = stringr::fixed(", ")))
}
attributes(item_nomiss) <- attributes(item)
old_height <- knitr::opts_chunk$get("fig.height")
non_missing_choices <- item_attributes[["labels"]]
many_labels <- length(non_missing_choices) > 7
go_vertical <- !is.numeric(item_nomiss) || many_labels
if ( go_vertical ) {
# numeric items are plotted horizontally (because that's what usually expected)
# categorical items are plotted vertically because we can use the screen real estate better this way
if (is.null(choices) ||
dplyr::n_distinct(item_nomiss) > length(non_missing_choices)) {
non_missing_choices <- unique(item_nomiss)
names(non_missing_choices) <- non_missing_choices
}
choice_multiplier <- old_height/6.5
new_height <- 2 + choice_multiplier * length(non_missing_choices)
new_height <- ifelse(new_height > 20, 20, new_height)
new_height <- ifelse(new_height < 1, 1, new_height)
knitr::opts_chunk$set(fig.height = new_height)
}
wrap_at <- knitr::opts_chunk$get("fig.width") * 10# todo: if there are free-text choices mingled in with the pre-defined ones, don't show
# todo: show rare items if they are pre-defined
# todo: bin rare responses into "other category"
if (!length(item_nomiss)) {
cat("No non-missing values to show.")
} else if (is.numeric(item_nomiss) || dplyr::n_distinct(item_nomiss) < 20) {
plot_labelled(item_nomiss, item_name, wrap_at, go_vertical)
} else {
cat(dplyr::n_distinct(item_nomiss), " unique, categorical values, so not shown.")
}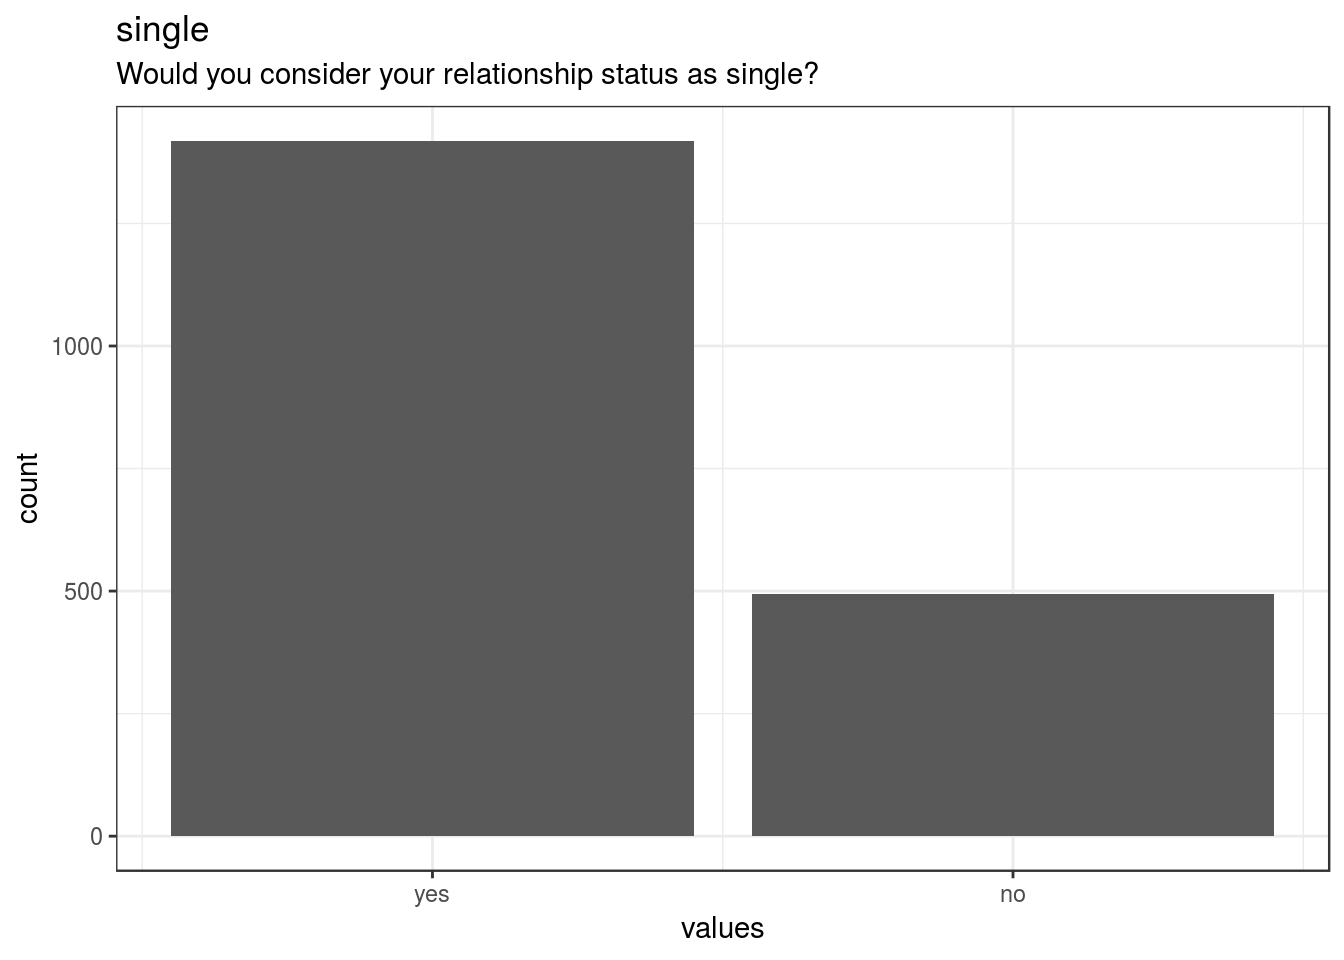
knitr::opts_chunk$set(fig.height = old_height)93 missing values.
Summary statistics
attributes(item) <- item_attributes
df = data.frame(item, stringsAsFactors = FALSE)
names(df) = html_item_name
escaped_table(codebook_table(df))| name | label | data_type | value_labels | missing | complete | n | mean | sd | p0 | p25 | p50 | p75 | p100 | hist | format.spss |
|---|---|---|---|---|---|---|---|---|---|---|---|---|---|---|---|
| single | Would you consider your relationship status as single? | numeric | 1. yes, 2. no |
93 | 1913 | 2006 | 1.26 | 0.44 | 1 | 1 | 1 | 2 | 2 | ▇▁▁▁▁▁▁▃ | F8.0 |
if (show_missing_values) {
plot_labelled(missing_values, item_name, wrap_at)
}if (!is.null(item_info)) {
# don't show choices again, if they're basically same thing as value labels
if (!is.null(choices) && !is.null(item_info$choices) &&
all(names(na.omit(choices)) == item_info$choices) &&
all(na.omit(choices) == names(item_info$choices))) {
item_info$choices <- NULL
}
item_info$label_parsed <-
item_info$choice_list <- item_info$study_id <- item_info$id <- NULL
pander::pander(item_info)
}Value labels
if (!is.null(choices) && length(choices) && length(choices) < 30) {
pander::pander(as.list(choices))
}- yes: 1
- no: 2
annualincome
What is your current annual income? Please enter the amount WITHOUT any letters or symbols ( $ or…
Distribution
show_missing_values <- FALSE
if (has_labels(item)) {
missing_values <- item[is.na(haven::zap_missing(item))]
attributes(missing_values) <- attributes(item)
if (!is.null(attributes(item)$labels)) {
attributes(missing_values)$labels <- attributes(missing_values)$labels[is.na(attributes(missing_values)$labels)]
attributes(item)$labels <- attributes(item)$labels[!is.na(attributes(item)$labels)]
}
if (is.double(item)) {
show_missing_values <- length(unique(haven::na_tag(missing_values))) > 1
item <- haven::zap_missing(item)
}
if (length(item_attributes$labels) == 0 && is.numeric(item)) {
item <- haven::zap_labels(item)
}
}
item_nomiss <- item[!is.na(item)]
# unnest mc_multiple and so on
if (
is.character(item_nomiss) &&
stringr::str_detect(item_nomiss, stringr::fixed(", ")) &&
(exists("type", item_info) &&
stringr::str_detect(item_info$type, pattern = stringr::fixed("multiple")))
) {
item_nomiss <- unlist(stringr::str_split(item_nomiss, pattern = stringr::fixed(", ")))
}
attributes(item_nomiss) <- attributes(item)
old_height <- knitr::opts_chunk$get("fig.height")
non_missing_choices <- item_attributes[["labels"]]
many_labels <- length(non_missing_choices) > 7
go_vertical <- !is.numeric(item_nomiss) || many_labels
if ( go_vertical ) {
# numeric items are plotted horizontally (because that's what usually expected)
# categorical items are plotted vertically because we can use the screen real estate better this way
if (is.null(choices) ||
dplyr::n_distinct(item_nomiss) > length(non_missing_choices)) {
non_missing_choices <- unique(item_nomiss)
names(non_missing_choices) <- non_missing_choices
}
choice_multiplier <- old_height/6.5
new_height <- 2 + choice_multiplier * length(non_missing_choices)
new_height <- ifelse(new_height > 20, 20, new_height)
new_height <- ifelse(new_height < 1, 1, new_height)
knitr::opts_chunk$set(fig.height = new_height)
}
wrap_at <- knitr::opts_chunk$get("fig.width") * 10# todo: if there are free-text choices mingled in with the pre-defined ones, don't show
# todo: show rare items if they are pre-defined
# todo: bin rare responses into "other category"
if (!length(item_nomiss)) {
cat("No non-missing values to show.")
} else if (is.numeric(item_nomiss) || dplyr::n_distinct(item_nomiss) < 20) {
plot_labelled(item_nomiss, item_name, wrap_at, go_vertical)
} else {
cat(dplyr::n_distinct(item_nomiss), " unique, categorical values, so not shown.")
}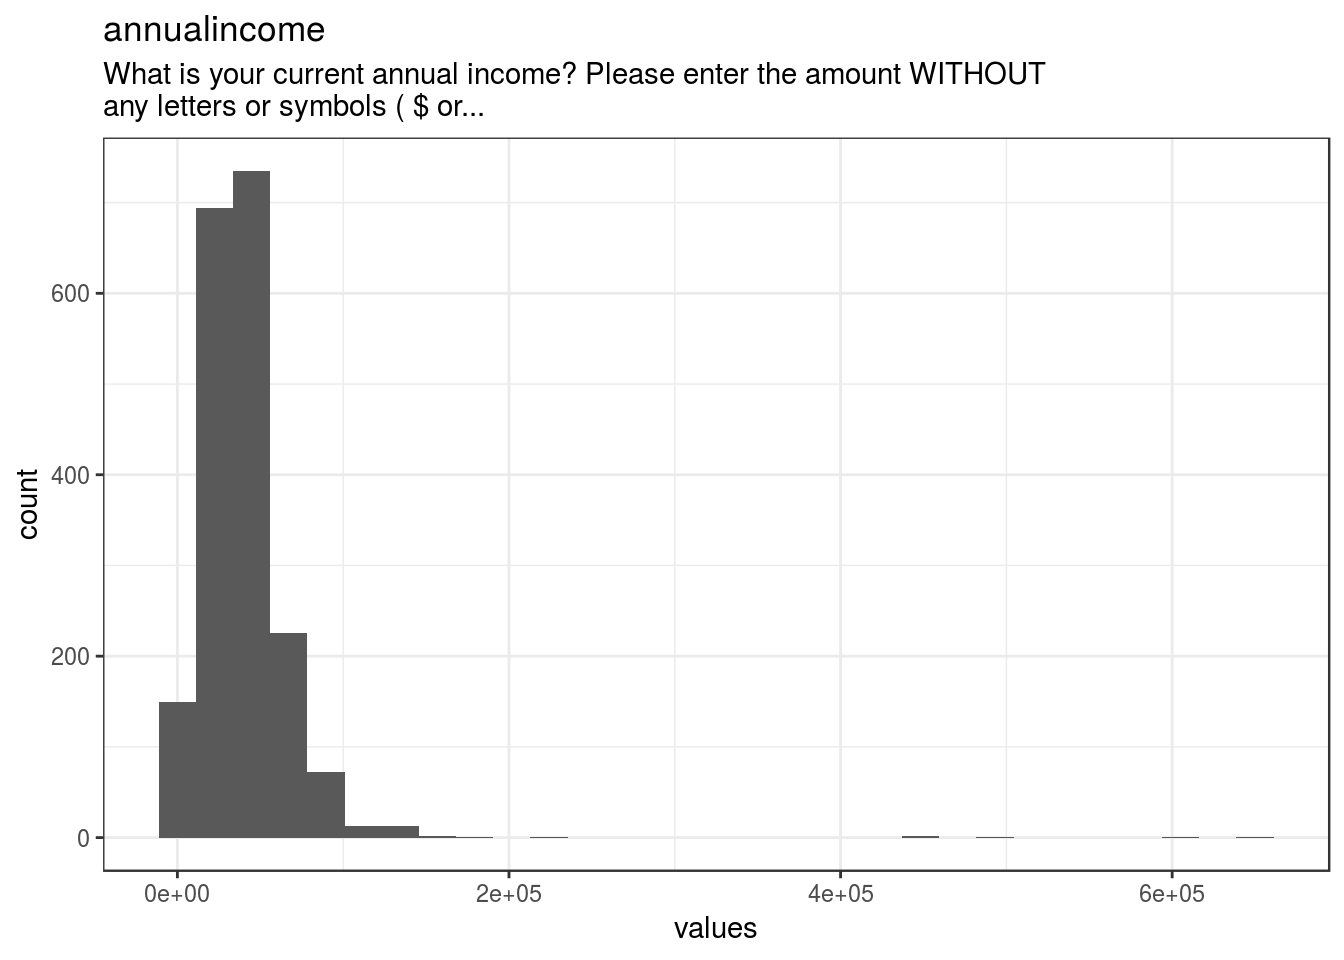
knitr::opts_chunk$set(fig.height = old_height)95 missing values.
Summary statistics
attributes(item) <- item_attributes
df = data.frame(item, stringsAsFactors = FALSE)
names(df) = html_item_name
escaped_table(codebook_table(df))| name | label | data_type | missing | complete | n | mean | sd | p0 | p25 | p50 | p75 | p100 | hist | format.spss |
|---|---|---|---|---|---|---|---|---|---|---|---|---|---|---|
| annualincome | What is your current annual income? Please enter the amount WITHOUT any letters or symbols ( $ or… | numeric | 95 | 1911 | 2006 | 40465.21 | 34018.62 | 0 | 25000 | 35800 | 50000 | 650000 | ▇▁▁▁▁▁▁▁ | F8.0 |
if (show_missing_values) {
plot_labelled(missing_values, item_name, wrap_at)
}if (!is.null(item_info)) {
# don't show choices again, if they're basically same thing as value labels
if (!is.null(choices) && !is.null(item_info$choices) &&
all(names(na.omit(choices)) == item_info$choices) &&
all(na.omit(choices) == names(item_info$choices))) {
item_info$choices <- NULL
}
item_info$label_parsed <-
item_info$choice_list <- item_info$study_id <- item_info$id <- NULL
pander::pander(item_info)
}if (!is.null(choices) && length(choices) && length(choices) < 30) {
pander::pander(as.list(choices))
}duplicateID
Entered study more than once?
Distribution
show_missing_values <- FALSE
if (has_labels(item)) {
missing_values <- item[is.na(haven::zap_missing(item))]
attributes(missing_values) <- attributes(item)
if (!is.null(attributes(item)$labels)) {
attributes(missing_values)$labels <- attributes(missing_values)$labels[is.na(attributes(missing_values)$labels)]
attributes(item)$labels <- attributes(item)$labels[!is.na(attributes(item)$labels)]
}
if (is.double(item)) {
show_missing_values <- length(unique(haven::na_tag(missing_values))) > 1
item <- haven::zap_missing(item)
}
if (length(item_attributes$labels) == 0 && is.numeric(item)) {
item <- haven::zap_labels(item)
}
}
item_nomiss <- item[!is.na(item)]
# unnest mc_multiple and so on
if (
is.character(item_nomiss) &&
stringr::str_detect(item_nomiss, stringr::fixed(", ")) &&
(exists("type", item_info) &&
stringr::str_detect(item_info$type, pattern = stringr::fixed("multiple")))
) {
item_nomiss <- unlist(stringr::str_split(item_nomiss, pattern = stringr::fixed(", ")))
}
attributes(item_nomiss) <- attributes(item)
old_height <- knitr::opts_chunk$get("fig.height")
non_missing_choices <- item_attributes[["labels"]]
many_labels <- length(non_missing_choices) > 7
go_vertical <- !is.numeric(item_nomiss) || many_labels
if ( go_vertical ) {
# numeric items are plotted horizontally (because that's what usually expected)
# categorical items are plotted vertically because we can use the screen real estate better this way
if (is.null(choices) ||
dplyr::n_distinct(item_nomiss) > length(non_missing_choices)) {
non_missing_choices <- unique(item_nomiss)
names(non_missing_choices) <- non_missing_choices
}
choice_multiplier <- old_height/6.5
new_height <- 2 + choice_multiplier * length(non_missing_choices)
new_height <- ifelse(new_height > 20, 20, new_height)
new_height <- ifelse(new_height < 1, 1, new_height)
knitr::opts_chunk$set(fig.height = new_height)
}
wrap_at <- knitr::opts_chunk$get("fig.width") * 10# todo: if there are free-text choices mingled in with the pre-defined ones, don't show
# todo: show rare items if they are pre-defined
# todo: bin rare responses into "other category"
if (!length(item_nomiss)) {
cat("No non-missing values to show.")
} else if (is.numeric(item_nomiss) || dplyr::n_distinct(item_nomiss) < 20) {
plot_labelled(item_nomiss, item_name, wrap_at, go_vertical)
} else {
cat(dplyr::n_distinct(item_nomiss), " unique, categorical values, so not shown.")
}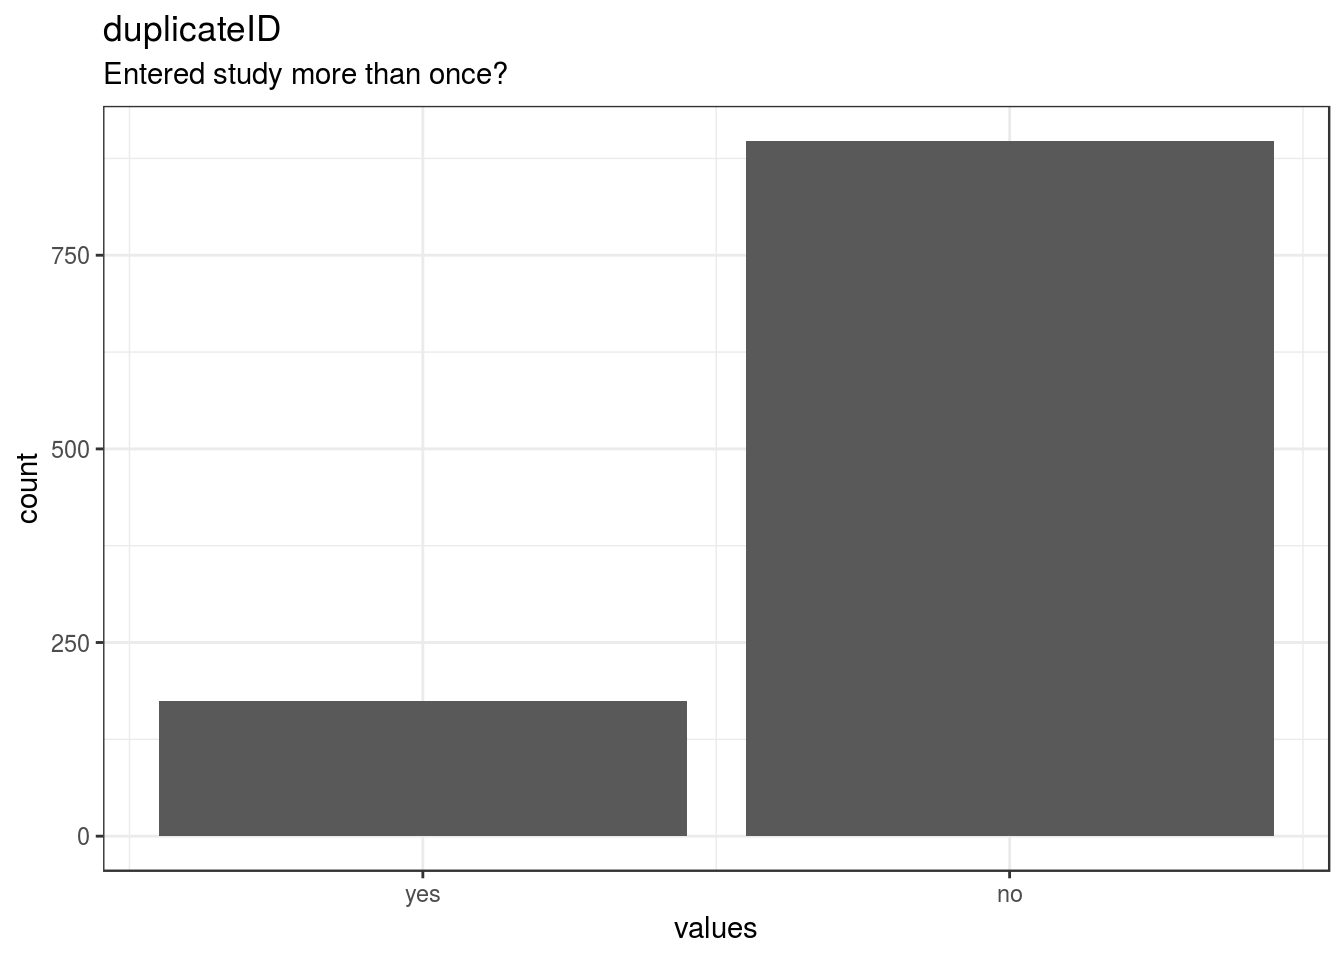
knitr::opts_chunk$set(fig.height = old_height)933 missing values.
Summary statistics
attributes(item) <- item_attributes
df = data.frame(item, stringsAsFactors = FALSE)
names(df) = html_item_name
escaped_table(codebook_table(df))| name | label | data_type | value_labels | missing | complete | n | mean | sd | p0 | p25 | p50 | p75 | p100 | hist | format.spss | display_width |
|---|---|---|---|---|---|---|---|---|---|---|---|---|---|---|---|---|
| duplicateID | Entered study more than once? | numeric | 0. yes, 1. no |
933 | 1073 | 2006 | 0.84 | 0.37 | 0 | 1 | 1 | 1 | 1 | ▂▁▁▁▁▁▁▇ | F8.0 | 10 |
if (show_missing_values) {
plot_labelled(missing_values, item_name, wrap_at)
}if (!is.null(item_info)) {
# don't show choices again, if they're basically same thing as value labels
if (!is.null(choices) && !is.null(item_info$choices) &&
all(names(na.omit(choices)) == item_info$choices) &&
all(na.omit(choices) == names(item_info$choices))) {
item_info$choices <- NULL
}
item_info$label_parsed <-
item_info$choice_list <- item_info$study_id <- item_info$id <- NULL
pander::pander(item_info)
}Value labels
if (!is.null(choices) && length(choices) && length(choices) < 30) {
pander::pander(as.list(choices))
}- yes: 0
- no: 1
demoexclusioncriteria
Exclusion just for demographics
Distribution
show_missing_values <- FALSE
if (has_labels(item)) {
missing_values <- item[is.na(haven::zap_missing(item))]
attributes(missing_values) <- attributes(item)
if (!is.null(attributes(item)$labels)) {
attributes(missing_values)$labels <- attributes(missing_values)$labels[is.na(attributes(missing_values)$labels)]
attributes(item)$labels <- attributes(item)$labels[!is.na(attributes(item)$labels)]
}
if (is.double(item)) {
show_missing_values <- length(unique(haven::na_tag(missing_values))) > 1
item <- haven::zap_missing(item)
}
if (length(item_attributes$labels) == 0 && is.numeric(item)) {
item <- haven::zap_labels(item)
}
}
item_nomiss <- item[!is.na(item)]
# unnest mc_multiple and so on
if (
is.character(item_nomiss) &&
stringr::str_detect(item_nomiss, stringr::fixed(", ")) &&
(exists("type", item_info) &&
stringr::str_detect(item_info$type, pattern = stringr::fixed("multiple")))
) {
item_nomiss <- unlist(stringr::str_split(item_nomiss, pattern = stringr::fixed(", ")))
}
attributes(item_nomiss) <- attributes(item)
old_height <- knitr::opts_chunk$get("fig.height")
non_missing_choices <- item_attributes[["labels"]]
many_labels <- length(non_missing_choices) > 7
go_vertical <- !is.numeric(item_nomiss) || many_labels
if ( go_vertical ) {
# numeric items are plotted horizontally (because that's what usually expected)
# categorical items are plotted vertically because we can use the screen real estate better this way
if (is.null(choices) ||
dplyr::n_distinct(item_nomiss) > length(non_missing_choices)) {
non_missing_choices <- unique(item_nomiss)
names(non_missing_choices) <- non_missing_choices
}
choice_multiplier <- old_height/6.5
new_height <- 2 + choice_multiplier * length(non_missing_choices)
new_height <- ifelse(new_height > 20, 20, new_height)
new_height <- ifelse(new_height < 1, 1, new_height)
knitr::opts_chunk$set(fig.height = new_height)
}
wrap_at <- knitr::opts_chunk$get("fig.width") * 10# todo: if there are free-text choices mingled in with the pre-defined ones, don't show
# todo: show rare items if they are pre-defined
# todo: bin rare responses into "other category"
if (!length(item_nomiss)) {
cat("No non-missing values to show.")
} else if (is.numeric(item_nomiss) || dplyr::n_distinct(item_nomiss) < 20) {
plot_labelled(item_nomiss, item_name, wrap_at, go_vertical)
} else {
cat(dplyr::n_distinct(item_nomiss), " unique, categorical values, so not shown.")
}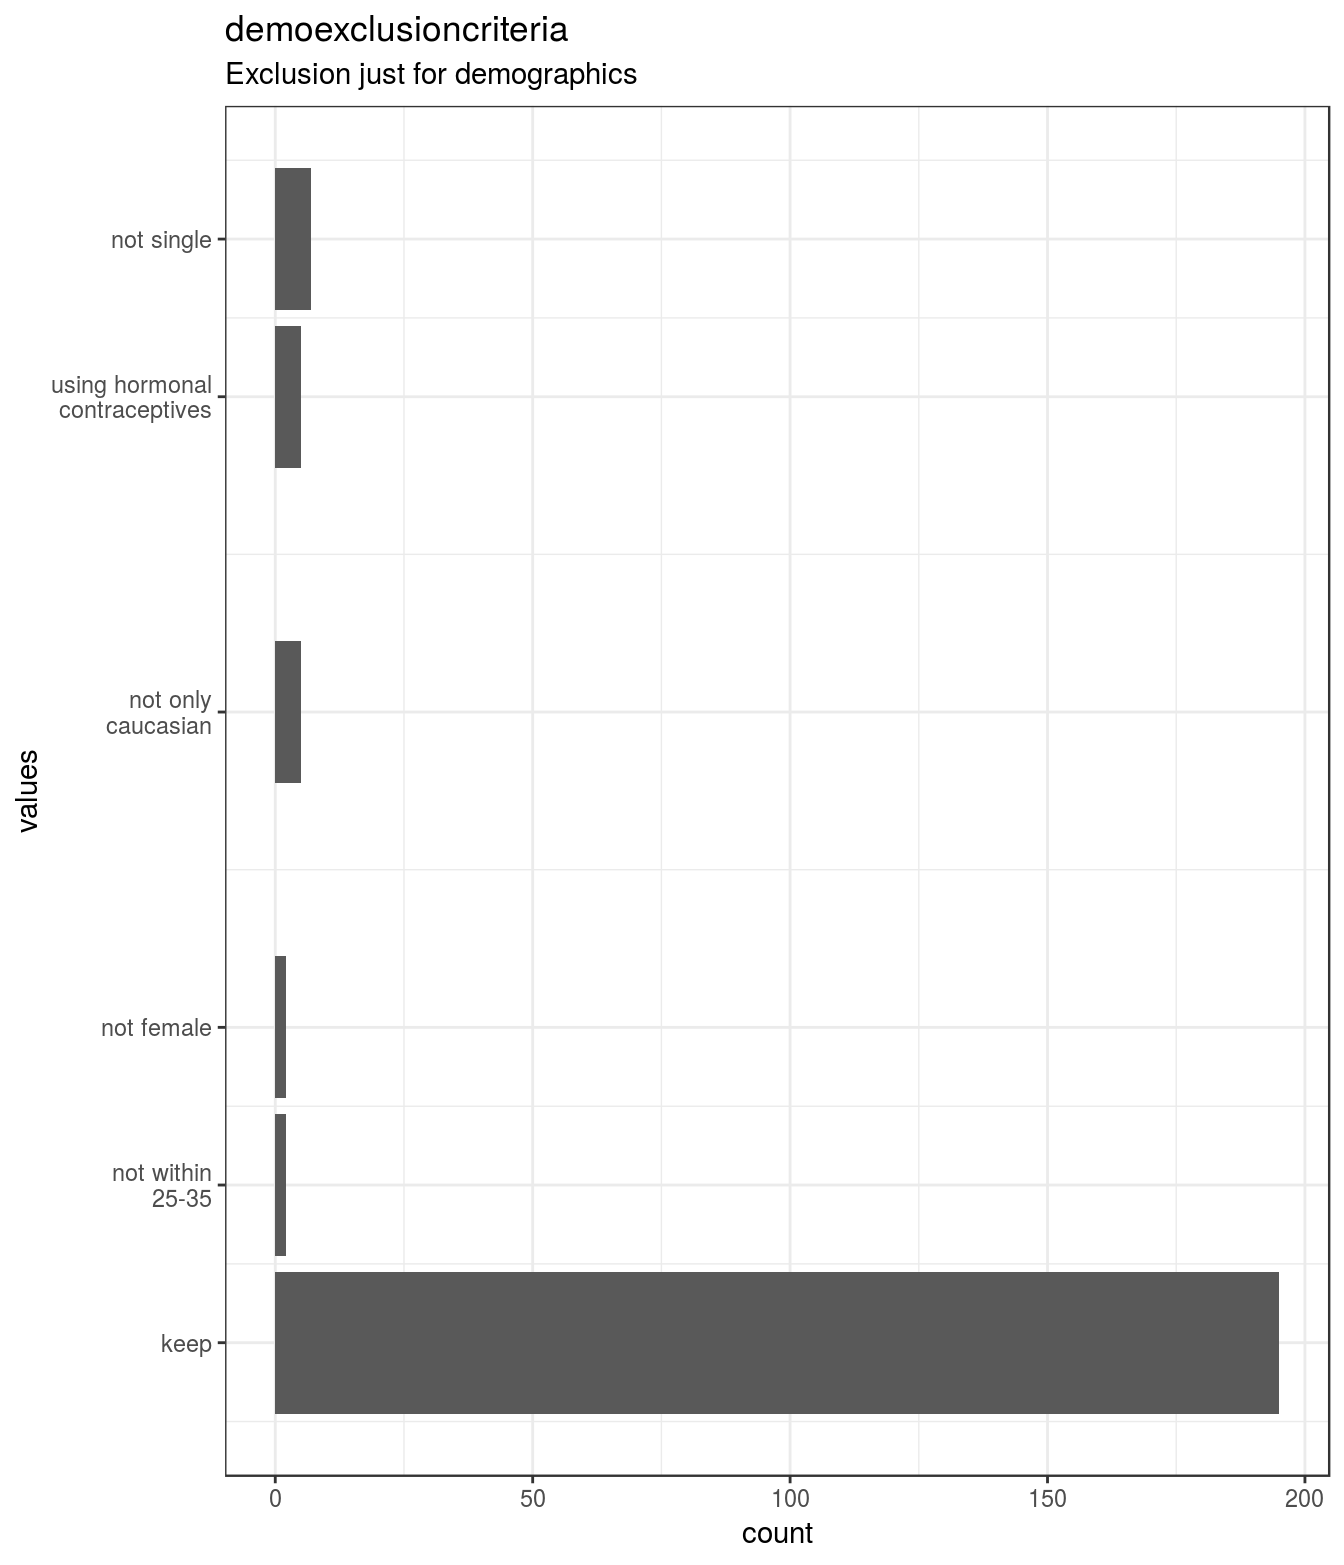
knitr::opts_chunk$set(fig.height = old_height)1790 missing values.
Summary statistics
attributes(item) <- item_attributes
df = data.frame(item, stringsAsFactors = FALSE)
names(df) = html_item_name
escaped_table(codebook_table(df))| name | label | data_type | value_labels | missing | complete | n | mean | sd | p0 | p25 | p50 | p75 | p100 | hist | format.spss | display_width |
|---|---|---|---|---|---|---|---|---|---|---|---|---|---|---|---|---|
| demoexclusioncriteria | Exclusion just for demographics | numeric | 0. keep, 1. not within 25-35, 2. not female, NA. [3] not heterosexual, 4. not only caucasian, NA. [5] not US citizen, 6. using hormonal contraceptives, 7. not single |
1790 | 216 | 2006 | 0.49 | 1.62 | 0 | 0 | 0 | 0 | 7 | ▇▁▁▁▁▁▁▁ | F40.0 | 18 |
if (show_missing_values) {
plot_labelled(missing_values, item_name, wrap_at)
}if (!is.null(item_info)) {
# don't show choices again, if they're basically same thing as value labels
if (!is.null(choices) && !is.null(item_info$choices) &&
all(names(na.omit(choices)) == item_info$choices) &&
all(na.omit(choices) == names(item_info$choices))) {
item_info$choices <- NULL
}
item_info$label_parsed <-
item_info$choice_list <- item_info$study_id <- item_info$id <- NULL
pander::pander(item_info)
}Value labels
if (!is.null(choices) && length(choices) && length(choices) < 30) {
pander::pander(as.list(choices))
}- keep: 0
- not within 25-35: 1
- not female: 2
- [3] not heterosexual: NA
- not only caucasian: 4
- [5] not US citizen: NA
- using hormonal contraceptives: 6
- not single: 7
carelessresponding
Exclusion for careless responding
Distribution
show_missing_values <- FALSE
if (has_labels(item)) {
missing_values <- item[is.na(haven::zap_missing(item))]
attributes(missing_values) <- attributes(item)
if (!is.null(attributes(item)$labels)) {
attributes(missing_values)$labels <- attributes(missing_values)$labels[is.na(attributes(missing_values)$labels)]
attributes(item)$labels <- attributes(item)$labels[!is.na(attributes(item)$labels)]
}
if (is.double(item)) {
show_missing_values <- length(unique(haven::na_tag(missing_values))) > 1
item <- haven::zap_missing(item)
}
if (length(item_attributes$labels) == 0 && is.numeric(item)) {
item <- haven::zap_labels(item)
}
}
item_nomiss <- item[!is.na(item)]
# unnest mc_multiple and so on
if (
is.character(item_nomiss) &&
stringr::str_detect(item_nomiss, stringr::fixed(", ")) &&
(exists("type", item_info) &&
stringr::str_detect(item_info$type, pattern = stringr::fixed("multiple")))
) {
item_nomiss <- unlist(stringr::str_split(item_nomiss, pattern = stringr::fixed(", ")))
}
attributes(item_nomiss) <- attributes(item)
old_height <- knitr::opts_chunk$get("fig.height")
non_missing_choices <- item_attributes[["labels"]]
many_labels <- length(non_missing_choices) > 7
go_vertical <- !is.numeric(item_nomiss) || many_labels
if ( go_vertical ) {
# numeric items are plotted horizontally (because that's what usually expected)
# categorical items are plotted vertically because we can use the screen real estate better this way
if (is.null(choices) ||
dplyr::n_distinct(item_nomiss) > length(non_missing_choices)) {
non_missing_choices <- unique(item_nomiss)
names(non_missing_choices) <- non_missing_choices
}
choice_multiplier <- old_height/6.5
new_height <- 2 + choice_multiplier * length(non_missing_choices)
new_height <- ifelse(new_height > 20, 20, new_height)
new_height <- ifelse(new_height < 1, 1, new_height)
knitr::opts_chunk$set(fig.height = new_height)
}
wrap_at <- knitr::opts_chunk$get("fig.width") * 10# todo: if there are free-text choices mingled in with the pre-defined ones, don't show
# todo: show rare items if they are pre-defined
# todo: bin rare responses into "other category"
if (!length(item_nomiss)) {
cat("No non-missing values to show.")
} else if (is.numeric(item_nomiss) || dplyr::n_distinct(item_nomiss) < 20) {
plot_labelled(item_nomiss, item_name, wrap_at, go_vertical)
} else {
cat(dplyr::n_distinct(item_nomiss), " unique, categorical values, so not shown.")
}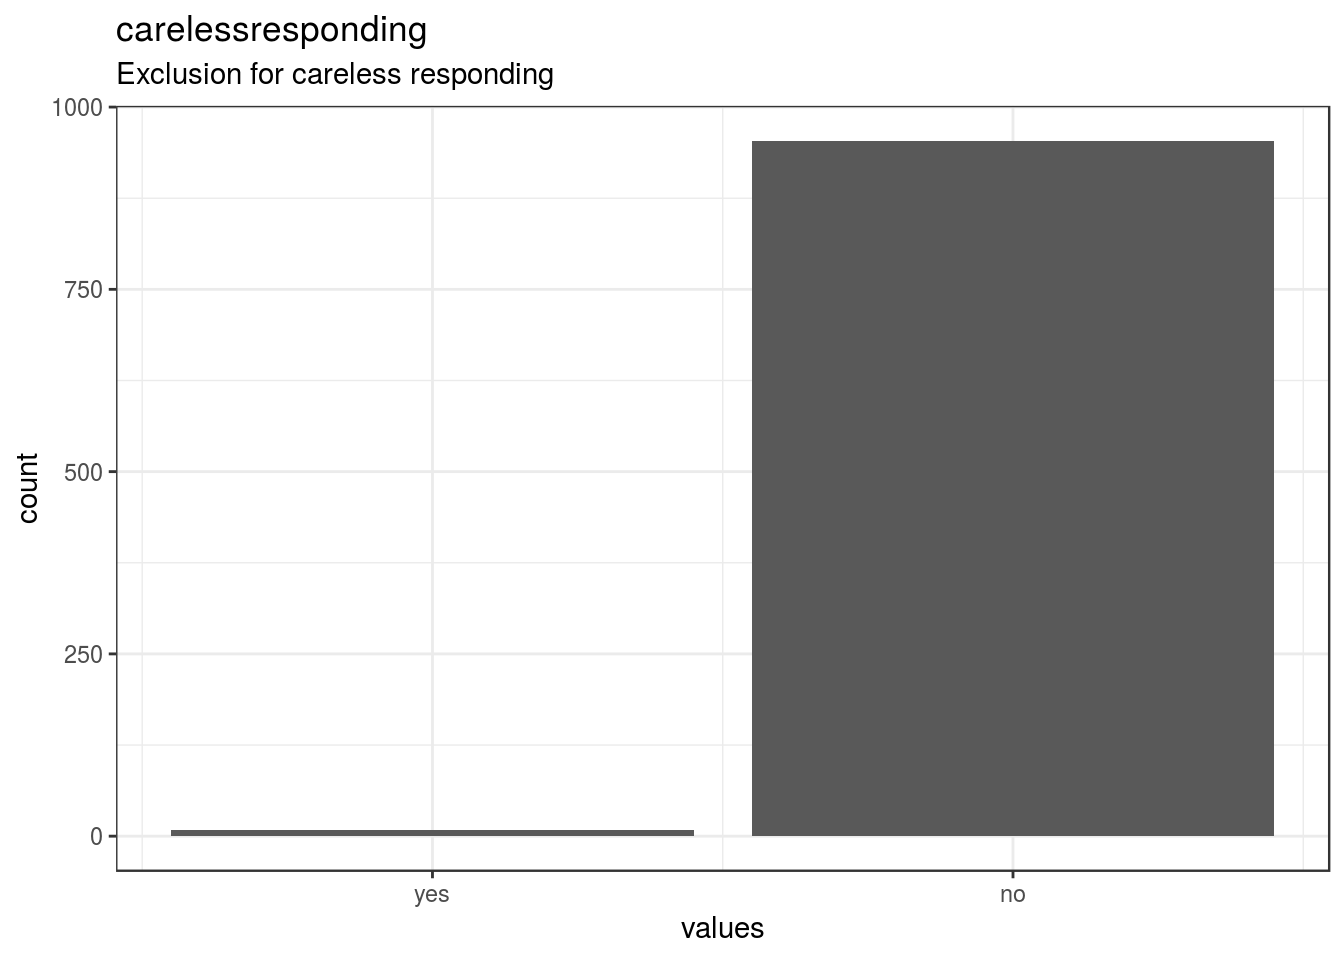
knitr::opts_chunk$set(fig.height = old_height)1043 missing values.
Summary statistics
attributes(item) <- item_attributes
df = data.frame(item, stringsAsFactors = FALSE)
names(df) = html_item_name
escaped_table(codebook_table(df))| name | label | data_type | value_labels | missing | complete | n | mean | sd | p0 | p25 | p50 | p75 | p100 | hist | format.spss |
|---|---|---|---|---|---|---|---|---|---|---|---|---|---|---|---|
| carelessresponding | Exclusion for careless responding | numeric | 0. yes, 1. no |
1043 | 963 | 2006 | 0.99 | 0.096 | 0 | 1 | 1 | 1 | 1 | ▁▁▁▁▁▁▁▇ | F8.0 |
if (show_missing_values) {
plot_labelled(missing_values, item_name, wrap_at)
}if (!is.null(item_info)) {
# don't show choices again, if they're basically same thing as value labels
if (!is.null(choices) && !is.null(item_info$choices) &&
all(names(na.omit(choices)) == item_info$choices) &&
all(na.omit(choices) == names(item_info$choices))) {
item_info$choices <- NULL
}
item_info$label_parsed <-
item_info$choice_list <- item_info$study_id <- item_info$id <- NULL
pander::pander(item_info)
}Value labels
if (!is.null(choices) && length(choices) && length(choices) < 30) {
pander::pander(as.list(choices))
}- yes: 0
- no: 1
AttentionCheck
“Please select”7 Always" if you are paying attention."
Distribution
show_missing_values <- FALSE
if (has_labels(item)) {
missing_values <- item[is.na(haven::zap_missing(item))]
attributes(missing_values) <- attributes(item)
if (!is.null(attributes(item)$labels)) {
attributes(missing_values)$labels <- attributes(missing_values)$labels[is.na(attributes(missing_values)$labels)]
attributes(item)$labels <- attributes(item)$labels[!is.na(attributes(item)$labels)]
}
if (is.double(item)) {
show_missing_values <- length(unique(haven::na_tag(missing_values))) > 1
item <- haven::zap_missing(item)
}
if (length(item_attributes$labels) == 0 && is.numeric(item)) {
item <- haven::zap_labels(item)
}
}
item_nomiss <- item[!is.na(item)]
# unnest mc_multiple and so on
if (
is.character(item_nomiss) &&
stringr::str_detect(item_nomiss, stringr::fixed(", ")) &&
(exists("type", item_info) &&
stringr::str_detect(item_info$type, pattern = stringr::fixed("multiple")))
) {
item_nomiss <- unlist(stringr::str_split(item_nomiss, pattern = stringr::fixed(", ")))
}
attributes(item_nomiss) <- attributes(item)
old_height <- knitr::opts_chunk$get("fig.height")
non_missing_choices <- item_attributes[["labels"]]
many_labels <- length(non_missing_choices) > 7
go_vertical <- !is.numeric(item_nomiss) || many_labels
if ( go_vertical ) {
# numeric items are plotted horizontally (because that's what usually expected)
# categorical items are plotted vertically because we can use the screen real estate better this way
if (is.null(choices) ||
dplyr::n_distinct(item_nomiss) > length(non_missing_choices)) {
non_missing_choices <- unique(item_nomiss)
names(non_missing_choices) <- non_missing_choices
}
choice_multiplier <- old_height/6.5
new_height <- 2 + choice_multiplier * length(non_missing_choices)
new_height <- ifelse(new_height > 20, 20, new_height)
new_height <- ifelse(new_height < 1, 1, new_height)
knitr::opts_chunk$set(fig.height = new_height)
}
wrap_at <- knitr::opts_chunk$get("fig.width") * 10# todo: if there are free-text choices mingled in with the pre-defined ones, don't show
# todo: show rare items if they are pre-defined
# todo: bin rare responses into "other category"
if (!length(item_nomiss)) {
cat("No non-missing values to show.")
} else if (is.numeric(item_nomiss) || dplyr::n_distinct(item_nomiss) < 20) {
plot_labelled(item_nomiss, item_name, wrap_at, go_vertical)
} else {
cat(dplyr::n_distinct(item_nomiss), " unique, categorical values, so not shown.")
}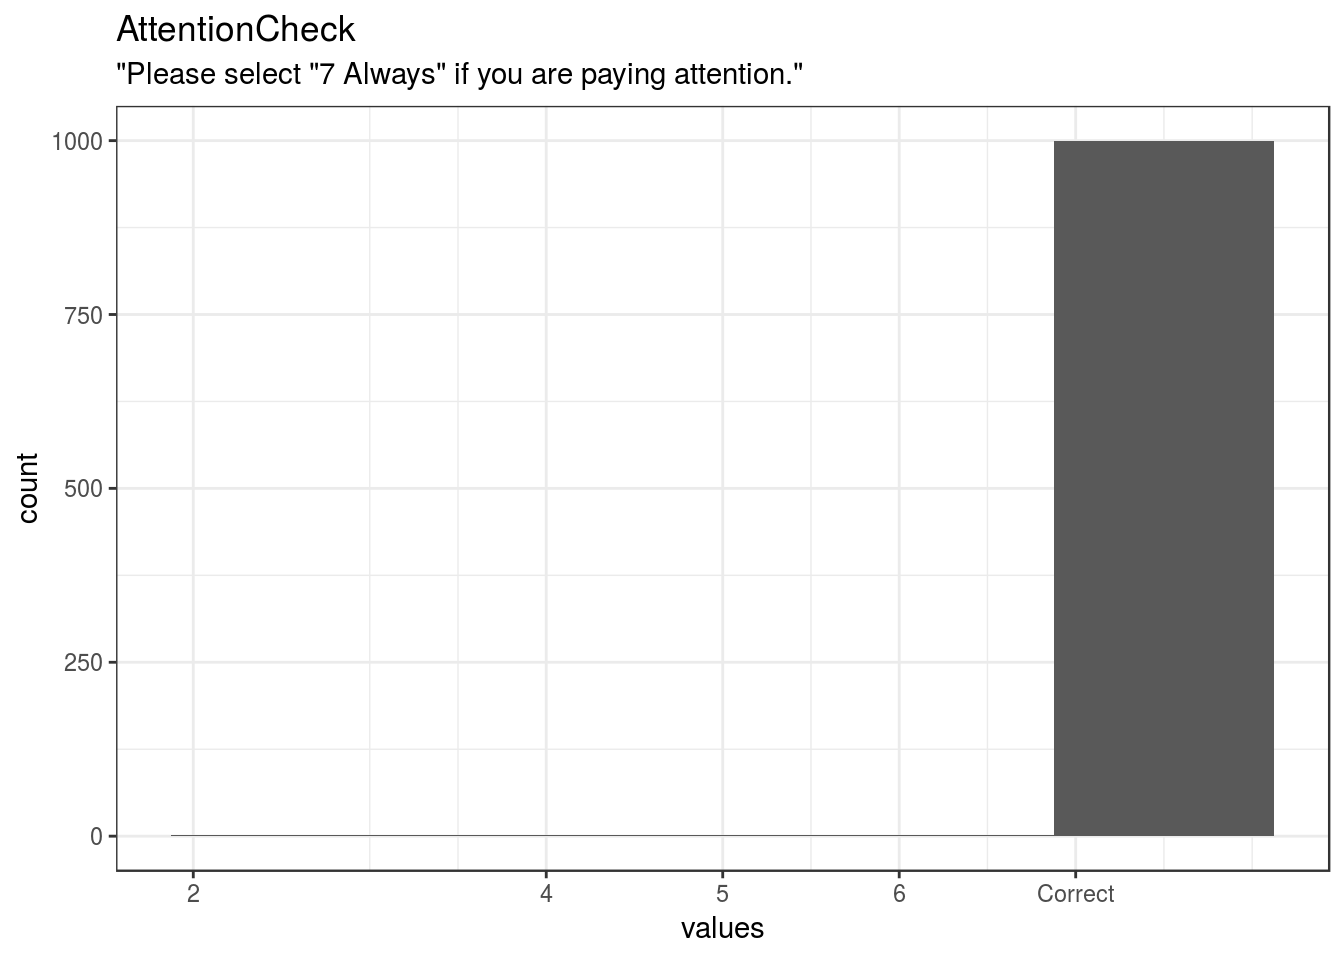
knitr::opts_chunk$set(fig.height = old_height)999 missing values.
Summary statistics
attributes(item) <- item_attributes
df = data.frame(item, stringsAsFactors = FALSE)
names(df) = html_item_name
escaped_table(codebook_table(df))| name | label | data_type | value_labels | missing | complete | n | mean | sd | p0 | p25 | p50 | p75 | p100 | hist | format.spss |
|---|---|---|---|---|---|---|---|---|---|---|---|---|---|---|---|
| AttentionCheck | “Please select”7 Always" if you are paying attention." | numeric | 7. Correct | 999 | 1007 | 2006 | 6.98 | 0.23 | 2 | 7 | 7 | 7 | 7 | ▁▁▁▁▁▁▁▇ | F8.0 |
if (show_missing_values) {
plot_labelled(missing_values, item_name, wrap_at)
}if (!is.null(item_info)) {
# don't show choices again, if they're basically same thing as value labels
if (!is.null(choices) && !is.null(item_info$choices) &&
all(names(na.omit(choices)) == item_info$choices) &&
all(na.omit(choices) == names(item_info$choices))) {
item_info$choices <- NULL
}
item_info$label_parsed <-
item_info$choice_list <- item_info$study_id <- item_info$id <- NULL
pander::pander(item_info)
}Value labels
if (!is.null(choices) && length(choices) && length(choices) < 30) {
pander::pander(as.list(choices))
}- Correct: 7
attentioncheckpf
Exclusion based on attention check
Distribution
show_missing_values <- FALSE
if (has_labels(item)) {
missing_values <- item[is.na(haven::zap_missing(item))]
attributes(missing_values) <- attributes(item)
if (!is.null(attributes(item)$labels)) {
attributes(missing_values)$labels <- attributes(missing_values)$labels[is.na(attributes(missing_values)$labels)]
attributes(item)$labels <- attributes(item)$labels[!is.na(attributes(item)$labels)]
}
if (is.double(item)) {
show_missing_values <- length(unique(haven::na_tag(missing_values))) > 1
item <- haven::zap_missing(item)
}
if (length(item_attributes$labels) == 0 && is.numeric(item)) {
item <- haven::zap_labels(item)
}
}
item_nomiss <- item[!is.na(item)]
# unnest mc_multiple and so on
if (
is.character(item_nomiss) &&
stringr::str_detect(item_nomiss, stringr::fixed(", ")) &&
(exists("type", item_info) &&
stringr::str_detect(item_info$type, pattern = stringr::fixed("multiple")))
) {
item_nomiss <- unlist(stringr::str_split(item_nomiss, pattern = stringr::fixed(", ")))
}
attributes(item_nomiss) <- attributes(item)
old_height <- knitr::opts_chunk$get("fig.height")
non_missing_choices <- item_attributes[["labels"]]
many_labels <- length(non_missing_choices) > 7
go_vertical <- !is.numeric(item_nomiss) || many_labels
if ( go_vertical ) {
# numeric items are plotted horizontally (because that's what usually expected)
# categorical items are plotted vertically because we can use the screen real estate better this way
if (is.null(choices) ||
dplyr::n_distinct(item_nomiss) > length(non_missing_choices)) {
non_missing_choices <- unique(item_nomiss)
names(non_missing_choices) <- non_missing_choices
}
choice_multiplier <- old_height/6.5
new_height <- 2 + choice_multiplier * length(non_missing_choices)
new_height <- ifelse(new_height > 20, 20, new_height)
new_height <- ifelse(new_height < 1, 1, new_height)
knitr::opts_chunk$set(fig.height = new_height)
}
wrap_at <- knitr::opts_chunk$get("fig.width") * 10# todo: if there are free-text choices mingled in with the pre-defined ones, don't show
# todo: show rare items if they are pre-defined
# todo: bin rare responses into "other category"
if (!length(item_nomiss)) {
cat("No non-missing values to show.")
} else if (is.numeric(item_nomiss) || dplyr::n_distinct(item_nomiss) < 20) {
plot_labelled(item_nomiss, item_name, wrap_at, go_vertical)
} else {
cat(dplyr::n_distinct(item_nomiss), " unique, categorical values, so not shown.")
}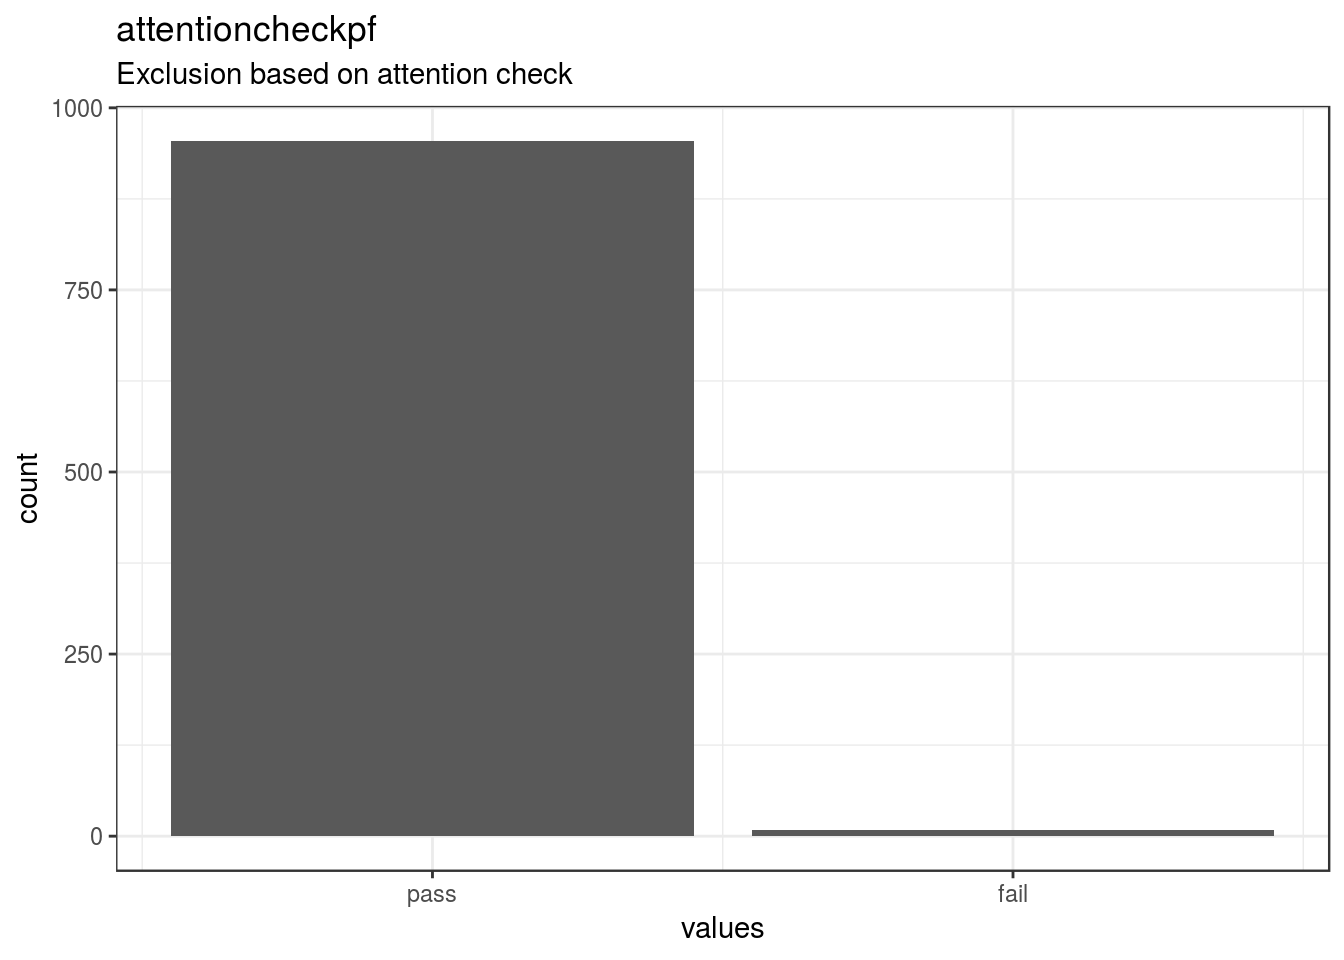
knitr::opts_chunk$set(fig.height = old_height)1042 missing values.
Summary statistics
attributes(item) <- item_attributes
df = data.frame(item, stringsAsFactors = FALSE)
names(df) = html_item_name
escaped_table(codebook_table(df))| name | label | data_type | value_labels | missing | complete | n | mean | sd | p0 | p25 | p50 | p75 | p100 | hist | format.spss |
|---|---|---|---|---|---|---|---|---|---|---|---|---|---|---|---|
| attentioncheckpf | Exclusion based on attention check | numeric | 0. pass, 1. fail |
1042 | 964 | 2006 | 0.0093 | 0.096 | 0 | 0 | 0 | 0 | 1 | ▇▁▁▁▁▁▁▁ | F8.0 |
if (show_missing_values) {
plot_labelled(missing_values, item_name, wrap_at)
}if (!is.null(item_info)) {
# don't show choices again, if they're basically same thing as value labels
if (!is.null(choices) && !is.null(item_info$choices) &&
all(names(na.omit(choices)) == item_info$choices) &&
all(na.omit(choices) == names(item_info$choices))) {
item_info$choices <- NULL
}
item_info$label_parsed <-
item_info$choice_list <- item_info$study_id <- item_info$id <- NULL
pander::pander(item_info)
}Value labels
if (!is.null(choices) && length(choices) && length(choices) < 30) {
pander::pander(as.list(choices))
}- pass: 0
- fail: 1
targetphoto
Which target photo participant viewed
Distribution
show_missing_values <- FALSE
if (has_labels(item)) {
missing_values <- item[is.na(haven::zap_missing(item))]
attributes(missing_values) <- attributes(item)
if (!is.null(attributes(item)$labels)) {
attributes(missing_values)$labels <- attributes(missing_values)$labels[is.na(attributes(missing_values)$labels)]
attributes(item)$labels <- attributes(item)$labels[!is.na(attributes(item)$labels)]
}
if (is.double(item)) {
show_missing_values <- length(unique(haven::na_tag(missing_values))) > 1
item <- haven::zap_missing(item)
}
if (length(item_attributes$labels) == 0 && is.numeric(item)) {
item <- haven::zap_labels(item)
}
}
item_nomiss <- item[!is.na(item)]
# unnest mc_multiple and so on
if (
is.character(item_nomiss) &&
stringr::str_detect(item_nomiss, stringr::fixed(", ")) &&
(exists("type", item_info) &&
stringr::str_detect(item_info$type, pattern = stringr::fixed("multiple")))
) {
item_nomiss <- unlist(stringr::str_split(item_nomiss, pattern = stringr::fixed(", ")))
}
attributes(item_nomiss) <- attributes(item)
old_height <- knitr::opts_chunk$get("fig.height")
non_missing_choices <- item_attributes[["labels"]]
many_labels <- length(non_missing_choices) > 7
go_vertical <- !is.numeric(item_nomiss) || many_labels
if ( go_vertical ) {
# numeric items are plotted horizontally (because that's what usually expected)
# categorical items are plotted vertically because we can use the screen real estate better this way
if (is.null(choices) ||
dplyr::n_distinct(item_nomiss) > length(non_missing_choices)) {
non_missing_choices <- unique(item_nomiss)
names(non_missing_choices) <- non_missing_choices
}
choice_multiplier <- old_height/6.5
new_height <- 2 + choice_multiplier * length(non_missing_choices)
new_height <- ifelse(new_height > 20, 20, new_height)
new_height <- ifelse(new_height < 1, 1, new_height)
knitr::opts_chunk$set(fig.height = new_height)
}
wrap_at <- knitr::opts_chunk$get("fig.width") * 10# todo: if there are free-text choices mingled in with the pre-defined ones, don't show
# todo: show rare items if they are pre-defined
# todo: bin rare responses into "other category"
if (!length(item_nomiss)) {
cat("No non-missing values to show.")
} else if (is.numeric(item_nomiss) || dplyr::n_distinct(item_nomiss) < 20) {
plot_labelled(item_nomiss, item_name, wrap_at, go_vertical)
} else {
cat(dplyr::n_distinct(item_nomiss), " unique, categorical values, so not shown.")
}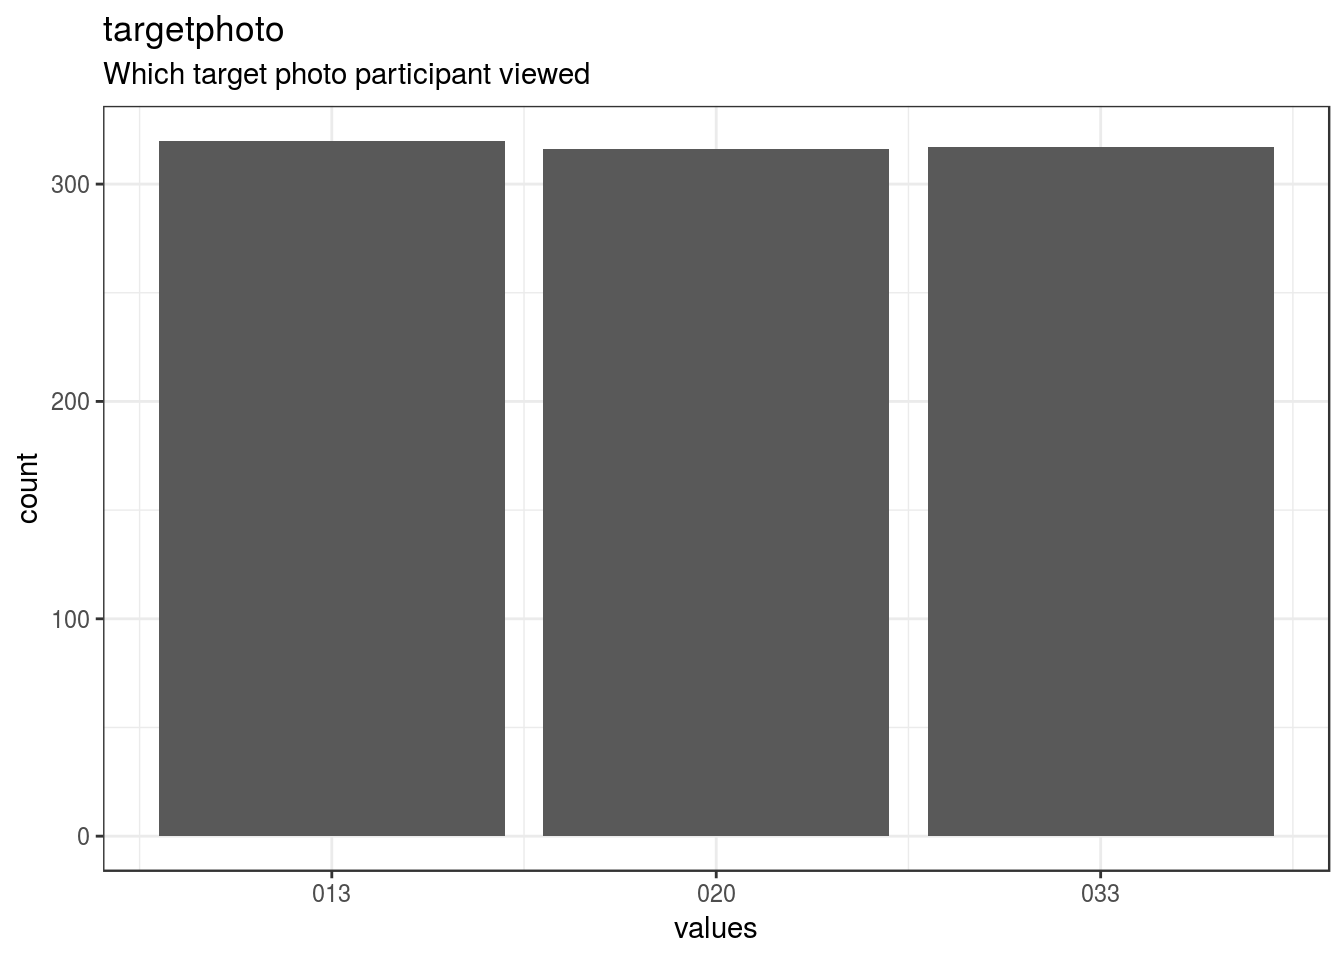
knitr::opts_chunk$set(fig.height = old_height)1053 missing values.
Summary statistics
attributes(item) <- item_attributes
df = data.frame(item, stringsAsFactors = FALSE)
names(df) = html_item_name
escaped_table(codebook_table(df))| name | label | data_type | value_labels | missing | complete | n | mean | sd | p0 | p25 | p50 | p75 | p100 | hist | format.spss |
|---|---|---|---|---|---|---|---|---|---|---|---|---|---|---|---|
| targetphoto | Which target photo participant viewed | numeric | 0. 013, 1. 020, 2. 033 |
1053 | 953 | 2006 | 1 | 0.82 | 0 | 0 | 1 | 2 | 2 | ▇▁▁▇▁▁▁▇ | F8.0 |
if (show_missing_values) {
plot_labelled(missing_values, item_name, wrap_at)
}if (!is.null(item_info)) {
# don't show choices again, if they're basically same thing as value labels
if (!is.null(choices) && !is.null(item_info$choices) &&
all(names(na.omit(choices)) == item_info$choices) &&
all(na.omit(choices) == names(item_info$choices))) {
item_info$choices <- NULL
}
item_info$label_parsed <-
item_info$choice_list <- item_info$study_id <- item_info$id <- NULL
pander::pander(item_info)
}Value labels
if (!is.null(choices) && length(choices) && length(choices) < 30) {
pander::pander(as.list(choices))
}- 013: 0
- 020: 1
- 033: 2
targetnationality
Which target nationality was used
Distribution
show_missing_values <- FALSE
if (has_labels(item)) {
missing_values <- item[is.na(haven::zap_missing(item))]
attributes(missing_values) <- attributes(item)
if (!is.null(attributes(item)$labels)) {
attributes(missing_values)$labels <- attributes(missing_values)$labels[is.na(attributes(missing_values)$labels)]
attributes(item)$labels <- attributes(item)$labels[!is.na(attributes(item)$labels)]
}
if (is.double(item)) {
show_missing_values <- length(unique(haven::na_tag(missing_values))) > 1
item <- haven::zap_missing(item)
}
if (length(item_attributes$labels) == 0 && is.numeric(item)) {
item <- haven::zap_labels(item)
}
}
item_nomiss <- item[!is.na(item)]
# unnest mc_multiple and so on
if (
is.character(item_nomiss) &&
stringr::str_detect(item_nomiss, stringr::fixed(", ")) &&
(exists("type", item_info) &&
stringr::str_detect(item_info$type, pattern = stringr::fixed("multiple")))
) {
item_nomiss <- unlist(stringr::str_split(item_nomiss, pattern = stringr::fixed(", ")))
}
attributes(item_nomiss) <- attributes(item)
old_height <- knitr::opts_chunk$get("fig.height")
non_missing_choices <- item_attributes[["labels"]]
many_labels <- length(non_missing_choices) > 7
go_vertical <- !is.numeric(item_nomiss) || many_labels
if ( go_vertical ) {
# numeric items are plotted horizontally (because that's what usually expected)
# categorical items are plotted vertically because we can use the screen real estate better this way
if (is.null(choices) ||
dplyr::n_distinct(item_nomiss) > length(non_missing_choices)) {
non_missing_choices <- unique(item_nomiss)
names(non_missing_choices) <- non_missing_choices
}
choice_multiplier <- old_height/6.5
new_height <- 2 + choice_multiplier * length(non_missing_choices)
new_height <- ifelse(new_height > 20, 20, new_height)
new_height <- ifelse(new_height < 1, 1, new_height)
knitr::opts_chunk$set(fig.height = new_height)
}
wrap_at <- knitr::opts_chunk$get("fig.width") * 10# todo: if there are free-text choices mingled in with the pre-defined ones, don't show
# todo: show rare items if they are pre-defined
# todo: bin rare responses into "other category"
if (!length(item_nomiss)) {
cat("No non-missing values to show.")
} else if (is.numeric(item_nomiss) || dplyr::n_distinct(item_nomiss) < 20) {
plot_labelled(item_nomiss, item_name, wrap_at, go_vertical)
} else {
cat(dplyr::n_distinct(item_nomiss), " unique, categorical values, so not shown.")
}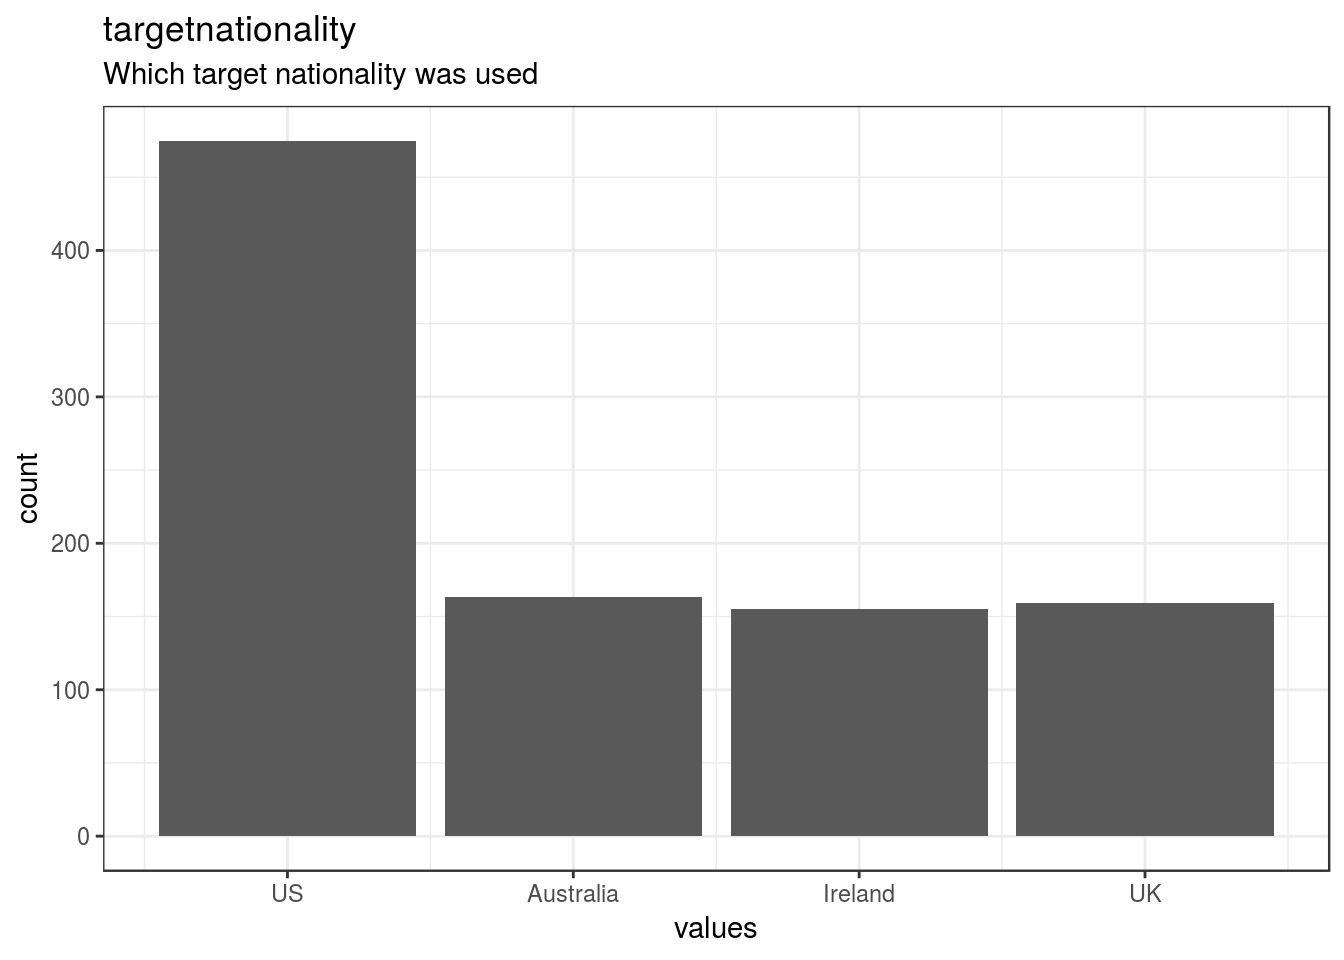
knitr::opts_chunk$set(fig.height = old_height)1054 missing values.
Summary statistics
attributes(item) <- item_attributes
df = data.frame(item, stringsAsFactors = FALSE)
names(df) = html_item_name
escaped_table(codebook_table(df))| name | label | data_type | value_labels | missing | complete | n | mean | sd | p0 | p25 | p50 | p75 | p100 | hist | format.spss |
|---|---|---|---|---|---|---|---|---|---|---|---|---|---|---|---|
| targetnationality | Which target nationality was used | numeric | 0. US, 1. Australia, 2. Ireland, 3. UK |
1054 | 952 | 2006 | 1 | 1.15 | 0 | 0 | 1 | 2 | 3 | ▇▁▃▁▁▂▁▃ | F8.0 |
if (show_missing_values) {
plot_labelled(missing_values, item_name, wrap_at)
}if (!is.null(item_info)) {
# don't show choices again, if they're basically same thing as value labels
if (!is.null(choices) && !is.null(item_info$choices) &&
all(names(na.omit(choices)) == item_info$choices) &&
all(na.omit(choices) == names(item_info$choices))) {
item_info$choices <- NULL
}
item_info$label_parsed <-
item_info$choice_list <- item_info$study_id <- item_info$id <- NULL
pander::pander(item_info)
}Value labels
if (!is.null(choices) && length(choices) && length(choices) < 30) {
pander::pander(as.list(choices))
}- US: 0
- Australia: 1
- Ireland: 2
- UK: 3
completedsurvey
Survey completed?
Distribution
show_missing_values <- FALSE
if (has_labels(item)) {
missing_values <- item[is.na(haven::zap_missing(item))]
attributes(missing_values) <- attributes(item)
if (!is.null(attributes(item)$labels)) {
attributes(missing_values)$labels <- attributes(missing_values)$labels[is.na(attributes(missing_values)$labels)]
attributes(item)$labels <- attributes(item)$labels[!is.na(attributes(item)$labels)]
}
if (is.double(item)) {
show_missing_values <- length(unique(haven::na_tag(missing_values))) > 1
item <- haven::zap_missing(item)
}
if (length(item_attributes$labels) == 0 && is.numeric(item)) {
item <- haven::zap_labels(item)
}
}
item_nomiss <- item[!is.na(item)]
# unnest mc_multiple and so on
if (
is.character(item_nomiss) &&
stringr::str_detect(item_nomiss, stringr::fixed(", ")) &&
(exists("type", item_info) &&
stringr::str_detect(item_info$type, pattern = stringr::fixed("multiple")))
) {
item_nomiss <- unlist(stringr::str_split(item_nomiss, pattern = stringr::fixed(", ")))
}
attributes(item_nomiss) <- attributes(item)
old_height <- knitr::opts_chunk$get("fig.height")
non_missing_choices <- item_attributes[["labels"]]
many_labels <- length(non_missing_choices) > 7
go_vertical <- !is.numeric(item_nomiss) || many_labels
if ( go_vertical ) {
# numeric items are plotted horizontally (because that's what usually expected)
# categorical items are plotted vertically because we can use the screen real estate better this way
if (is.null(choices) ||
dplyr::n_distinct(item_nomiss) > length(non_missing_choices)) {
non_missing_choices <- unique(item_nomiss)
names(non_missing_choices) <- non_missing_choices
}
choice_multiplier <- old_height/6.5
new_height <- 2 + choice_multiplier * length(non_missing_choices)
new_height <- ifelse(new_height > 20, 20, new_height)
new_height <- ifelse(new_height < 1, 1, new_height)
knitr::opts_chunk$set(fig.height = new_height)
}
wrap_at <- knitr::opts_chunk$get("fig.width") * 10# todo: if there are free-text choices mingled in with the pre-defined ones, don't show
# todo: show rare items if they are pre-defined
# todo: bin rare responses into "other category"
if (!length(item_nomiss)) {
cat("No non-missing values to show.")
} else if (is.numeric(item_nomiss) || dplyr::n_distinct(item_nomiss) < 20) {
plot_labelled(item_nomiss, item_name, wrap_at, go_vertical)
} else {
cat(dplyr::n_distinct(item_nomiss), " unique, categorical values, so not shown.")
}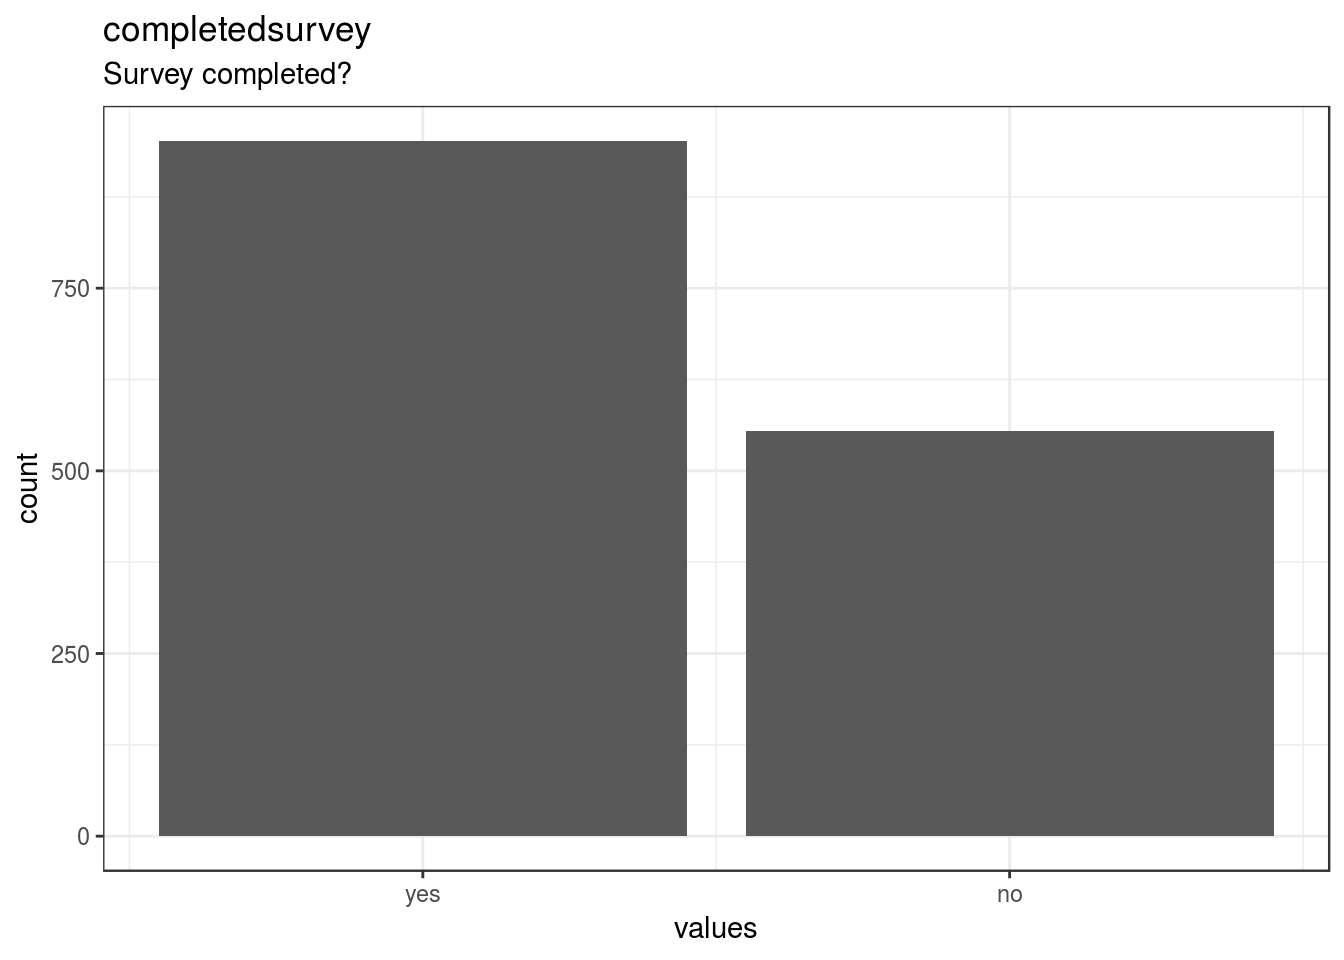
knitr::opts_chunk$set(fig.height = old_height)499 missing values.
Summary statistics
attributes(item) <- item_attributes
df = data.frame(item, stringsAsFactors = FALSE)
names(df) = html_item_name
escaped_table(codebook_table(df))| name | label | data_type | value_labels | missing | complete | n | mean | sd | p0 | p25 | p50 | p75 | p100 | hist | format.spss |
|---|---|---|---|---|---|---|---|---|---|---|---|---|---|---|---|
| completedsurvey | Survey completed? | numeric | 0. yes, 1. no |
499 | 1507 | 2006 | 0.37 | 0.48 | 0 | 0 | 0 | 1 | 1 | ▇▁▁▁▁▁▁▅ | F8.0 |
if (show_missing_values) {
plot_labelled(missing_values, item_name, wrap_at)
}if (!is.null(item_info)) {
# don't show choices again, if they're basically same thing as value labels
if (!is.null(choices) && !is.null(item_info$choices) &&
all(names(na.omit(choices)) == item_info$choices) &&
all(na.omit(choices) == names(item_info$choices))) {
item_info$choices <- NULL
}
item_info$label_parsed <-
item_info$choice_list <- item_info$study_id <- item_info$id <- NULL
pander::pander(item_info)
}Value labels
if (!is.null(choices) && length(choices) && length(choices) < 30) {
pander::pander(as.list(choices))
}- yes: 0
- no: 1
compensated
Paid for participation?
Distribution
show_missing_values <- FALSE
if (has_labels(item)) {
missing_values <- item[is.na(haven::zap_missing(item))]
attributes(missing_values) <- attributes(item)
if (!is.null(attributes(item)$labels)) {
attributes(missing_values)$labels <- attributes(missing_values)$labels[is.na(attributes(missing_values)$labels)]
attributes(item)$labels <- attributes(item)$labels[!is.na(attributes(item)$labels)]
}
if (is.double(item)) {
show_missing_values <- length(unique(haven::na_tag(missing_values))) > 1
item <- haven::zap_missing(item)
}
if (length(item_attributes$labels) == 0 && is.numeric(item)) {
item <- haven::zap_labels(item)
}
}
item_nomiss <- item[!is.na(item)]
# unnest mc_multiple and so on
if (
is.character(item_nomiss) &&
stringr::str_detect(item_nomiss, stringr::fixed(", ")) &&
(exists("type", item_info) &&
stringr::str_detect(item_info$type, pattern = stringr::fixed("multiple")))
) {
item_nomiss <- unlist(stringr::str_split(item_nomiss, pattern = stringr::fixed(", ")))
}
attributes(item_nomiss) <- attributes(item)
old_height <- knitr::opts_chunk$get("fig.height")
non_missing_choices <- item_attributes[["labels"]]
many_labels <- length(non_missing_choices) > 7
go_vertical <- !is.numeric(item_nomiss) || many_labels
if ( go_vertical ) {
# numeric items are plotted horizontally (because that's what usually expected)
# categorical items are plotted vertically because we can use the screen real estate better this way
if (is.null(choices) ||
dplyr::n_distinct(item_nomiss) > length(non_missing_choices)) {
non_missing_choices <- unique(item_nomiss)
names(non_missing_choices) <- non_missing_choices
}
choice_multiplier <- old_height/6.5
new_height <- 2 + choice_multiplier * length(non_missing_choices)
new_height <- ifelse(new_height > 20, 20, new_height)
new_height <- ifelse(new_height < 1, 1, new_height)
knitr::opts_chunk$set(fig.height = new_height)
}
wrap_at <- knitr::opts_chunk$get("fig.width") * 10# todo: if there are free-text choices mingled in with the pre-defined ones, don't show
# todo: show rare items if they are pre-defined
# todo: bin rare responses into "other category"
if (!length(item_nomiss)) {
cat("No non-missing values to show.")
} else if (is.numeric(item_nomiss) || dplyr::n_distinct(item_nomiss) < 20) {
plot_labelled(item_nomiss, item_name, wrap_at, go_vertical)
} else {
cat(dplyr::n_distinct(item_nomiss), " unique, categorical values, so not shown.")
}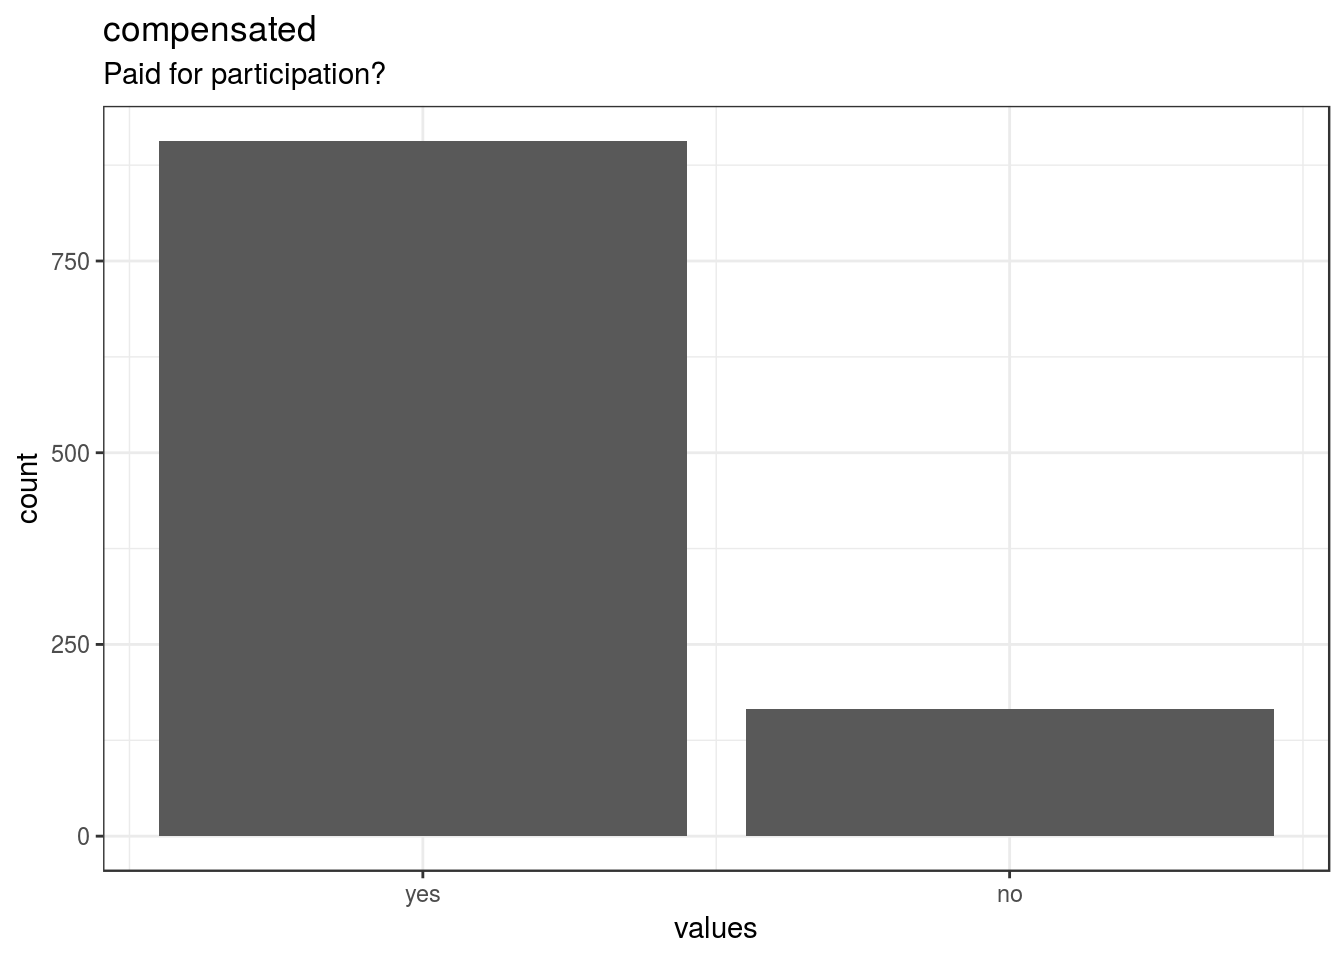
knitr::opts_chunk$set(fig.height = old_height)933 missing values.
Summary statistics
attributes(item) <- item_attributes
df = data.frame(item, stringsAsFactors = FALSE)
names(df) = html_item_name
escaped_table(codebook_table(df))| name | label | data_type | value_labels | missing | complete | n | mean | sd | p0 | p25 | p50 | p75 | p100 | hist | format.spss | display_width |
|---|---|---|---|---|---|---|---|---|---|---|---|---|---|---|---|---|
| compensated | Paid for participation? | numeric | 0. yes, 1. no |
933 | 1073 | 2006 | 0.15 | 0.36 | 0 | 0 | 0 | 0 | 1 | ▇▁▁▁▁▁▁▂ | F8.0 | 12 |
if (show_missing_values) {
plot_labelled(missing_values, item_name, wrap_at)
}if (!is.null(item_info)) {
# don't show choices again, if they're basically same thing as value labels
if (!is.null(choices) && !is.null(item_info$choices) &&
all(names(na.omit(choices)) == item_info$choices) &&
all(na.omit(choices) == names(item_info$choices))) {
item_info$choices <- NULL
}
item_info$label_parsed <-
item_info$choice_list <- item_info$study_id <- item_info$id <- NULL
pander::pander(item_info)
}Value labels
if (!is.null(choices) && length(choices) && length(choices) < 30) {
pander::pander(as.list(choices))
}- yes: 0
- no: 1
race_1
What is your race/ethnicity? (please check all that apply)-Black or African American
Distribution
show_missing_values <- FALSE
if (has_labels(item)) {
missing_values <- item[is.na(haven::zap_missing(item))]
attributes(missing_values) <- attributes(item)
if (!is.null(attributes(item)$labels)) {
attributes(missing_values)$labels <- attributes(missing_values)$labels[is.na(attributes(missing_values)$labels)]
attributes(item)$labels <- attributes(item)$labels[!is.na(attributes(item)$labels)]
}
if (is.double(item)) {
show_missing_values <- length(unique(haven::na_tag(missing_values))) > 1
item <- haven::zap_missing(item)
}
if (length(item_attributes$labels) == 0 && is.numeric(item)) {
item <- haven::zap_labels(item)
}
}
item_nomiss <- item[!is.na(item)]
# unnest mc_multiple and so on
if (
is.character(item_nomiss) &&
stringr::str_detect(item_nomiss, stringr::fixed(", ")) &&
(exists("type", item_info) &&
stringr::str_detect(item_info$type, pattern = stringr::fixed("multiple")))
) {
item_nomiss <- unlist(stringr::str_split(item_nomiss, pattern = stringr::fixed(", ")))
}
attributes(item_nomiss) <- attributes(item)
old_height <- knitr::opts_chunk$get("fig.height")
non_missing_choices <- item_attributes[["labels"]]
many_labels <- length(non_missing_choices) > 7
go_vertical <- !is.numeric(item_nomiss) || many_labels
if ( go_vertical ) {
# numeric items are plotted horizontally (because that's what usually expected)
# categorical items are plotted vertically because we can use the screen real estate better this way
if (is.null(choices) ||
dplyr::n_distinct(item_nomiss) > length(non_missing_choices)) {
non_missing_choices <- unique(item_nomiss)
names(non_missing_choices) <- non_missing_choices
}
choice_multiplier <- old_height/6.5
new_height <- 2 + choice_multiplier * length(non_missing_choices)
new_height <- ifelse(new_height > 20, 20, new_height)
new_height <- ifelse(new_height < 1, 1, new_height)
knitr::opts_chunk$set(fig.height = new_height)
}
wrap_at <- knitr::opts_chunk$get("fig.width") * 10# todo: if there are free-text choices mingled in with the pre-defined ones, don't show
# todo: show rare items if they are pre-defined
# todo: bin rare responses into "other category"
if (!length(item_nomiss)) {
cat("No non-missing values to show.")
} else if (is.numeric(item_nomiss) || dplyr::n_distinct(item_nomiss) < 20) {
plot_labelled(item_nomiss, item_name, wrap_at, go_vertical)
} else {
cat(dplyr::n_distinct(item_nomiss), " unique, categorical values, so not shown.")
}
knitr::opts_chunk$set(fig.height = old_height)1939 missing values.
Summary statistics
attributes(item) <- item_attributes
df = data.frame(item, stringsAsFactors = FALSE)
names(df) = html_item_name
escaped_table(codebook_table(df))| name | label | data_type | missing | complete | n | mean | sd | p0 | p25 | p50 | p75 | p100 | hist | format.spss |
|---|---|---|---|---|---|---|---|---|---|---|---|---|---|---|
| race_1 | What is your race/ethnicity? (please check all that apply)-Black or African American | numeric | 1939 | 67 | 2006 | 1 | 0 | 1 | 1 | 1 | 1 | 1 | ▁▁▁▇▁▁▁▁ | F8.0 |
if (show_missing_values) {
plot_labelled(missing_values, item_name, wrap_at)
}if (!is.null(item_info)) {
# don't show choices again, if they're basically same thing as value labels
if (!is.null(choices) && !is.null(item_info$choices) &&
all(names(na.omit(choices)) == item_info$choices) &&
all(na.omit(choices) == names(item_info$choices))) {
item_info$choices <- NULL
}
item_info$label_parsed <-
item_info$choice_list <- item_info$study_id <- item_info$id <- NULL
pander::pander(item_info)
}if (!is.null(choices) && length(choices) && length(choices) < 30) {
pander::pander(as.list(choices))
}race_2
What is your race/ethnicity? (please check all that apply)-White (Not Hispanic/Not Latino)
Distribution
show_missing_values <- FALSE
if (has_labels(item)) {
missing_values <- item[is.na(haven::zap_missing(item))]
attributes(missing_values) <- attributes(item)
if (!is.null(attributes(item)$labels)) {
attributes(missing_values)$labels <- attributes(missing_values)$labels[is.na(attributes(missing_values)$labels)]
attributes(item)$labels <- attributes(item)$labels[!is.na(attributes(item)$labels)]
}
if (is.double(item)) {
show_missing_values <- length(unique(haven::na_tag(missing_values))) > 1
item <- haven::zap_missing(item)
}
if (length(item_attributes$labels) == 0 && is.numeric(item)) {
item <- haven::zap_labels(item)
}
}
item_nomiss <- item[!is.na(item)]
# unnest mc_multiple and so on
if (
is.character(item_nomiss) &&
stringr::str_detect(item_nomiss, stringr::fixed(", ")) &&
(exists("type", item_info) &&
stringr::str_detect(item_info$type, pattern = stringr::fixed("multiple")))
) {
item_nomiss <- unlist(stringr::str_split(item_nomiss, pattern = stringr::fixed(", ")))
}
attributes(item_nomiss) <- attributes(item)
old_height <- knitr::opts_chunk$get("fig.height")
non_missing_choices <- item_attributes[["labels"]]
many_labels <- length(non_missing_choices) > 7
go_vertical <- !is.numeric(item_nomiss) || many_labels
if ( go_vertical ) {
# numeric items are plotted horizontally (because that's what usually expected)
# categorical items are plotted vertically because we can use the screen real estate better this way
if (is.null(choices) ||
dplyr::n_distinct(item_nomiss) > length(non_missing_choices)) {
non_missing_choices <- unique(item_nomiss)
names(non_missing_choices) <- non_missing_choices
}
choice_multiplier <- old_height/6.5
new_height <- 2 + choice_multiplier * length(non_missing_choices)
new_height <- ifelse(new_height > 20, 20, new_height)
new_height <- ifelse(new_height < 1, 1, new_height)
knitr::opts_chunk$set(fig.height = new_height)
}
wrap_at <- knitr::opts_chunk$get("fig.width") * 10# todo: if there are free-text choices mingled in with the pre-defined ones, don't show
# todo: show rare items if they are pre-defined
# todo: bin rare responses into "other category"
if (!length(item_nomiss)) {
cat("No non-missing values to show.")
} else if (is.numeric(item_nomiss) || dplyr::n_distinct(item_nomiss) < 20) {
plot_labelled(item_nomiss, item_name, wrap_at, go_vertical)
} else {
cat(dplyr::n_distinct(item_nomiss), " unique, categorical values, so not shown.")
}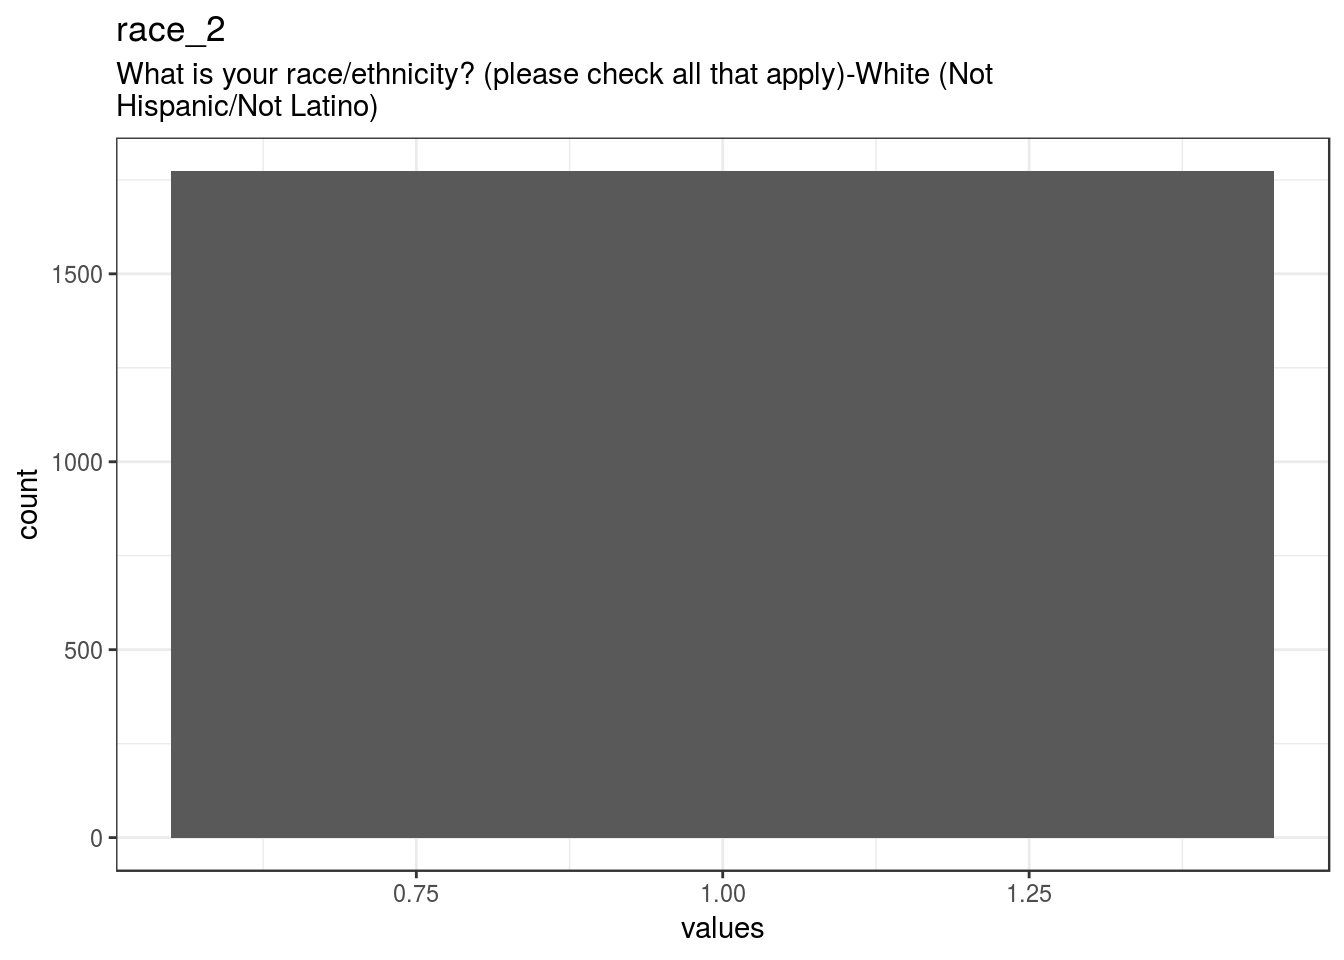
knitr::opts_chunk$set(fig.height = old_height)232 missing values.
Summary statistics
attributes(item) <- item_attributes
df = data.frame(item, stringsAsFactors = FALSE)
names(df) = html_item_name
escaped_table(codebook_table(df))| name | label | data_type | missing | complete | n | mean | sd | p0 | p25 | p50 | p75 | p100 | hist | format.spss |
|---|---|---|---|---|---|---|---|---|---|---|---|---|---|---|
| race_2 | What is your race/ethnicity? (please check all that apply)-White (Not Hispanic/Not Latino) | numeric | 232 | 1774 | 2006 | 1 | 0 | 1 | 1 | 1 | 1 | 1 | ▁▁▁▇▁▁▁▁ | F8.0 |
if (show_missing_values) {
plot_labelled(missing_values, item_name, wrap_at)
}if (!is.null(item_info)) {
# don't show choices again, if they're basically same thing as value labels
if (!is.null(choices) && !is.null(item_info$choices) &&
all(names(na.omit(choices)) == item_info$choices) &&
all(na.omit(choices) == names(item_info$choices))) {
item_info$choices <- NULL
}
item_info$label_parsed <-
item_info$choice_list <- item_info$study_id <- item_info$id <- NULL
pander::pander(item_info)
}if (!is.null(choices) && length(choices) && length(choices) < 30) {
pander::pander(as.list(choices))
}race_3
What is your race/ethnicity? (please check all that apply)-Hispanic or Latino
Distribution
show_missing_values <- FALSE
if (has_labels(item)) {
missing_values <- item[is.na(haven::zap_missing(item))]
attributes(missing_values) <- attributes(item)
if (!is.null(attributes(item)$labels)) {
attributes(missing_values)$labels <- attributes(missing_values)$labels[is.na(attributes(missing_values)$labels)]
attributes(item)$labels <- attributes(item)$labels[!is.na(attributes(item)$labels)]
}
if (is.double(item)) {
show_missing_values <- length(unique(haven::na_tag(missing_values))) > 1
item <- haven::zap_missing(item)
}
if (length(item_attributes$labels) == 0 && is.numeric(item)) {
item <- haven::zap_labels(item)
}
}
item_nomiss <- item[!is.na(item)]
# unnest mc_multiple and so on
if (
is.character(item_nomiss) &&
stringr::str_detect(item_nomiss, stringr::fixed(", ")) &&
(exists("type", item_info) &&
stringr::str_detect(item_info$type, pattern = stringr::fixed("multiple")))
) {
item_nomiss <- unlist(stringr::str_split(item_nomiss, pattern = stringr::fixed(", ")))
}
attributes(item_nomiss) <- attributes(item)
old_height <- knitr::opts_chunk$get("fig.height")
non_missing_choices <- item_attributes[["labels"]]
many_labels <- length(non_missing_choices) > 7
go_vertical <- !is.numeric(item_nomiss) || many_labels
if ( go_vertical ) {
# numeric items are plotted horizontally (because that's what usually expected)
# categorical items are plotted vertically because we can use the screen real estate better this way
if (is.null(choices) ||
dplyr::n_distinct(item_nomiss) > length(non_missing_choices)) {
non_missing_choices <- unique(item_nomiss)
names(non_missing_choices) <- non_missing_choices
}
choice_multiplier <- old_height/6.5
new_height <- 2 + choice_multiplier * length(non_missing_choices)
new_height <- ifelse(new_height > 20, 20, new_height)
new_height <- ifelse(new_height < 1, 1, new_height)
knitr::opts_chunk$set(fig.height = new_height)
}
wrap_at <- knitr::opts_chunk$get("fig.width") * 10# todo: if there are free-text choices mingled in with the pre-defined ones, don't show
# todo: show rare items if they are pre-defined
# todo: bin rare responses into "other category"
if (!length(item_nomiss)) {
cat("No non-missing values to show.")
} else if (is.numeric(item_nomiss) || dplyr::n_distinct(item_nomiss) < 20) {
plot_labelled(item_nomiss, item_name, wrap_at, go_vertical)
} else {
cat(dplyr::n_distinct(item_nomiss), " unique, categorical values, so not shown.")
}
knitr::opts_chunk$set(fig.height = old_height)1980 missing values.
Summary statistics
attributes(item) <- item_attributes
df = data.frame(item, stringsAsFactors = FALSE)
names(df) = html_item_name
escaped_table(codebook_table(df))| name | label | data_type | missing | complete | n | mean | sd | p0 | p25 | p50 | p75 | p100 | hist | format.spss |
|---|---|---|---|---|---|---|---|---|---|---|---|---|---|---|
| race_3 | What is your race/ethnicity? (please check all that apply)-Hispanic or Latino | numeric | 1980 | 26 | 2006 | 1 | 0 | 1 | 1 | 1 | 1 | 1 | ▁▁▁▇▁▁▁▁ | F8.0 |
if (show_missing_values) {
plot_labelled(missing_values, item_name, wrap_at)
}if (!is.null(item_info)) {
# don't show choices again, if they're basically same thing as value labels
if (!is.null(choices) && !is.null(item_info$choices) &&
all(names(na.omit(choices)) == item_info$choices) &&
all(na.omit(choices) == names(item_info$choices))) {
item_info$choices <- NULL
}
item_info$label_parsed <-
item_info$choice_list <- item_info$study_id <- item_info$id <- NULL
pander::pander(item_info)
}if (!is.null(choices) && length(choices) && length(choices) < 30) {
pander::pander(as.list(choices))
}race_4
What is your race/ethnicity? (please check all that apply)-American Indian
Distribution
show_missing_values <- FALSE
if (has_labels(item)) {
missing_values <- item[is.na(haven::zap_missing(item))]
attributes(missing_values) <- attributes(item)
if (!is.null(attributes(item)$labels)) {
attributes(missing_values)$labels <- attributes(missing_values)$labels[is.na(attributes(missing_values)$labels)]
attributes(item)$labels <- attributes(item)$labels[!is.na(attributes(item)$labels)]
}
if (is.double(item)) {
show_missing_values <- length(unique(haven::na_tag(missing_values))) > 1
item <- haven::zap_missing(item)
}
if (length(item_attributes$labels) == 0 && is.numeric(item)) {
item <- haven::zap_labels(item)
}
}
item_nomiss <- item[!is.na(item)]
# unnest mc_multiple and so on
if (
is.character(item_nomiss) &&
stringr::str_detect(item_nomiss, stringr::fixed(", ")) &&
(exists("type", item_info) &&
stringr::str_detect(item_info$type, pattern = stringr::fixed("multiple")))
) {
item_nomiss <- unlist(stringr::str_split(item_nomiss, pattern = stringr::fixed(", ")))
}
attributes(item_nomiss) <- attributes(item)
old_height <- knitr::opts_chunk$get("fig.height")
non_missing_choices <- item_attributes[["labels"]]
many_labels <- length(non_missing_choices) > 7
go_vertical <- !is.numeric(item_nomiss) || many_labels
if ( go_vertical ) {
# numeric items are plotted horizontally (because that's what usually expected)
# categorical items are plotted vertically because we can use the screen real estate better this way
if (is.null(choices) ||
dplyr::n_distinct(item_nomiss) > length(non_missing_choices)) {
non_missing_choices <- unique(item_nomiss)
names(non_missing_choices) <- non_missing_choices
}
choice_multiplier <- old_height/6.5
new_height <- 2 + choice_multiplier * length(non_missing_choices)
new_height <- ifelse(new_height > 20, 20, new_height)
new_height <- ifelse(new_height < 1, 1, new_height)
knitr::opts_chunk$set(fig.height = new_height)
}
wrap_at <- knitr::opts_chunk$get("fig.width") * 10# todo: if there are free-text choices mingled in with the pre-defined ones, don't show
# todo: show rare items if they are pre-defined
# todo: bin rare responses into "other category"
if (!length(item_nomiss)) {
cat("No non-missing values to show.")
} else if (is.numeric(item_nomiss) || dplyr::n_distinct(item_nomiss) < 20) {
plot_labelled(item_nomiss, item_name, wrap_at, go_vertical)
} else {
cat(dplyr::n_distinct(item_nomiss), " unique, categorical values, so not shown.")
}## No non-missing values to show.knitr::opts_chunk$set(fig.height = old_height)2006 missing values.
Summary statistics
attributes(item) <- item_attributes
df = data.frame(item, stringsAsFactors = FALSE)
names(df) = html_item_name
escaped_table(codebook_table(df))| name | label | data_type | missing | complete | n | mean | sd | p0 | p25 | p50 | p75 | p100 | hist | format.spss | display_width |
|---|---|---|---|---|---|---|---|---|---|---|---|---|---|---|---|
| race_4 | What is your race/ethnicity? (please check all that apply)-American Indian | numeric | 2006 | 0 | 2006 | NaN | NA | NA | NA | NA | NA | NA | F40.0 | 9 |
if (show_missing_values) {
plot_labelled(missing_values, item_name, wrap_at)
}if (!is.null(item_info)) {
# don't show choices again, if they're basically same thing as value labels
if (!is.null(choices) && !is.null(item_info$choices) &&
all(names(na.omit(choices)) == item_info$choices) &&
all(na.omit(choices) == names(item_info$choices))) {
item_info$choices <- NULL
}
item_info$label_parsed <-
item_info$choice_list <- item_info$study_id <- item_info$id <- NULL
pander::pander(item_info)
}if (!is.null(choices) && length(choices) && length(choices) < 30) {
pander::pander(as.list(choices))
}race_5
What is your race/ethnicity? (please check all that apply)-Asian
Distribution
show_missing_values <- FALSE
if (has_labels(item)) {
missing_values <- item[is.na(haven::zap_missing(item))]
attributes(missing_values) <- attributes(item)
if (!is.null(attributes(item)$labels)) {
attributes(missing_values)$labels <- attributes(missing_values)$labels[is.na(attributes(missing_values)$labels)]
attributes(item)$labels <- attributes(item)$labels[!is.na(attributes(item)$labels)]
}
if (is.double(item)) {
show_missing_values <- length(unique(haven::na_tag(missing_values))) > 1
item <- haven::zap_missing(item)
}
if (length(item_attributes$labels) == 0 && is.numeric(item)) {
item <- haven::zap_labels(item)
}
}
item_nomiss <- item[!is.na(item)]
# unnest mc_multiple and so on
if (
is.character(item_nomiss) &&
stringr::str_detect(item_nomiss, stringr::fixed(", ")) &&
(exists("type", item_info) &&
stringr::str_detect(item_info$type, pattern = stringr::fixed("multiple")))
) {
item_nomiss <- unlist(stringr::str_split(item_nomiss, pattern = stringr::fixed(", ")))
}
attributes(item_nomiss) <- attributes(item)
old_height <- knitr::opts_chunk$get("fig.height")
non_missing_choices <- item_attributes[["labels"]]
many_labels <- length(non_missing_choices) > 7
go_vertical <- !is.numeric(item_nomiss) || many_labels
if ( go_vertical ) {
# numeric items are plotted horizontally (because that's what usually expected)
# categorical items are plotted vertically because we can use the screen real estate better this way
if (is.null(choices) ||
dplyr::n_distinct(item_nomiss) > length(non_missing_choices)) {
non_missing_choices <- unique(item_nomiss)
names(non_missing_choices) <- non_missing_choices
}
choice_multiplier <- old_height/6.5
new_height <- 2 + choice_multiplier * length(non_missing_choices)
new_height <- ifelse(new_height > 20, 20, new_height)
new_height <- ifelse(new_height < 1, 1, new_height)
knitr::opts_chunk$set(fig.height = new_height)
}
wrap_at <- knitr::opts_chunk$get("fig.width") * 10# todo: if there are free-text choices mingled in with the pre-defined ones, don't show
# todo: show rare items if they are pre-defined
# todo: bin rare responses into "other category"
if (!length(item_nomiss)) {
cat("No non-missing values to show.")
} else if (is.numeric(item_nomiss) || dplyr::n_distinct(item_nomiss) < 20) {
plot_labelled(item_nomiss, item_name, wrap_at, go_vertical)
} else {
cat(dplyr::n_distinct(item_nomiss), " unique, categorical values, so not shown.")
}
knitr::opts_chunk$set(fig.height = old_height)1983 missing values.
Summary statistics
attributes(item) <- item_attributes
df = data.frame(item, stringsAsFactors = FALSE)
names(df) = html_item_name
escaped_table(codebook_table(df))| name | label | data_type | missing | complete | n | mean | sd | p0 | p25 | p50 | p75 | p100 | hist | format.spss |
|---|---|---|---|---|---|---|---|---|---|---|---|---|---|---|
| race_5 | What is your race/ethnicity? (please check all that apply)-Asian | numeric | 1983 | 23 | 2006 | 1 | 0 | 1 | 1 | 1 | 1 | 1 | ▁▁▁▇▁▁▁▁ | F8.0 |
if (show_missing_values) {
plot_labelled(missing_values, item_name, wrap_at)
}if (!is.null(item_info)) {
# don't show choices again, if they're basically same thing as value labels
if (!is.null(choices) && !is.null(item_info$choices) &&
all(names(na.omit(choices)) == item_info$choices) &&
all(na.omit(choices) == names(item_info$choices))) {
item_info$choices <- NULL
}
item_info$label_parsed <-
item_info$choice_list <- item_info$study_id <- item_info$id <- NULL
pander::pander(item_info)
}if (!is.null(choices) && length(choices) && length(choices) < 30) {
pander::pander(as.list(choices))
}race_6
What is your race/ethnicity? (please check all that apply)-Native Hawaiian or Pacific Islander
Distribution
show_missing_values <- FALSE
if (has_labels(item)) {
missing_values <- item[is.na(haven::zap_missing(item))]
attributes(missing_values) <- attributes(item)
if (!is.null(attributes(item)$labels)) {
attributes(missing_values)$labels <- attributes(missing_values)$labels[is.na(attributes(missing_values)$labels)]
attributes(item)$labels <- attributes(item)$labels[!is.na(attributes(item)$labels)]
}
if (is.double(item)) {
show_missing_values <- length(unique(haven::na_tag(missing_values))) > 1
item <- haven::zap_missing(item)
}
if (length(item_attributes$labels) == 0 && is.numeric(item)) {
item <- haven::zap_labels(item)
}
}
item_nomiss <- item[!is.na(item)]
# unnest mc_multiple and so on
if (
is.character(item_nomiss) &&
stringr::str_detect(item_nomiss, stringr::fixed(", ")) &&
(exists("type", item_info) &&
stringr::str_detect(item_info$type, pattern = stringr::fixed("multiple")))
) {
item_nomiss <- unlist(stringr::str_split(item_nomiss, pattern = stringr::fixed(", ")))
}
attributes(item_nomiss) <- attributes(item)
old_height <- knitr::opts_chunk$get("fig.height")
non_missing_choices <- item_attributes[["labels"]]
many_labels <- length(non_missing_choices) > 7
go_vertical <- !is.numeric(item_nomiss) || many_labels
if ( go_vertical ) {
# numeric items are plotted horizontally (because that's what usually expected)
# categorical items are plotted vertically because we can use the screen real estate better this way
if (is.null(choices) ||
dplyr::n_distinct(item_nomiss) > length(non_missing_choices)) {
non_missing_choices <- unique(item_nomiss)
names(non_missing_choices) <- non_missing_choices
}
choice_multiplier <- old_height/6.5
new_height <- 2 + choice_multiplier * length(non_missing_choices)
new_height <- ifelse(new_height > 20, 20, new_height)
new_height <- ifelse(new_height < 1, 1, new_height)
knitr::opts_chunk$set(fig.height = new_height)
}
wrap_at <- knitr::opts_chunk$get("fig.width") * 10# todo: if there are free-text choices mingled in with the pre-defined ones, don't show
# todo: show rare items if they are pre-defined
# todo: bin rare responses into "other category"
if (!length(item_nomiss)) {
cat("No non-missing values to show.")
} else if (is.numeric(item_nomiss) || dplyr::n_distinct(item_nomiss) < 20) {
plot_labelled(item_nomiss, item_name, wrap_at, go_vertical)
} else {
cat(dplyr::n_distinct(item_nomiss), " unique, categorical values, so not shown.")
}## No non-missing values to show.knitr::opts_chunk$set(fig.height = old_height)2006 missing values.
Summary statistics
attributes(item) <- item_attributes
df = data.frame(item, stringsAsFactors = FALSE)
names(df) = html_item_name
escaped_table(codebook_table(df))| name | label | data_type | missing | complete | n | mean | sd | p0 | p25 | p50 | p75 | p100 | hist | format.spss | display_width |
|---|---|---|---|---|---|---|---|---|---|---|---|---|---|---|---|
| race_6 | What is your race/ethnicity? (please check all that apply)-Native Hawaiian or Pacific Islander | numeric | 2006 | 0 | 2006 | NaN | NA | NA | NA | NA | NA | NA | F40.0 | 9 |
if (show_missing_values) {
plot_labelled(missing_values, item_name, wrap_at)
}if (!is.null(item_info)) {
# don't show choices again, if they're basically same thing as value labels
if (!is.null(choices) && !is.null(item_info$choices) &&
all(names(na.omit(choices)) == item_info$choices) &&
all(na.omit(choices) == names(item_info$choices))) {
item_info$choices <- NULL
}
item_info$label_parsed <-
item_info$choice_list <- item_info$study_id <- item_info$id <- NULL
pander::pander(item_info)
}if (!is.null(choices) && length(choices) && length(choices) < 30) {
pander::pander(as.list(choices))
}race_7
What is your race/ethnicity? (please check all that apply)-Member of race not listed above
Distribution
show_missing_values <- FALSE
if (has_labels(item)) {
missing_values <- item[is.na(haven::zap_missing(item))]
attributes(missing_values) <- attributes(item)
if (!is.null(attributes(item)$labels)) {
attributes(missing_values)$labels <- attributes(missing_values)$labels[is.na(attributes(missing_values)$labels)]
attributes(item)$labels <- attributes(item)$labels[!is.na(attributes(item)$labels)]
}
if (is.double(item)) {
show_missing_values <- length(unique(haven::na_tag(missing_values))) > 1
item <- haven::zap_missing(item)
}
if (length(item_attributes$labels) == 0 && is.numeric(item)) {
item <- haven::zap_labels(item)
}
}
item_nomiss <- item[!is.na(item)]
# unnest mc_multiple and so on
if (
is.character(item_nomiss) &&
stringr::str_detect(item_nomiss, stringr::fixed(", ")) &&
(exists("type", item_info) &&
stringr::str_detect(item_info$type, pattern = stringr::fixed("multiple")))
) {
item_nomiss <- unlist(stringr::str_split(item_nomiss, pattern = stringr::fixed(", ")))
}
attributes(item_nomiss) <- attributes(item)
old_height <- knitr::opts_chunk$get("fig.height")
non_missing_choices <- item_attributes[["labels"]]
many_labels <- length(non_missing_choices) > 7
go_vertical <- !is.numeric(item_nomiss) || many_labels
if ( go_vertical ) {
# numeric items are plotted horizontally (because that's what usually expected)
# categorical items are plotted vertically because we can use the screen real estate better this way
if (is.null(choices) ||
dplyr::n_distinct(item_nomiss) > length(non_missing_choices)) {
non_missing_choices <- unique(item_nomiss)
names(non_missing_choices) <- non_missing_choices
}
choice_multiplier <- old_height/6.5
new_height <- 2 + choice_multiplier * length(non_missing_choices)
new_height <- ifelse(new_height > 20, 20, new_height)
new_height <- ifelse(new_height < 1, 1, new_height)
knitr::opts_chunk$set(fig.height = new_height)
}
wrap_at <- knitr::opts_chunk$get("fig.width") * 10# todo: if there are free-text choices mingled in with the pre-defined ones, don't show
# todo: show rare items if they are pre-defined
# todo: bin rare responses into "other category"
if (!length(item_nomiss)) {
cat("No non-missing values to show.")
} else if (is.numeric(item_nomiss) || dplyr::n_distinct(item_nomiss) < 20) {
plot_labelled(item_nomiss, item_name, wrap_at, go_vertical)
} else {
cat(dplyr::n_distinct(item_nomiss), " unique, categorical values, so not shown.")
}## No non-missing values to show.knitr::opts_chunk$set(fig.height = old_height)2006 missing values.
Summary statistics
attributes(item) <- item_attributes
df = data.frame(item, stringsAsFactors = FALSE)
names(df) = html_item_name
escaped_table(codebook_table(df))| name | label | data_type | missing | complete | n | mean | sd | p0 | p25 | p50 | p75 | p100 | hist | format.spss | display_width |
|---|---|---|---|---|---|---|---|---|---|---|---|---|---|---|---|
| race_7 | What is your race/ethnicity? (please check all that apply)-Member of race not listed above | numeric | 2006 | 0 | 2006 | NaN | NA | NA | NA | NA | NA | NA | F40.0 | 9 |
if (show_missing_values) {
plot_labelled(missing_values, item_name, wrap_at)
}if (!is.null(item_info)) {
# don't show choices again, if they're basically same thing as value labels
if (!is.null(choices) && !is.null(item_info$choices) &&
all(names(na.omit(choices)) == item_info$choices) &&
all(na.omit(choices) == names(item_info$choices))) {
item_info$choices <- NULL
}
item_info$label_parsed <-
item_info$choice_list <- item_info$study_id <- item_info$id <- NULL
pander::pander(item_info)
}if (!is.null(choices) && length(choices) && length(choices) < 30) {
pander::pander(as.list(choices))
}Menstruated
Have you ever menstruated?
Distribution
show_missing_values <- FALSE
if (has_labels(item)) {
missing_values <- item[is.na(haven::zap_missing(item))]
attributes(missing_values) <- attributes(item)
if (!is.null(attributes(item)$labels)) {
attributes(missing_values)$labels <- attributes(missing_values)$labels[is.na(attributes(missing_values)$labels)]
attributes(item)$labels <- attributes(item)$labels[!is.na(attributes(item)$labels)]
}
if (is.double(item)) {
show_missing_values <- length(unique(haven::na_tag(missing_values))) > 1
item <- haven::zap_missing(item)
}
if (length(item_attributes$labels) == 0 && is.numeric(item)) {
item <- haven::zap_labels(item)
}
}
item_nomiss <- item[!is.na(item)]
# unnest mc_multiple and so on
if (
is.character(item_nomiss) &&
stringr::str_detect(item_nomiss, stringr::fixed(", ")) &&
(exists("type", item_info) &&
stringr::str_detect(item_info$type, pattern = stringr::fixed("multiple")))
) {
item_nomiss <- unlist(stringr::str_split(item_nomiss, pattern = stringr::fixed(", ")))
}
attributes(item_nomiss) <- attributes(item)
old_height <- knitr::opts_chunk$get("fig.height")
non_missing_choices <- item_attributes[["labels"]]
many_labels <- length(non_missing_choices) > 7
go_vertical <- !is.numeric(item_nomiss) || many_labels
if ( go_vertical ) {
# numeric items are plotted horizontally (because that's what usually expected)
# categorical items are plotted vertically because we can use the screen real estate better this way
if (is.null(choices) ||
dplyr::n_distinct(item_nomiss) > length(non_missing_choices)) {
non_missing_choices <- unique(item_nomiss)
names(non_missing_choices) <- non_missing_choices
}
choice_multiplier <- old_height/6.5
new_height <- 2 + choice_multiplier * length(non_missing_choices)
new_height <- ifelse(new_height > 20, 20, new_height)
new_height <- ifelse(new_height < 1, 1, new_height)
knitr::opts_chunk$set(fig.height = new_height)
}
wrap_at <- knitr::opts_chunk$get("fig.width") * 10# todo: if there are free-text choices mingled in with the pre-defined ones, don't show
# todo: show rare items if they are pre-defined
# todo: bin rare responses into "other category"
if (!length(item_nomiss)) {
cat("No non-missing values to show.")
} else if (is.numeric(item_nomiss) || dplyr::n_distinct(item_nomiss) < 20) {
plot_labelled(item_nomiss, item_name, wrap_at, go_vertical)
} else {
cat(dplyr::n_distinct(item_nomiss), " unique, categorical values, so not shown.")
}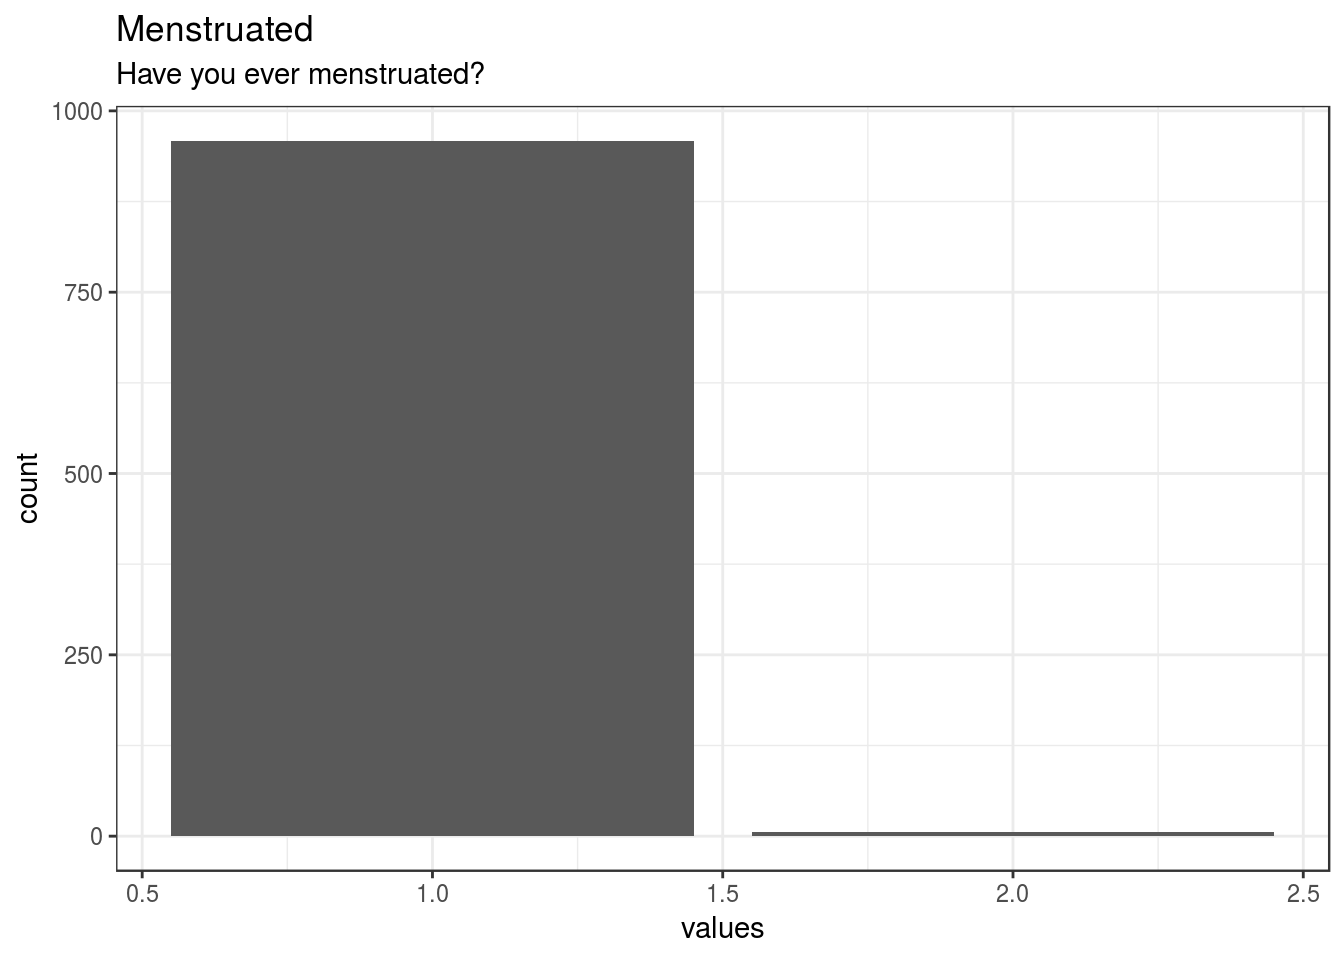
knitr::opts_chunk$set(fig.height = old_height)1041 missing values.
Summary statistics
attributes(item) <- item_attributes
df = data.frame(item, stringsAsFactors = FALSE)
names(df) = html_item_name
escaped_table(codebook_table(df))| name | label | data_type | missing | complete | n | mean | sd | p0 | p25 | p50 | p75 | p100 | hist | format.spss |
|---|---|---|---|---|---|---|---|---|---|---|---|---|---|---|
| Menstruated | Have you ever menstruated? | numeric | 1041 | 965 | 2006 | 1.01 | 0.079 | 1 | 1 | 1 | 1 | 2 | ▇▁▁▁▁▁▁▁ | F8.0 |
if (show_missing_values) {
plot_labelled(missing_values, item_name, wrap_at)
}if (!is.null(item_info)) {
# don't show choices again, if they're basically same thing as value labels
if (!is.null(choices) && !is.null(item_info$choices) &&
all(names(na.omit(choices)) == item_info$choices) &&
all(na.omit(choices) == names(item_info$choices))) {
item_info$choices <- NULL
}
item_info$label_parsed <-
item_info$choice_list <- item_info$study_id <- item_info$id <- NULL
pander::pander(item_info)
}if (!is.null(choices) && length(choices) && length(choices) < 30) {
pander::pander(as.list(choices))
}MenstStop
Have you stopped menstruating due to menopause or any reason EXCEPT pregnancy or hormonal birth c…
Distribution
show_missing_values <- FALSE
if (has_labels(item)) {
missing_values <- item[is.na(haven::zap_missing(item))]
attributes(missing_values) <- attributes(item)
if (!is.null(attributes(item)$labels)) {
attributes(missing_values)$labels <- attributes(missing_values)$labels[is.na(attributes(missing_values)$labels)]
attributes(item)$labels <- attributes(item)$labels[!is.na(attributes(item)$labels)]
}
if (is.double(item)) {
show_missing_values <- length(unique(haven::na_tag(missing_values))) > 1
item <- haven::zap_missing(item)
}
if (length(item_attributes$labels) == 0 && is.numeric(item)) {
item <- haven::zap_labels(item)
}
}
item_nomiss <- item[!is.na(item)]
# unnest mc_multiple and so on
if (
is.character(item_nomiss) &&
stringr::str_detect(item_nomiss, stringr::fixed(", ")) &&
(exists("type", item_info) &&
stringr::str_detect(item_info$type, pattern = stringr::fixed("multiple")))
) {
item_nomiss <- unlist(stringr::str_split(item_nomiss, pattern = stringr::fixed(", ")))
}
attributes(item_nomiss) <- attributes(item)
old_height <- knitr::opts_chunk$get("fig.height")
non_missing_choices <- item_attributes[["labels"]]
many_labels <- length(non_missing_choices) > 7
go_vertical <- !is.numeric(item_nomiss) || many_labels
if ( go_vertical ) {
# numeric items are plotted horizontally (because that's what usually expected)
# categorical items are plotted vertically because we can use the screen real estate better this way
if (is.null(choices) ||
dplyr::n_distinct(item_nomiss) > length(non_missing_choices)) {
non_missing_choices <- unique(item_nomiss)
names(non_missing_choices) <- non_missing_choices
}
choice_multiplier <- old_height/6.5
new_height <- 2 + choice_multiplier * length(non_missing_choices)
new_height <- ifelse(new_height > 20, 20, new_height)
new_height <- ifelse(new_height < 1, 1, new_height)
knitr::opts_chunk$set(fig.height = new_height)
}
wrap_at <- knitr::opts_chunk$get("fig.width") * 10# todo: if there are free-text choices mingled in with the pre-defined ones, don't show
# todo: show rare items if they are pre-defined
# todo: bin rare responses into "other category"
if (!length(item_nomiss)) {
cat("No non-missing values to show.")
} else if (is.numeric(item_nomiss) || dplyr::n_distinct(item_nomiss) < 20) {
plot_labelled(item_nomiss, item_name, wrap_at, go_vertical)
} else {
cat(dplyr::n_distinct(item_nomiss), " unique, categorical values, so not shown.")
}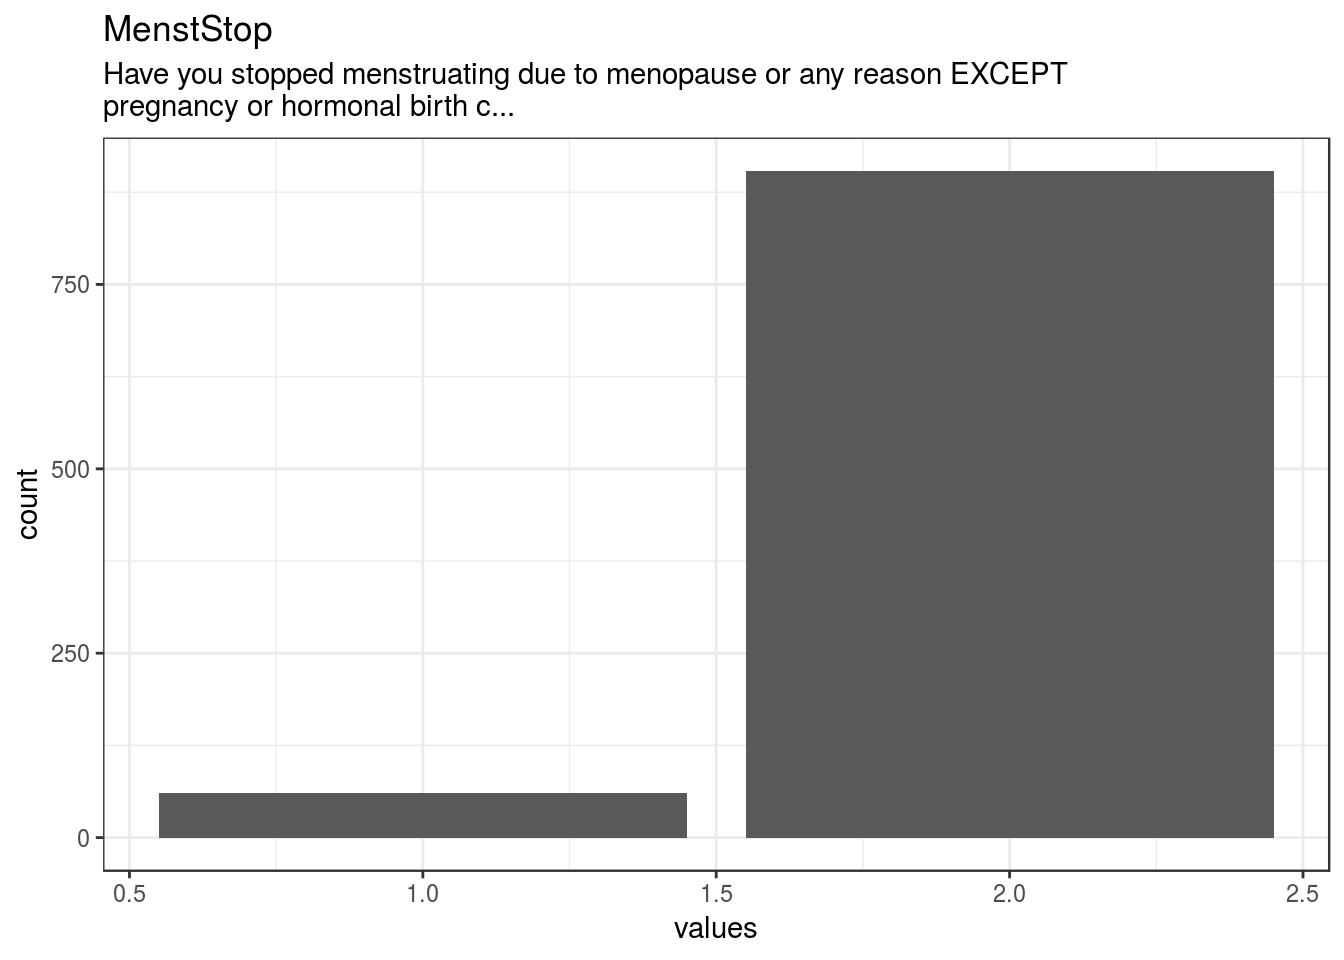
knitr::opts_chunk$set(fig.height = old_height)1041 missing values.
Summary statistics
attributes(item) <- item_attributes
df = data.frame(item, stringsAsFactors = FALSE)
names(df) = html_item_name
escaped_table(codebook_table(df))| name | label | data_type | missing | complete | n | mean | sd | p0 | p25 | p50 | p75 | p100 | hist | format.spss |
|---|---|---|---|---|---|---|---|---|---|---|---|---|---|---|
| MenstStop | Have you stopped menstruating due to menopause or any reason EXCEPT pregnancy or hormonal birth c… | numeric | 1041 | 965 | 2006 | 1.94 | 0.24 | 1 | 2 | 2 | 2 | 2 | ▁▁▁▁▁▁▁▇ | F8.0 |
if (show_missing_values) {
plot_labelled(missing_values, item_name, wrap_at)
}if (!is.null(item_info)) {
# don't show choices again, if they're basically same thing as value labels
if (!is.null(choices) && !is.null(item_info$choices) &&
all(names(na.omit(choices)) == item_info$choices) &&
all(na.omit(choices) == names(item_info$choices))) {
item_info$choices <- NULL
}
item_info$label_parsed <-
item_info$choice_list <- item_info$study_id <- item_info$id <- NULL
pander::pander(item_info)
}if (!is.null(choices) && length(choices) && length(choices) < 30) {
pander::pander(as.list(choices))
}HRT
Are you using hormone replacement therapy?
Distribution
show_missing_values <- FALSE
if (has_labels(item)) {
missing_values <- item[is.na(haven::zap_missing(item))]
attributes(missing_values) <- attributes(item)
if (!is.null(attributes(item)$labels)) {
attributes(missing_values)$labels <- attributes(missing_values)$labels[is.na(attributes(missing_values)$labels)]
attributes(item)$labels <- attributes(item)$labels[!is.na(attributes(item)$labels)]
}
if (is.double(item)) {
show_missing_values <- length(unique(haven::na_tag(missing_values))) > 1
item <- haven::zap_missing(item)
}
if (length(item_attributes$labels) == 0 && is.numeric(item)) {
item <- haven::zap_labels(item)
}
}
item_nomiss <- item[!is.na(item)]
# unnest mc_multiple and so on
if (
is.character(item_nomiss) &&
stringr::str_detect(item_nomiss, stringr::fixed(", ")) &&
(exists("type", item_info) &&
stringr::str_detect(item_info$type, pattern = stringr::fixed("multiple")))
) {
item_nomiss <- unlist(stringr::str_split(item_nomiss, pattern = stringr::fixed(", ")))
}
attributes(item_nomiss) <- attributes(item)
old_height <- knitr::opts_chunk$get("fig.height")
non_missing_choices <- item_attributes[["labels"]]
many_labels <- length(non_missing_choices) > 7
go_vertical <- !is.numeric(item_nomiss) || many_labels
if ( go_vertical ) {
# numeric items are plotted horizontally (because that's what usually expected)
# categorical items are plotted vertically because we can use the screen real estate better this way
if (is.null(choices) ||
dplyr::n_distinct(item_nomiss) > length(non_missing_choices)) {
non_missing_choices <- unique(item_nomiss)
names(non_missing_choices) <- non_missing_choices
}
choice_multiplier <- old_height/6.5
new_height <- 2 + choice_multiplier * length(non_missing_choices)
new_height <- ifelse(new_height > 20, 20, new_height)
new_height <- ifelse(new_height < 1, 1, new_height)
knitr::opts_chunk$set(fig.height = new_height)
}
wrap_at <- knitr::opts_chunk$get("fig.width") * 10# todo: if there are free-text choices mingled in with the pre-defined ones, don't show
# todo: show rare items if they are pre-defined
# todo: bin rare responses into "other category"
if (!length(item_nomiss)) {
cat("No non-missing values to show.")
} else if (is.numeric(item_nomiss) || dplyr::n_distinct(item_nomiss) < 20) {
plot_labelled(item_nomiss, item_name, wrap_at, go_vertical)
} else {
cat(dplyr::n_distinct(item_nomiss), " unique, categorical values, so not shown.")
}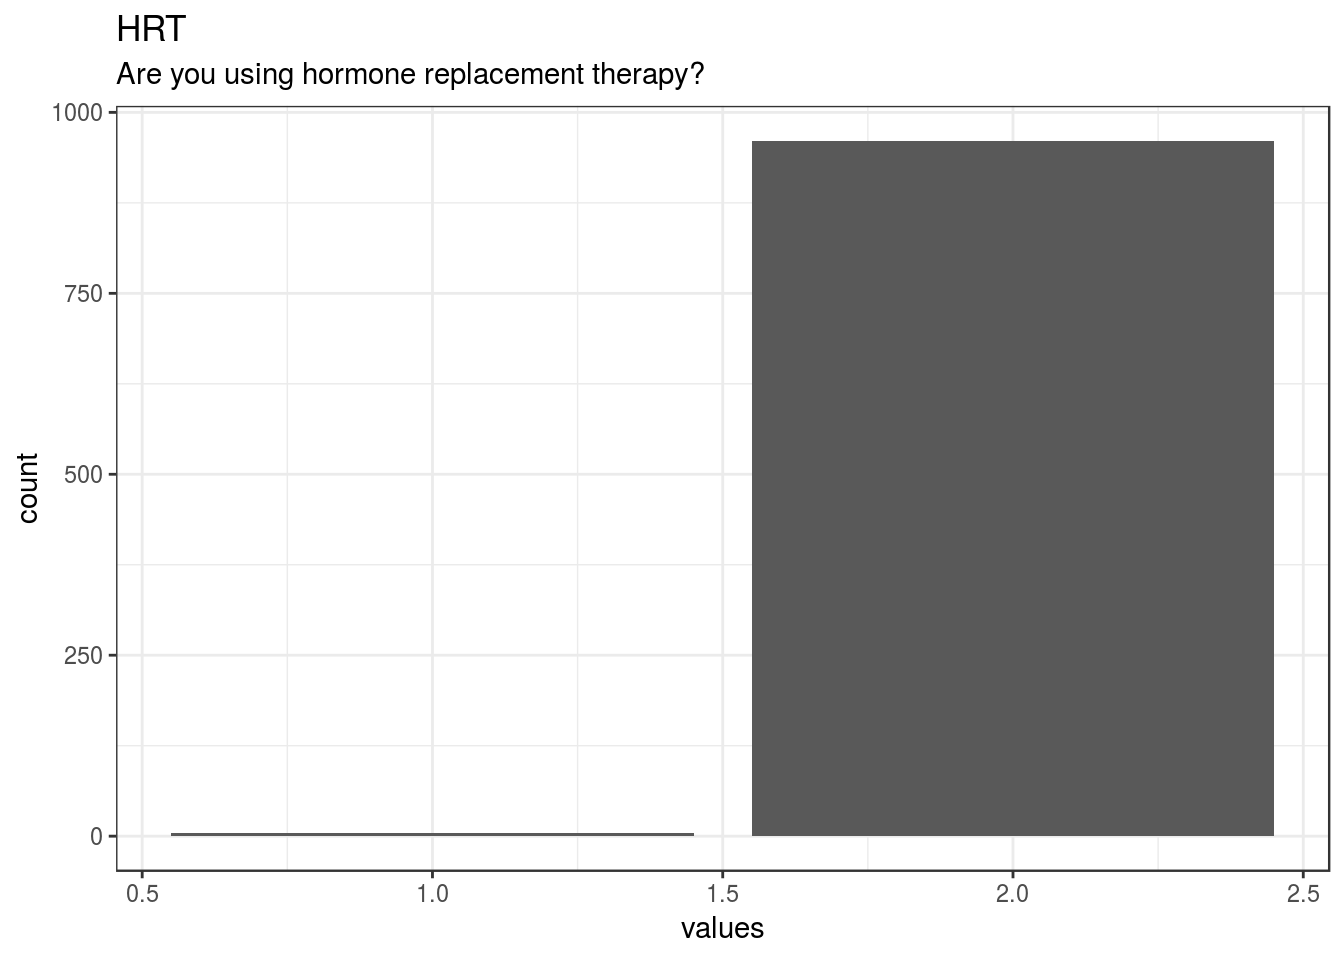
knitr::opts_chunk$set(fig.height = old_height)1041 missing values.
Summary statistics
attributes(item) <- item_attributes
df = data.frame(item, stringsAsFactors = FALSE)
names(df) = html_item_name
escaped_table(codebook_table(df))| name | label | data_type | missing | complete | n | mean | sd | p0 | p25 | p50 | p75 | p100 | hist | format.spss |
|---|---|---|---|---|---|---|---|---|---|---|---|---|---|---|
| HRT | Are you using hormone replacement therapy? | numeric | 1041 | 965 | 2006 | 2 | 0.064 | 1 | 2 | 2 | 2 | 2 | ▁▁▁▁▁▁▁▇ | F8.0 |
if (show_missing_values) {
plot_labelled(missing_values, item_name, wrap_at)
}if (!is.null(item_info)) {
# don't show choices again, if they're basically same thing as value labels
if (!is.null(choices) && !is.null(item_info$choices) &&
all(names(na.omit(choices)) == item_info$choices) &&
all(na.omit(choices) == names(item_info$choices))) {
item_info$choices <- NULL
}
item_info$label_parsed <-
item_info$choice_list <- item_info$study_id <- item_info$id <- NULL
pander::pander(item_info)
}if (!is.null(choices) && length(choices) && length(choices) < 30) {
pander::pander(as.list(choices))
}HorCon3mon
Have you used any method of hormonal contraception in the past three months? This includes the bi…
Distribution
show_missing_values <- FALSE
if (has_labels(item)) {
missing_values <- item[is.na(haven::zap_missing(item))]
attributes(missing_values) <- attributes(item)
if (!is.null(attributes(item)$labels)) {
attributes(missing_values)$labels <- attributes(missing_values)$labels[is.na(attributes(missing_values)$labels)]
attributes(item)$labels <- attributes(item)$labels[!is.na(attributes(item)$labels)]
}
if (is.double(item)) {
show_missing_values <- length(unique(haven::na_tag(missing_values))) > 1
item <- haven::zap_missing(item)
}
if (length(item_attributes$labels) == 0 && is.numeric(item)) {
item <- haven::zap_labels(item)
}
}
item_nomiss <- item[!is.na(item)]
# unnest mc_multiple and so on
if (
is.character(item_nomiss) &&
stringr::str_detect(item_nomiss, stringr::fixed(", ")) &&
(exists("type", item_info) &&
stringr::str_detect(item_info$type, pattern = stringr::fixed("multiple")))
) {
item_nomiss <- unlist(stringr::str_split(item_nomiss, pattern = stringr::fixed(", ")))
}
attributes(item_nomiss) <- attributes(item)
old_height <- knitr::opts_chunk$get("fig.height")
non_missing_choices <- item_attributes[["labels"]]
many_labels <- length(non_missing_choices) > 7
go_vertical <- !is.numeric(item_nomiss) || many_labels
if ( go_vertical ) {
# numeric items are plotted horizontally (because that's what usually expected)
# categorical items are plotted vertically because we can use the screen real estate better this way
if (is.null(choices) ||
dplyr::n_distinct(item_nomiss) > length(non_missing_choices)) {
non_missing_choices <- unique(item_nomiss)
names(non_missing_choices) <- non_missing_choices
}
choice_multiplier <- old_height/6.5
new_height <- 2 + choice_multiplier * length(non_missing_choices)
new_height <- ifelse(new_height > 20, 20, new_height)
new_height <- ifelse(new_height < 1, 1, new_height)
knitr::opts_chunk$set(fig.height = new_height)
}
wrap_at <- knitr::opts_chunk$get("fig.width") * 10# todo: if there are free-text choices mingled in with the pre-defined ones, don't show
# todo: show rare items if they are pre-defined
# todo: bin rare responses into "other category"
if (!length(item_nomiss)) {
cat("No non-missing values to show.")
} else if (is.numeric(item_nomiss) || dplyr::n_distinct(item_nomiss) < 20) {
plot_labelled(item_nomiss, item_name, wrap_at, go_vertical)
} else {
cat(dplyr::n_distinct(item_nomiss), " unique, categorical values, so not shown.")
}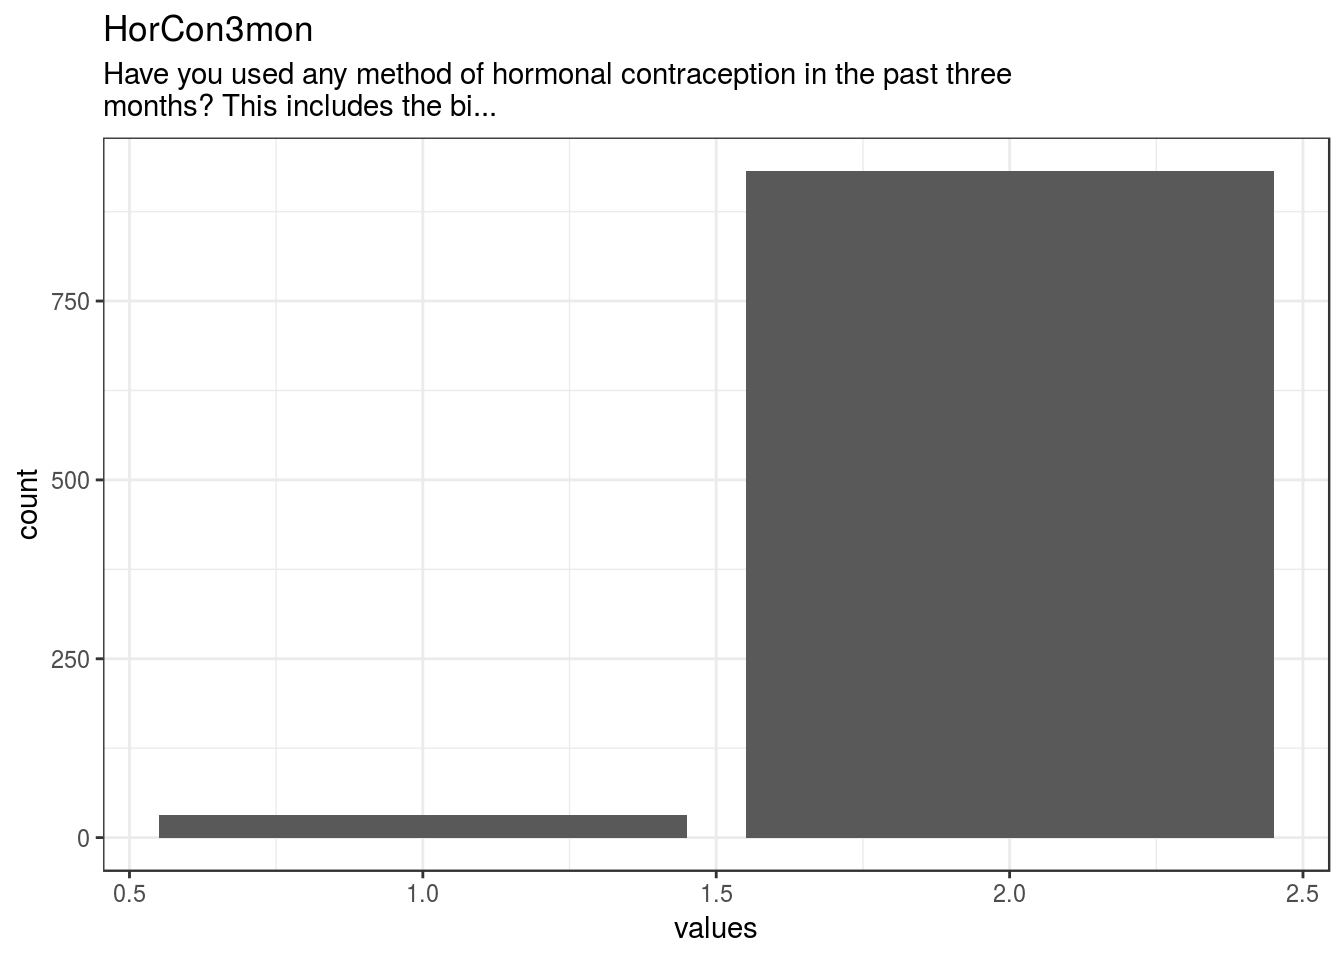
knitr::opts_chunk$set(fig.height = old_height)1042 missing values.
Summary statistics
attributes(item) <- item_attributes
df = data.frame(item, stringsAsFactors = FALSE)
names(df) = html_item_name
escaped_table(codebook_table(df))| name | label | data_type | missing | complete | n | mean | sd | p0 | p25 | p50 | p75 | p100 | hist | format.spss |
|---|---|---|---|---|---|---|---|---|---|---|---|---|---|---|
| HorCon3mon | Have you used any method of hormonal contraception in the past three months? This includes the bi… | numeric | 1042 | 964 | 2006 | 1.97 | 0.18 | 1 | 2 | 2 | 2 | 2 | ▁▁▁▁▁▁▁▇ | F8.0 |
if (show_missing_values) {
plot_labelled(missing_values, item_name, wrap_at)
}if (!is.null(item_info)) {
# don't show choices again, if they're basically same thing as value labels
if (!is.null(choices) && !is.null(item_info$choices) &&
all(names(na.omit(choices)) == item_info$choices) &&
all(na.omit(choices) == names(item_info$choices))) {
item_info$choices <- NULL
}
item_info$label_parsed <-
item_info$choice_list <- item_info$study_id <- item_info$id <- NULL
pander::pander(item_info)
}if (!is.null(choices) && length(choices) && length(choices) < 30) {
pander::pander(as.list(choices))
}ContraceptiveKind
If so, what kind?
Distribution
show_missing_values <- FALSE
if (has_labels(item)) {
missing_values <- item[is.na(haven::zap_missing(item))]
attributes(missing_values) <- attributes(item)
if (!is.null(attributes(item)$labels)) {
attributes(missing_values)$labels <- attributes(missing_values)$labels[is.na(attributes(missing_values)$labels)]
attributes(item)$labels <- attributes(item)$labels[!is.na(attributes(item)$labels)]
}
if (is.double(item)) {
show_missing_values <- length(unique(haven::na_tag(missing_values))) > 1
item <- haven::zap_missing(item)
}
if (length(item_attributes$labels) == 0 && is.numeric(item)) {
item <- haven::zap_labels(item)
}
}
item_nomiss <- item[!is.na(item)]
# unnest mc_multiple and so on
if (
is.character(item_nomiss) &&
stringr::str_detect(item_nomiss, stringr::fixed(", ")) &&
(exists("type", item_info) &&
stringr::str_detect(item_info$type, pattern = stringr::fixed("multiple")))
) {
item_nomiss <- unlist(stringr::str_split(item_nomiss, pattern = stringr::fixed(", ")))
}
attributes(item_nomiss) <- attributes(item)
old_height <- knitr::opts_chunk$get("fig.height")
non_missing_choices <- item_attributes[["labels"]]
many_labels <- length(non_missing_choices) > 7
go_vertical <- !is.numeric(item_nomiss) || many_labels
if ( go_vertical ) {
# numeric items are plotted horizontally (because that's what usually expected)
# categorical items are plotted vertically because we can use the screen real estate better this way
if (is.null(choices) ||
dplyr::n_distinct(item_nomiss) > length(non_missing_choices)) {
non_missing_choices <- unique(item_nomiss)
names(non_missing_choices) <- non_missing_choices
}
choice_multiplier <- old_height/6.5
new_height <- 2 + choice_multiplier * length(non_missing_choices)
new_height <- ifelse(new_height > 20, 20, new_height)
new_height <- ifelse(new_height < 1, 1, new_height)
knitr::opts_chunk$set(fig.height = new_height)
}
wrap_at <- knitr::opts_chunk$get("fig.width") * 10# todo: if there are free-text choices mingled in with the pre-defined ones, don't show
# todo: show rare items if they are pre-defined
# todo: bin rare responses into "other category"
if (!length(item_nomiss)) {
cat("No non-missing values to show.")
} else if (is.numeric(item_nomiss) || dplyr::n_distinct(item_nomiss) < 20) {
plot_labelled(item_nomiss, item_name, wrap_at, go_vertical)
} else {
cat(dplyr::n_distinct(item_nomiss), " unique, categorical values, so not shown.")
}## 47 unique, categorical values, so not shown.knitr::opts_chunk$set(fig.height = old_height)0 missing values.
Summary statistics
attributes(item) <- item_attributes
df = data.frame(item, stringsAsFactors = FALSE)
names(df) = html_item_name
escaped_table(codebook_table(df))| name | label | data_type | missing | complete | n | empty | n_unique | min | max | format.spss | display_width |
|---|---|---|---|---|---|---|---|---|---|---|---|
| ContraceptiveKind | If so, what kind? | character | 0 | 2006 | 2006 | 1217 | 47 | 0 | 59 | A59 | 21 |
if (show_missing_values) {
plot_labelled(missing_values, item_name, wrap_at)
}if (!is.null(item_info)) {
# don't show choices again, if they're basically same thing as value labels
if (!is.null(choices) && !is.null(item_info$choices) &&
all(names(na.omit(choices)) == item_info$choices) &&
all(na.omit(choices) == names(item_info$choices))) {
item_info$choices <- NULL
}
item_info$label_parsed <-
item_info$choice_list <- item_info$study_id <- item_info$id <- NULL
pander::pander(item_info)
}if (!is.null(choices) && length(choices) && length(choices) < 30) {
pander::pander(as.list(choices))
}PregnantDue
If you are pregnant, when are you due? (If you are NOT pregnant, please type in “N/A.”) ï_ MM/DD/…
Distribution
show_missing_values <- FALSE
if (has_labels(item)) {
missing_values <- item[is.na(haven::zap_missing(item))]
attributes(missing_values) <- attributes(item)
if (!is.null(attributes(item)$labels)) {
attributes(missing_values)$labels <- attributes(missing_values)$labels[is.na(attributes(missing_values)$labels)]
attributes(item)$labels <- attributes(item)$labels[!is.na(attributes(item)$labels)]
}
if (is.double(item)) {
show_missing_values <- length(unique(haven::na_tag(missing_values))) > 1
item <- haven::zap_missing(item)
}
if (length(item_attributes$labels) == 0 && is.numeric(item)) {
item <- haven::zap_labels(item)
}
}
item_nomiss <- item[!is.na(item)]
# unnest mc_multiple and so on
if (
is.character(item_nomiss) &&
stringr::str_detect(item_nomiss, stringr::fixed(", ")) &&
(exists("type", item_info) &&
stringr::str_detect(item_info$type, pattern = stringr::fixed("multiple")))
) {
item_nomiss <- unlist(stringr::str_split(item_nomiss, pattern = stringr::fixed(", ")))
}
attributes(item_nomiss) <- attributes(item)
old_height <- knitr::opts_chunk$get("fig.height")
non_missing_choices <- item_attributes[["labels"]]
many_labels <- length(non_missing_choices) > 7
go_vertical <- !is.numeric(item_nomiss) || many_labels
if ( go_vertical ) {
# numeric items are plotted horizontally (because that's what usually expected)
# categorical items are plotted vertically because we can use the screen real estate better this way
if (is.null(choices) ||
dplyr::n_distinct(item_nomiss) > length(non_missing_choices)) {
non_missing_choices <- unique(item_nomiss)
names(non_missing_choices) <- non_missing_choices
}
choice_multiplier <- old_height/6.5
new_height <- 2 + choice_multiplier * length(non_missing_choices)
new_height <- ifelse(new_height > 20, 20, new_height)
new_height <- ifelse(new_height < 1, 1, new_height)
knitr::opts_chunk$set(fig.height = new_height)
}
wrap_at <- knitr::opts_chunk$get("fig.width") * 10# todo: if there are free-text choices mingled in with the pre-defined ones, don't show
# todo: show rare items if they are pre-defined
# todo: bin rare responses into "other category"
if (!length(item_nomiss)) {
cat("No non-missing values to show.")
} else if (is.numeric(item_nomiss) || dplyr::n_distinct(item_nomiss) < 20) {
plot_labelled(item_nomiss, item_name, wrap_at, go_vertical)
} else {
cat(dplyr::n_distinct(item_nomiss), " unique, categorical values, so not shown.")
}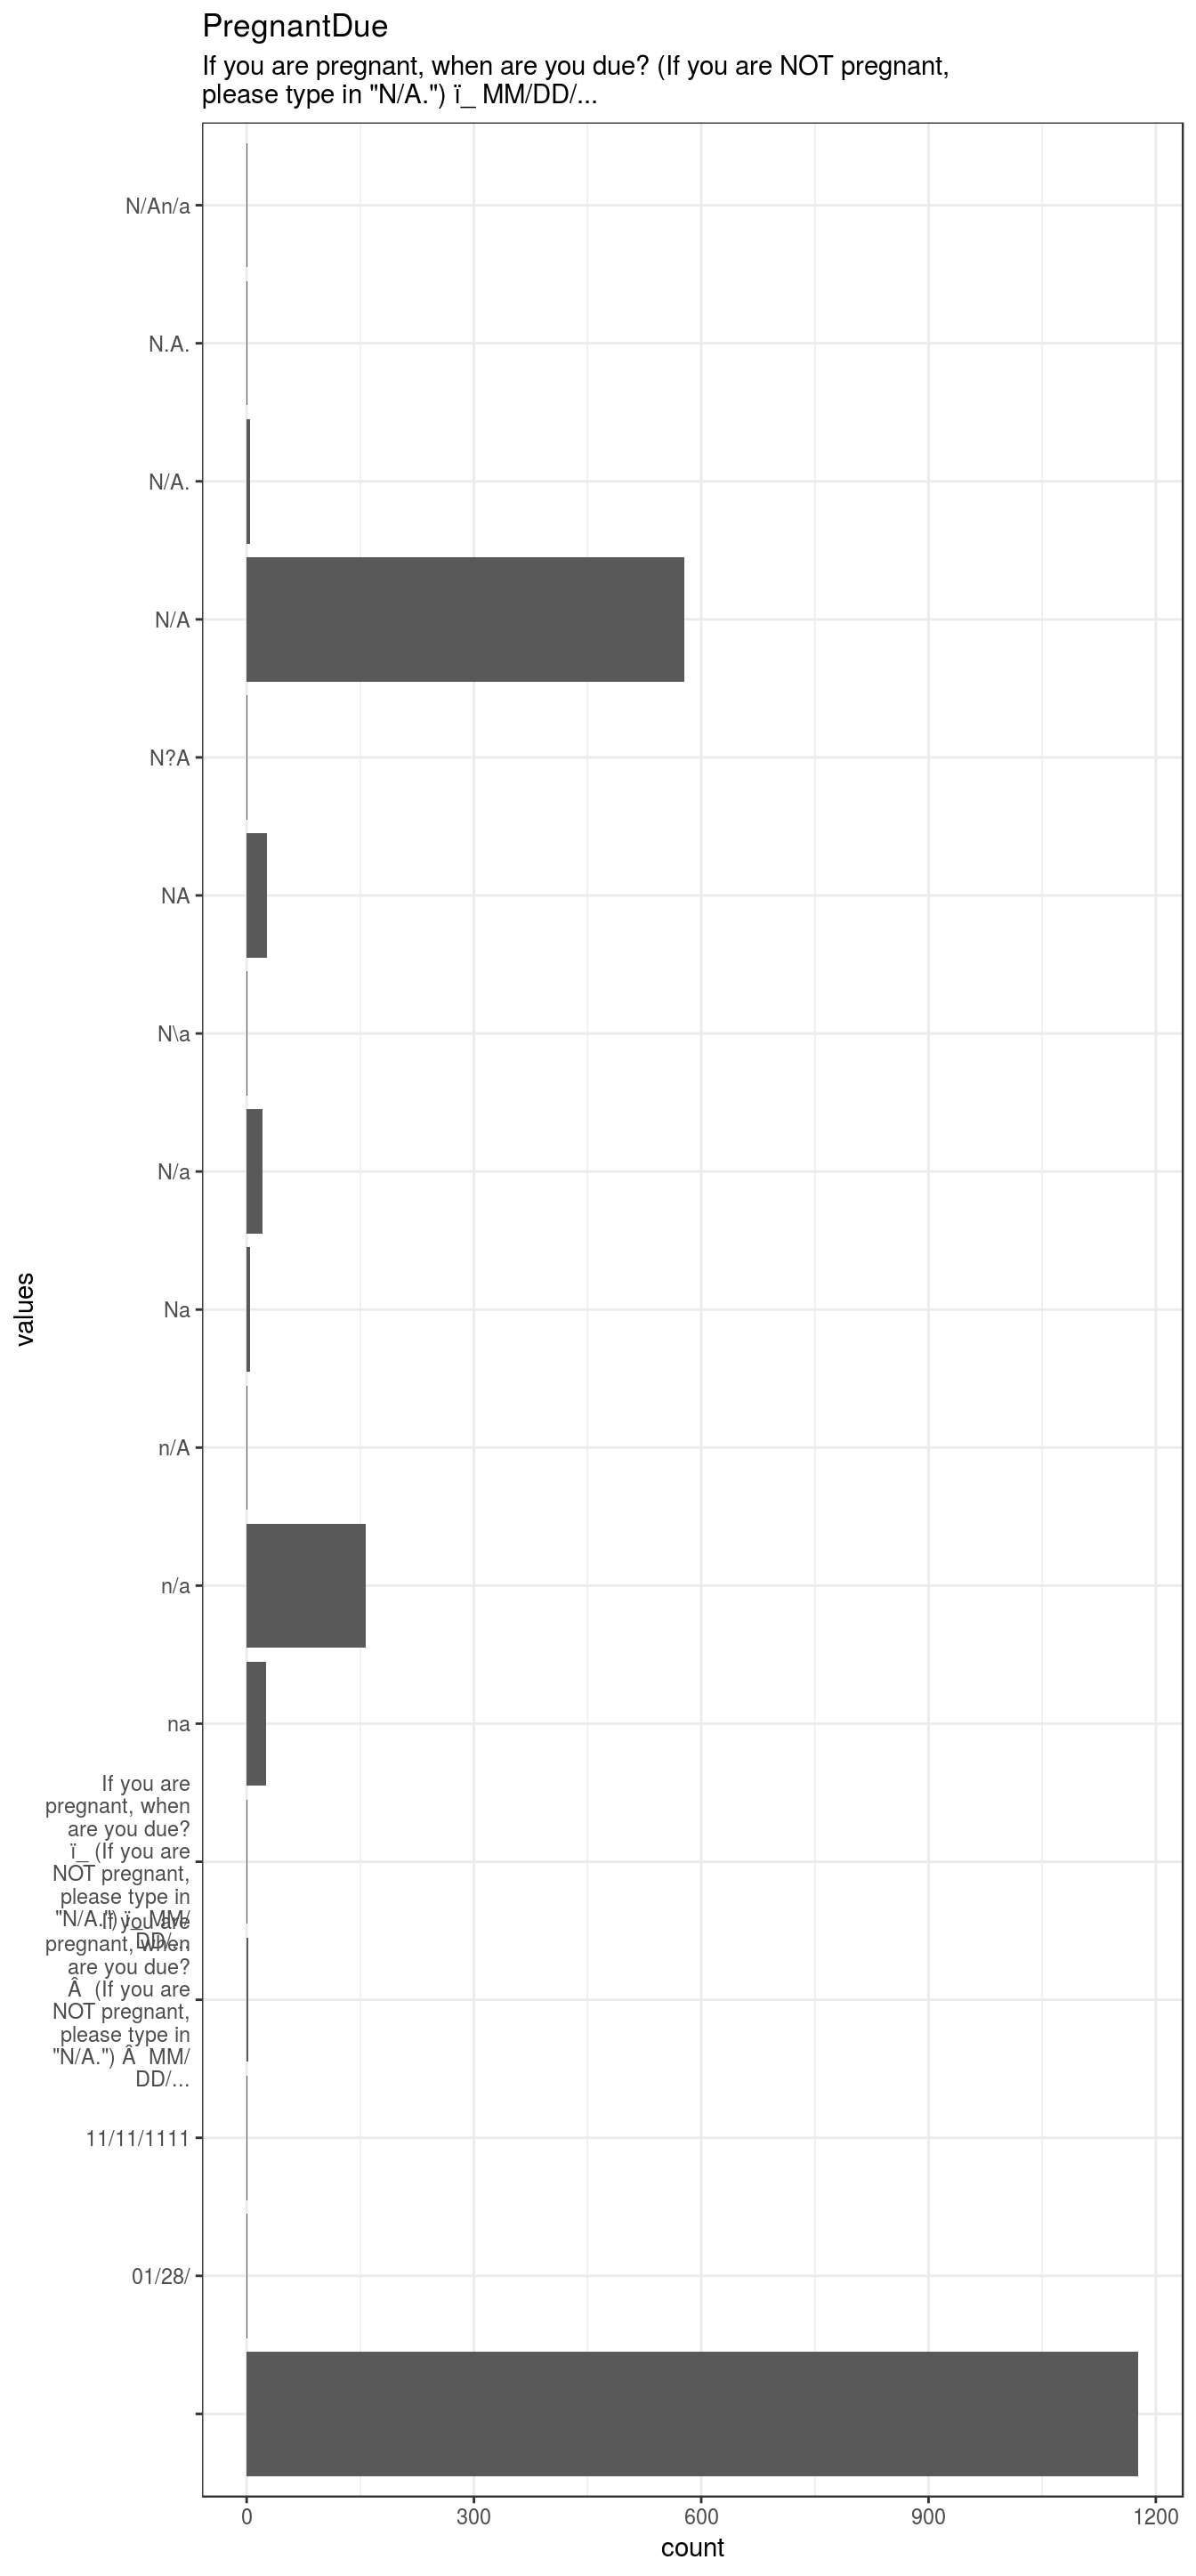
knitr::opts_chunk$set(fig.height = old_height)0 missing values.
Summary statistics
attributes(item) <- item_attributes
df = data.frame(item, stringsAsFactors = FALSE)
names(df) = html_item_name
escaped_table(codebook_table(df))| name | label | data_type | missing | complete | n | empty | n_unique | min | max | format.spss | display_width |
|---|---|---|---|---|---|---|---|---|---|---|---|
| PregnantDue | If you are pregnant, when are you due? (If you are NOT pregnant, please type in “N/A.”) ï_ MM/DD/… | character | 0 | 2006 | 2006 | 1177 | 17 | 0 | 102 | A106 | 50 |
if (show_missing_values) {
plot_labelled(missing_values, item_name, wrap_at)
}if (!is.null(item_info)) {
# don't show choices again, if they're basically same thing as value labels
if (!is.null(choices) && !is.null(item_info$choices) &&
all(names(na.omit(choices)) == item_info$choices) &&
all(na.omit(choices) == names(item_info$choices))) {
item_info$choices <- NULL
}
item_info$label_parsed <-
item_info$choice_list <- item_info$study_id <- item_info$id <- NULL
pander::pander(item_info)
}if (!is.null(choices) && length(choices) && length(choices) < 30) {
pander::pander(as.list(choices))
}ChildBirth
If you gave birth to a child in the last year, when was your child born? (If you have NOT given…
Distribution
show_missing_values <- FALSE
if (has_labels(item)) {
missing_values <- item[is.na(haven::zap_missing(item))]
attributes(missing_values) <- attributes(item)
if (!is.null(attributes(item)$labels)) {
attributes(missing_values)$labels <- attributes(missing_values)$labels[is.na(attributes(missing_values)$labels)]
attributes(item)$labels <- attributes(item)$labels[!is.na(attributes(item)$labels)]
}
if (is.double(item)) {
show_missing_values <- length(unique(haven::na_tag(missing_values))) > 1
item <- haven::zap_missing(item)
}
if (length(item_attributes$labels) == 0 && is.numeric(item)) {
item <- haven::zap_labels(item)
}
}
item_nomiss <- item[!is.na(item)]
# unnest mc_multiple and so on
if (
is.character(item_nomiss) &&
stringr::str_detect(item_nomiss, stringr::fixed(", ")) &&
(exists("type", item_info) &&
stringr::str_detect(item_info$type, pattern = stringr::fixed("multiple")))
) {
item_nomiss <- unlist(stringr::str_split(item_nomiss, pattern = stringr::fixed(", ")))
}
attributes(item_nomiss) <- attributes(item)
old_height <- knitr::opts_chunk$get("fig.height")
non_missing_choices <- item_attributes[["labels"]]
many_labels <- length(non_missing_choices) > 7
go_vertical <- !is.numeric(item_nomiss) || many_labels
if ( go_vertical ) {
# numeric items are plotted horizontally (because that's what usually expected)
# categorical items are plotted vertically because we can use the screen real estate better this way
if (is.null(choices) ||
dplyr::n_distinct(item_nomiss) > length(non_missing_choices)) {
non_missing_choices <- unique(item_nomiss)
names(non_missing_choices) <- non_missing_choices
}
choice_multiplier <- old_height/6.5
new_height <- 2 + choice_multiplier * length(non_missing_choices)
new_height <- ifelse(new_height > 20, 20, new_height)
new_height <- ifelse(new_height < 1, 1, new_height)
knitr::opts_chunk$set(fig.height = new_height)
}
wrap_at <- knitr::opts_chunk$get("fig.width") * 10# todo: if there are free-text choices mingled in with the pre-defined ones, don't show
# todo: show rare items if they are pre-defined
# todo: bin rare responses into "other category"
if (!length(item_nomiss)) {
cat("No non-missing values to show.")
} else if (is.numeric(item_nomiss) || dplyr::n_distinct(item_nomiss) < 20) {
plot_labelled(item_nomiss, item_name, wrap_at, go_vertical)
} else {
cat(dplyr::n_distinct(item_nomiss), " unique, categorical values, so not shown.")
}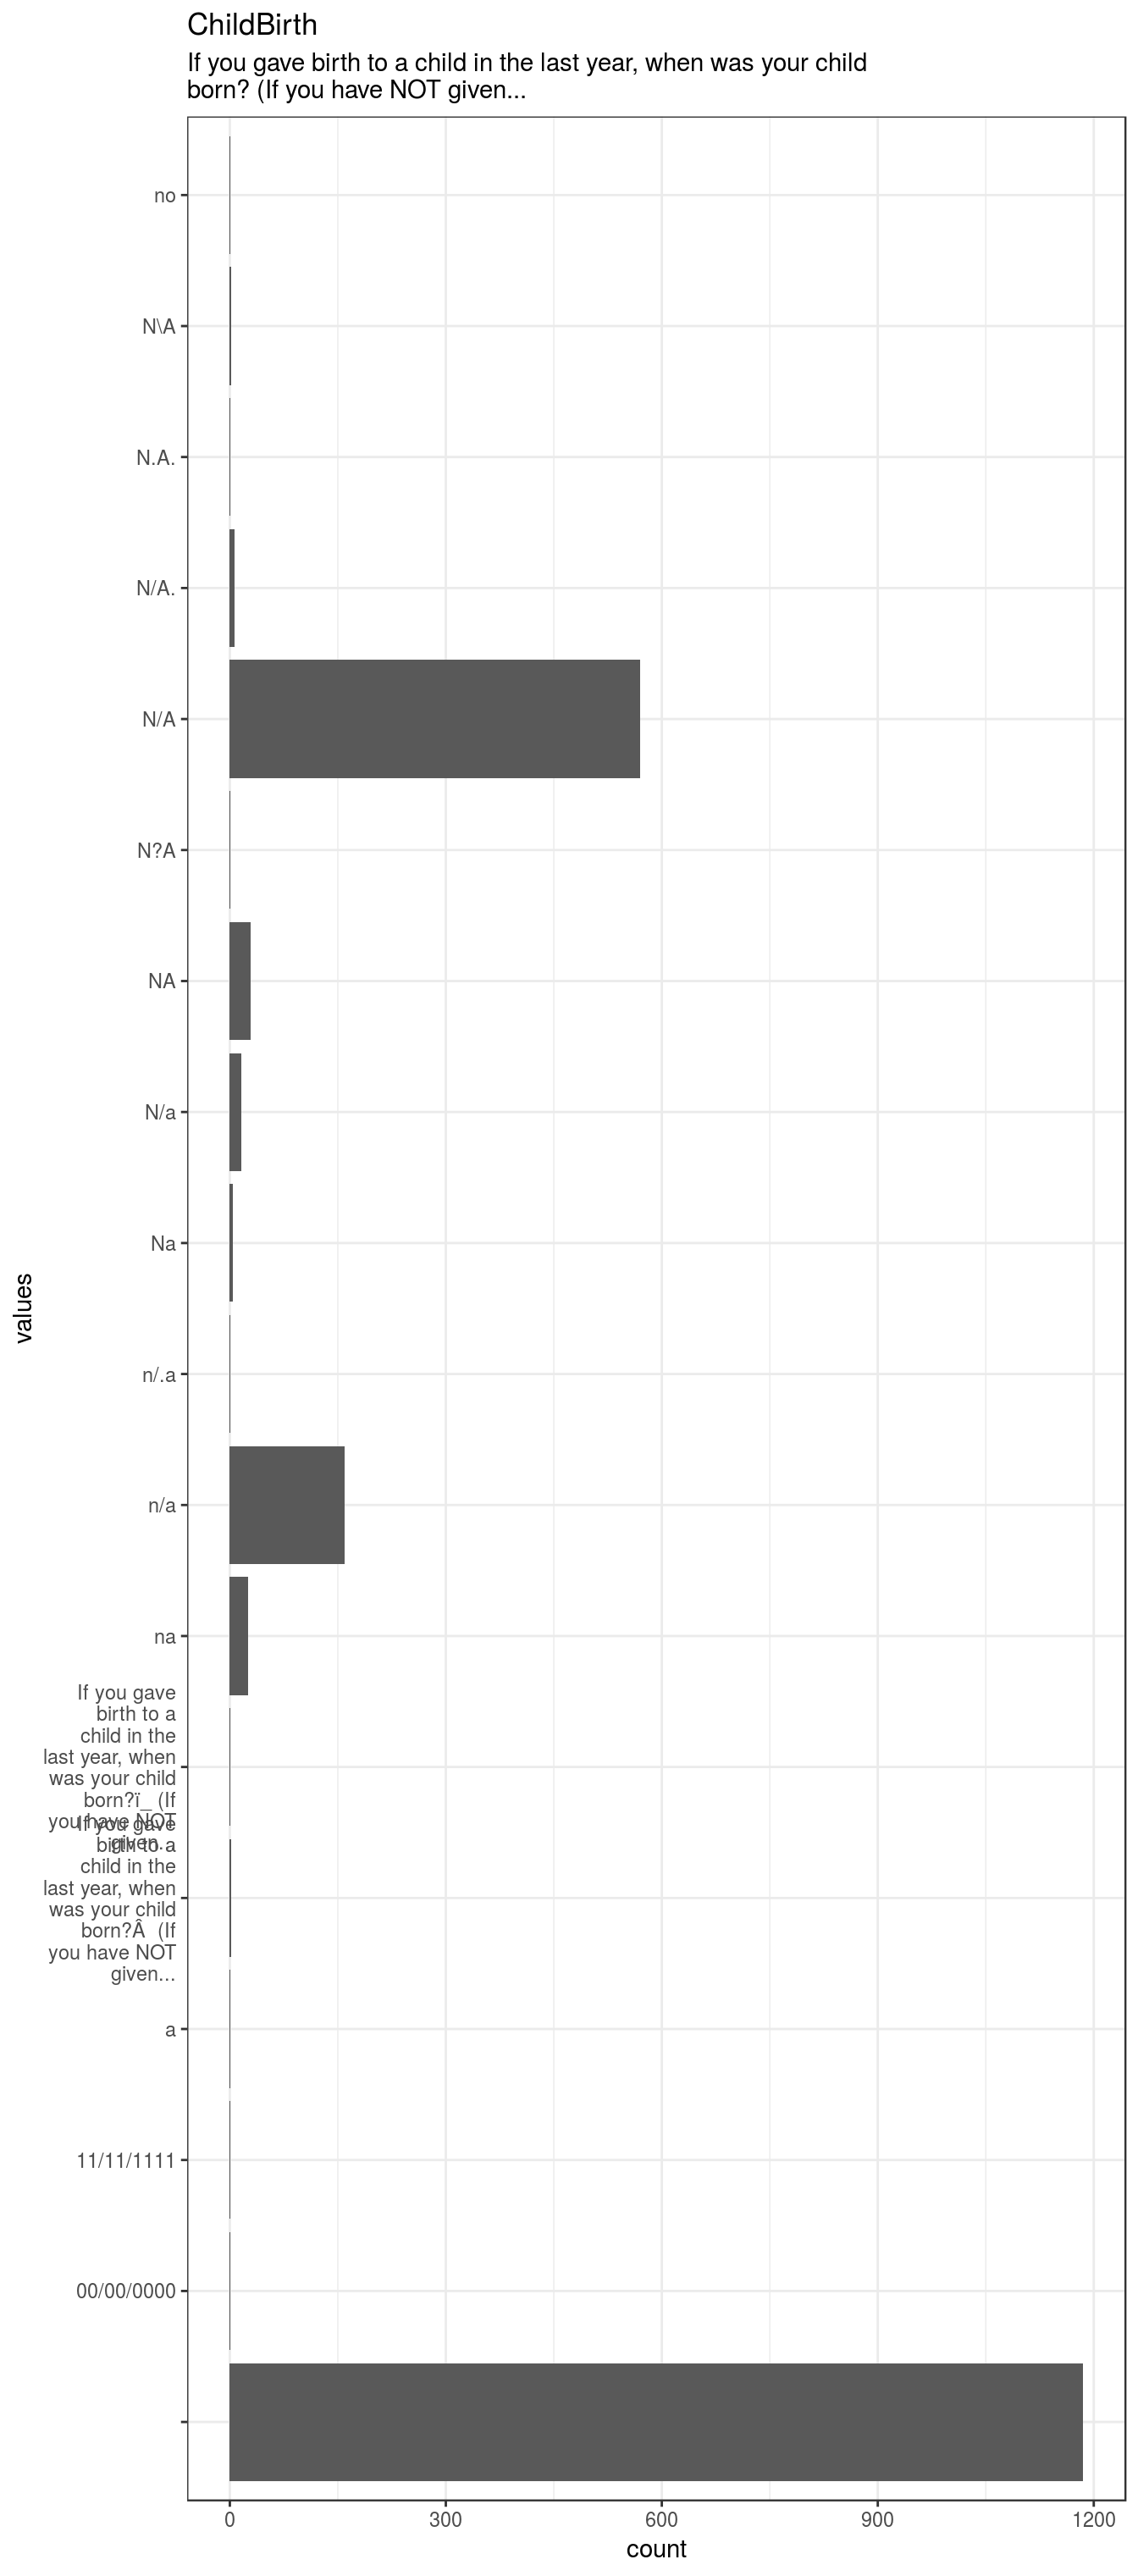
knitr::opts_chunk$set(fig.height = old_height)0 missing values.
Summary statistics
attributes(item) <- item_attributes
df = data.frame(item, stringsAsFactors = FALSE)
names(df) = html_item_name
escaped_table(codebook_table(df))| name | label | data_type | missing | complete | n | empty | n_unique | min | max | format.spss | display_width |
|---|---|---|---|---|---|---|---|---|---|---|---|
| ChildBirth | If you gave birth to a child in the last year, when was your child born? (If you have NOT given… | character | 0 | 2006 | 2006 | 1185 | 18 | 0 | 100 | A102 | 50 |
if (show_missing_values) {
plot_labelled(missing_values, item_name, wrap_at)
}if (!is.null(item_info)) {
# don't show choices again, if they're basically same thing as value labels
if (!is.null(choices) && !is.null(item_info$choices) &&
all(names(na.omit(choices)) == item_info$choices) &&
all(na.omit(choices) == names(item_info$choices))) {
item_info$choices <- NULL
}
item_info$label_parsed <-
item_info$choice_list <- item_info$study_id <- item_info$id <- NULL
pander::pander(item_info)
}if (!is.null(choices) && length(choices) && length(choices) < 30) {
pander::pander(as.list(choices))
}LastPeriod
When did your LAST menstrual period BEGIN? That is, when did your last period of menstrual bleedi…
Distribution
show_missing_values <- FALSE
if (has_labels(item)) {
missing_values <- item[is.na(haven::zap_missing(item))]
attributes(missing_values) <- attributes(item)
if (!is.null(attributes(item)$labels)) {
attributes(missing_values)$labels <- attributes(missing_values)$labels[is.na(attributes(missing_values)$labels)]
attributes(item)$labels <- attributes(item)$labels[!is.na(attributes(item)$labels)]
}
if (is.double(item)) {
show_missing_values <- length(unique(haven::na_tag(missing_values))) > 1
item <- haven::zap_missing(item)
}
if (length(item_attributes$labels) == 0 && is.numeric(item)) {
item <- haven::zap_labels(item)
}
}
item_nomiss <- item[!is.na(item)]
# unnest mc_multiple and so on
if (
is.character(item_nomiss) &&
stringr::str_detect(item_nomiss, stringr::fixed(", ")) &&
(exists("type", item_info) &&
stringr::str_detect(item_info$type, pattern = stringr::fixed("multiple")))
) {
item_nomiss <- unlist(stringr::str_split(item_nomiss, pattern = stringr::fixed(", ")))
}
attributes(item_nomiss) <- attributes(item)
old_height <- knitr::opts_chunk$get("fig.height")
non_missing_choices <- item_attributes[["labels"]]
many_labels <- length(non_missing_choices) > 7
go_vertical <- !is.numeric(item_nomiss) || many_labels
if ( go_vertical ) {
# numeric items are plotted horizontally (because that's what usually expected)
# categorical items are plotted vertically because we can use the screen real estate better this way
if (is.null(choices) ||
dplyr::n_distinct(item_nomiss) > length(non_missing_choices)) {
non_missing_choices <- unique(item_nomiss)
names(non_missing_choices) <- non_missing_choices
}
choice_multiplier <- old_height/6.5
new_height <- 2 + choice_multiplier * length(non_missing_choices)
new_height <- ifelse(new_height > 20, 20, new_height)
new_height <- ifelse(new_height < 1, 1, new_height)
knitr::opts_chunk$set(fig.height = new_height)
}
wrap_at <- knitr::opts_chunk$get("fig.width") * 10# todo: if there are free-text choices mingled in with the pre-defined ones, don't show
# todo: show rare items if they are pre-defined
# todo: bin rare responses into "other category"
if (!length(item_nomiss)) {
cat("No non-missing values to show.")
} else if (is.numeric(item_nomiss) || dplyr::n_distinct(item_nomiss) < 20) {
plot_labelled(item_nomiss, item_name, wrap_at, go_vertical)
} else {
cat(dplyr::n_distinct(item_nomiss), " unique, categorical values, so not shown.")
}## 179 unique, categorical values, so not shown.knitr::opts_chunk$set(fig.height = old_height)1047 missing values.
Summary statistics
attributes(item) <- item_attributes
df = data.frame(item, stringsAsFactors = FALSE)
names(df) = html_item_name
escaped_table(codebook_table(df))| name | label | data_type | missing | complete | n | n_unique | median | min | max | format.spss |
|---|---|---|---|---|---|---|---|---|---|---|
| LastPeriod | When did your LAST menstrual period BEGIN? That is, when did your last period of menstrual bleedi… | Date | 1047 | 959 | 2006 | 179 | 2017-05-13 | 2007-06-01 | 2917-08-30 | ADATE10 |
if (show_missing_values) {
plot_labelled(missing_values, item_name, wrap_at)
}if (!is.null(item_info)) {
# don't show choices again, if they're basically same thing as value labels
if (!is.null(choices) && !is.null(item_info$choices) &&
all(names(na.omit(choices)) == item_info$choices) &&
all(na.omit(choices) == names(item_info$choices))) {
item_info$choices <- NULL
}
item_info$label_parsed <-
item_info$choice_list <- item_info$study_id <- item_info$id <- NULL
pander::pander(item_info)
}if (!is.null(choices) && length(choices) && length(choices) < 30) {
pander::pander(as.list(choices))
}LastPeriodAcc_1
How accurate would you say this estimate is? Last Menstrual Period Date
Distribution
show_missing_values <- FALSE
if (has_labels(item)) {
missing_values <- item[is.na(haven::zap_missing(item))]
attributes(missing_values) <- attributes(item)
if (!is.null(attributes(item)$labels)) {
attributes(missing_values)$labels <- attributes(missing_values)$labels[is.na(attributes(missing_values)$labels)]
attributes(item)$labels <- attributes(item)$labels[!is.na(attributes(item)$labels)]
}
if (is.double(item)) {
show_missing_values <- length(unique(haven::na_tag(missing_values))) > 1
item <- haven::zap_missing(item)
}
if (length(item_attributes$labels) == 0 && is.numeric(item)) {
item <- haven::zap_labels(item)
}
}
item_nomiss <- item[!is.na(item)]
# unnest mc_multiple and so on
if (
is.character(item_nomiss) &&
stringr::str_detect(item_nomiss, stringr::fixed(", ")) &&
(exists("type", item_info) &&
stringr::str_detect(item_info$type, pattern = stringr::fixed("multiple")))
) {
item_nomiss <- unlist(stringr::str_split(item_nomiss, pattern = stringr::fixed(", ")))
}
attributes(item_nomiss) <- attributes(item)
old_height <- knitr::opts_chunk$get("fig.height")
non_missing_choices <- item_attributes[["labels"]]
many_labels <- length(non_missing_choices) > 7
go_vertical <- !is.numeric(item_nomiss) || many_labels
if ( go_vertical ) {
# numeric items are plotted horizontally (because that's what usually expected)
# categorical items are plotted vertically because we can use the screen real estate better this way
if (is.null(choices) ||
dplyr::n_distinct(item_nomiss) > length(non_missing_choices)) {
non_missing_choices <- unique(item_nomiss)
names(non_missing_choices) <- non_missing_choices
}
choice_multiplier <- old_height/6.5
new_height <- 2 + choice_multiplier * length(non_missing_choices)
new_height <- ifelse(new_height > 20, 20, new_height)
new_height <- ifelse(new_height < 1, 1, new_height)
knitr::opts_chunk$set(fig.height = new_height)
}
wrap_at <- knitr::opts_chunk$get("fig.width") * 10# todo: if there are free-text choices mingled in with the pre-defined ones, don't show
# todo: show rare items if they are pre-defined
# todo: bin rare responses into "other category"
if (!length(item_nomiss)) {
cat("No non-missing values to show.")
} else if (is.numeric(item_nomiss) || dplyr::n_distinct(item_nomiss) < 20) {
plot_labelled(item_nomiss, item_name, wrap_at, go_vertical)
} else {
cat(dplyr::n_distinct(item_nomiss), " unique, categorical values, so not shown.")
}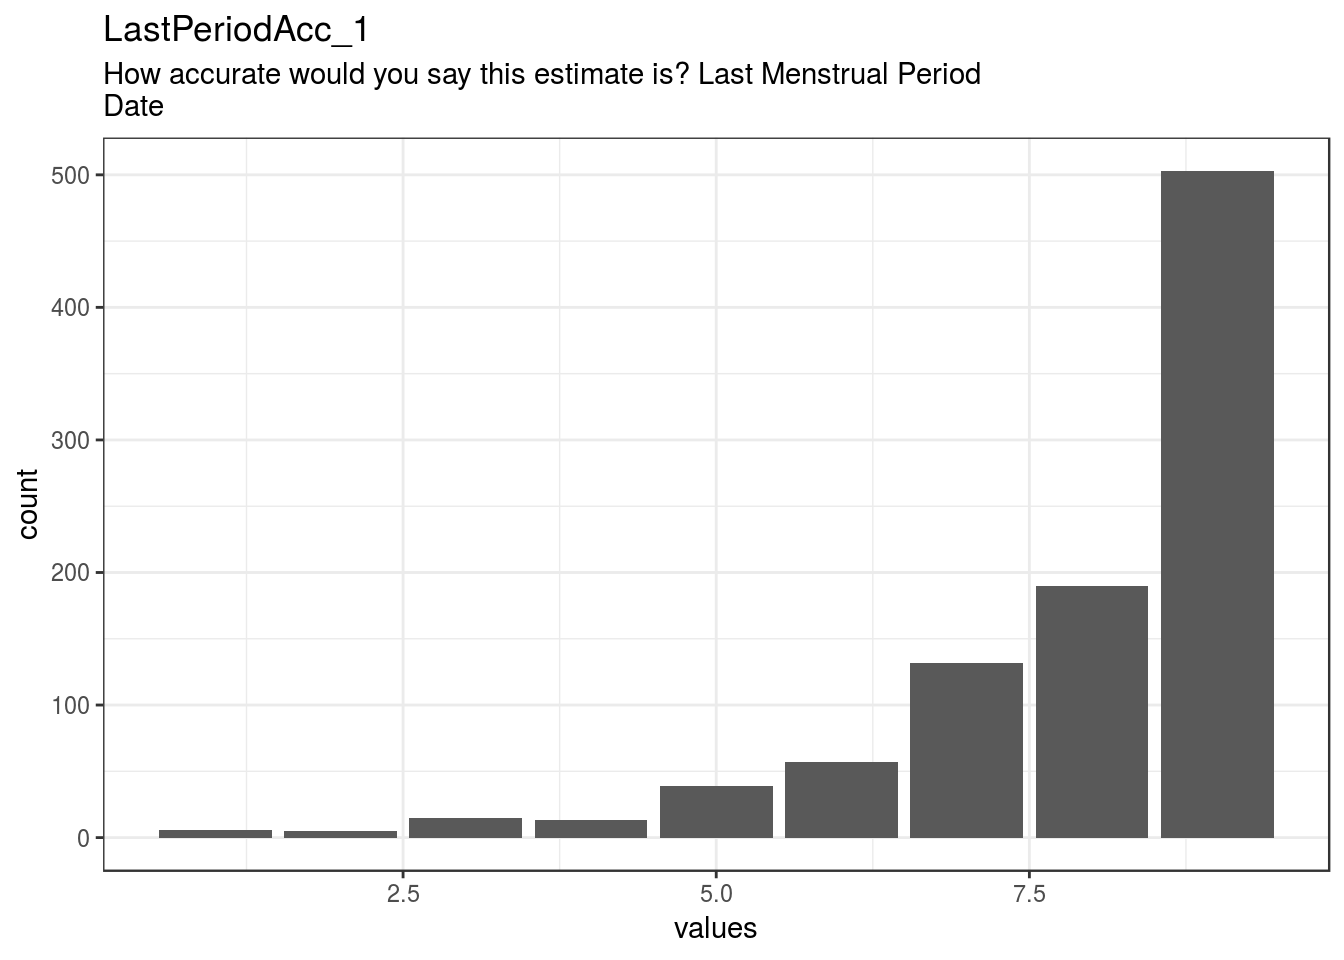
knitr::opts_chunk$set(fig.height = old_height)1046 missing values.
Summary statistics
attributes(item) <- item_attributes
df = data.frame(item, stringsAsFactors = FALSE)
names(df) = html_item_name
escaped_table(codebook_table(df))| name | label | data_type | missing | complete | n | mean | sd | p0 | p25 | p50 | p75 | p100 | hist | format.spss |
|---|---|---|---|---|---|---|---|---|---|---|---|---|---|---|
| LastPeriodAcc_1 | How accurate would you say this estimate is? Last Menstrual Period Date | numeric | 1046 | 960 | 2006 | 7.94 | 1.54 | 1 | 7 | 9 | 9 | 9 | ▁▁▁▁▁▂▃▇ | F8.0 |
if (show_missing_values) {
plot_labelled(missing_values, item_name, wrap_at)
}if (!is.null(item_info)) {
# don't show choices again, if they're basically same thing as value labels
if (!is.null(choices) && !is.null(item_info$choices) &&
all(names(na.omit(choices)) == item_info$choices) &&
all(na.omit(choices) == names(item_info$choices))) {
item_info$choices <- NULL
}
item_info$label_parsed <-
item_info$choice_list <- item_info$study_id <- item_info$id <- NULL
pander::pander(item_info)
}if (!is.null(choices) && length(choices) && length(choices) < 30) {
pander::pander(as.list(choices))
}PerBefLast
When did the menstrual period BEFORE LAST BEGIN? That is, to your best estimate, when did the per…
Distribution
show_missing_values <- FALSE
if (has_labels(item)) {
missing_values <- item[is.na(haven::zap_missing(item))]
attributes(missing_values) <- attributes(item)
if (!is.null(attributes(item)$labels)) {
attributes(missing_values)$labels <- attributes(missing_values)$labels[is.na(attributes(missing_values)$labels)]
attributes(item)$labels <- attributes(item)$labels[!is.na(attributes(item)$labels)]
}
if (is.double(item)) {
show_missing_values <- length(unique(haven::na_tag(missing_values))) > 1
item <- haven::zap_missing(item)
}
if (length(item_attributes$labels) == 0 && is.numeric(item)) {
item <- haven::zap_labels(item)
}
}
item_nomiss <- item[!is.na(item)]
# unnest mc_multiple and so on
if (
is.character(item_nomiss) &&
stringr::str_detect(item_nomiss, stringr::fixed(", ")) &&
(exists("type", item_info) &&
stringr::str_detect(item_info$type, pattern = stringr::fixed("multiple")))
) {
item_nomiss <- unlist(stringr::str_split(item_nomiss, pattern = stringr::fixed(", ")))
}
attributes(item_nomiss) <- attributes(item)
old_height <- knitr::opts_chunk$get("fig.height")
non_missing_choices <- item_attributes[["labels"]]
many_labels <- length(non_missing_choices) > 7
go_vertical <- !is.numeric(item_nomiss) || many_labels
if ( go_vertical ) {
# numeric items are plotted horizontally (because that's what usually expected)
# categorical items are plotted vertically because we can use the screen real estate better this way
if (is.null(choices) ||
dplyr::n_distinct(item_nomiss) > length(non_missing_choices)) {
non_missing_choices <- unique(item_nomiss)
names(non_missing_choices) <- non_missing_choices
}
choice_multiplier <- old_height/6.5
new_height <- 2 + choice_multiplier * length(non_missing_choices)
new_height <- ifelse(new_height > 20, 20, new_height)
new_height <- ifelse(new_height < 1, 1, new_height)
knitr::opts_chunk$set(fig.height = new_height)
}
wrap_at <- knitr::opts_chunk$get("fig.width") * 10# todo: if there are free-text choices mingled in with the pre-defined ones, don't show
# todo: show rare items if they are pre-defined
# todo: bin rare responses into "other category"
if (!length(item_nomiss)) {
cat("No non-missing values to show.")
} else if (is.numeric(item_nomiss) || dplyr::n_distinct(item_nomiss) < 20) {
plot_labelled(item_nomiss, item_name, wrap_at, go_vertical)
} else {
cat(dplyr::n_distinct(item_nomiss), " unique, categorical values, so not shown.")
}## 217 unique, categorical values, so not shown.knitr::opts_chunk$set(fig.height = old_height)1047 missing values.
Summary statistics
attributes(item) <- item_attributes
df = data.frame(item, stringsAsFactors = FALSE)
names(df) = html_item_name
escaped_table(codebook_table(df))| name | label | data_type | missing | complete | n | n_unique | median | min | max | format.spss |
|---|---|---|---|---|---|---|---|---|---|---|
| PerBefLast | When did the menstrual period BEFORE LAST BEGIN? That is, to your best estimate, when did the per… | Date | 1047 | 959 | 2006 | 217 | 2017-04-15 | 2002-10-15 | 2018-03-16 | ADATE10 |
if (show_missing_values) {
plot_labelled(missing_values, item_name, wrap_at)
}if (!is.null(item_info)) {
# don't show choices again, if they're basically same thing as value labels
if (!is.null(choices) && !is.null(item_info$choices) &&
all(names(na.omit(choices)) == item_info$choices) &&
all(na.omit(choices) == names(item_info$choices))) {
item_info$choices <- NULL
}
item_info$label_parsed <-
item_info$choice_list <- item_info$study_id <- item_info$id <- NULL
pander::pander(item_info)
}if (!is.null(choices) && length(choices) && length(choices) < 30) {
pander::pander(as.list(choices))
}PerBefLastAcc_1
How accurate would you say this estimate is?-Menstrual Period Before Last
Distribution
show_missing_values <- FALSE
if (has_labels(item)) {
missing_values <- item[is.na(haven::zap_missing(item))]
attributes(missing_values) <- attributes(item)
if (!is.null(attributes(item)$labels)) {
attributes(missing_values)$labels <- attributes(missing_values)$labels[is.na(attributes(missing_values)$labels)]
attributes(item)$labels <- attributes(item)$labels[!is.na(attributes(item)$labels)]
}
if (is.double(item)) {
show_missing_values <- length(unique(haven::na_tag(missing_values))) > 1
item <- haven::zap_missing(item)
}
if (length(item_attributes$labels) == 0 && is.numeric(item)) {
item <- haven::zap_labels(item)
}
}
item_nomiss <- item[!is.na(item)]
# unnest mc_multiple and so on
if (
is.character(item_nomiss) &&
stringr::str_detect(item_nomiss, stringr::fixed(", ")) &&
(exists("type", item_info) &&
stringr::str_detect(item_info$type, pattern = stringr::fixed("multiple")))
) {
item_nomiss <- unlist(stringr::str_split(item_nomiss, pattern = stringr::fixed(", ")))
}
attributes(item_nomiss) <- attributes(item)
old_height <- knitr::opts_chunk$get("fig.height")
non_missing_choices <- item_attributes[["labels"]]
many_labels <- length(non_missing_choices) > 7
go_vertical <- !is.numeric(item_nomiss) || many_labels
if ( go_vertical ) {
# numeric items are plotted horizontally (because that's what usually expected)
# categorical items are plotted vertically because we can use the screen real estate better this way
if (is.null(choices) ||
dplyr::n_distinct(item_nomiss) > length(non_missing_choices)) {
non_missing_choices <- unique(item_nomiss)
names(non_missing_choices) <- non_missing_choices
}
choice_multiplier <- old_height/6.5
new_height <- 2 + choice_multiplier * length(non_missing_choices)
new_height <- ifelse(new_height > 20, 20, new_height)
new_height <- ifelse(new_height < 1, 1, new_height)
knitr::opts_chunk$set(fig.height = new_height)
}
wrap_at <- knitr::opts_chunk$get("fig.width") * 10# todo: if there are free-text choices mingled in with the pre-defined ones, don't show
# todo: show rare items if they are pre-defined
# todo: bin rare responses into "other category"
if (!length(item_nomiss)) {
cat("No non-missing values to show.")
} else if (is.numeric(item_nomiss) || dplyr::n_distinct(item_nomiss) < 20) {
plot_labelled(item_nomiss, item_name, wrap_at, go_vertical)
} else {
cat(dplyr::n_distinct(item_nomiss), " unique, categorical values, so not shown.")
}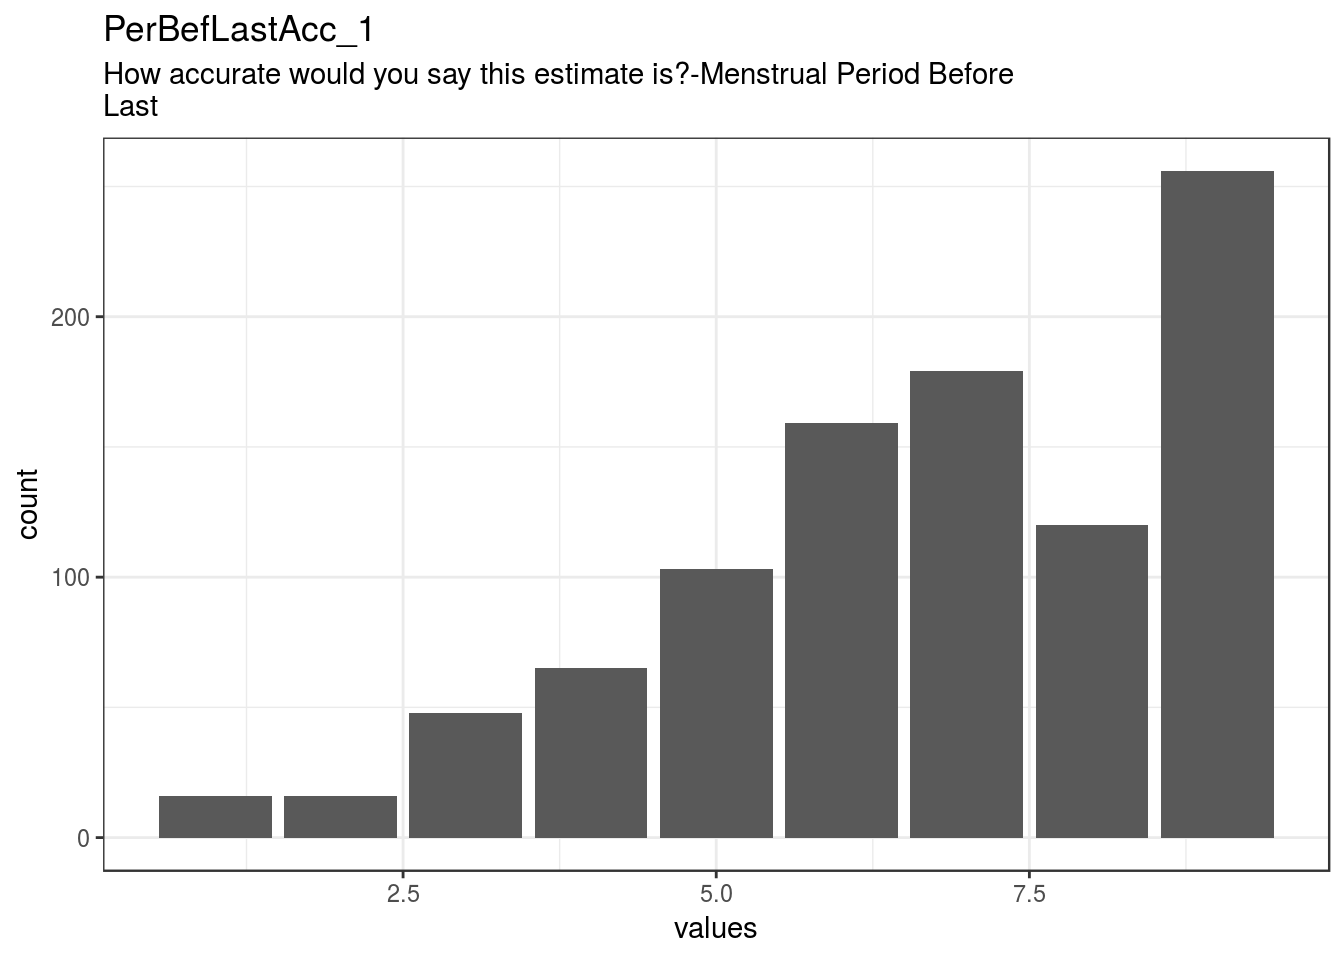
knitr::opts_chunk$set(fig.height = old_height)1044 missing values.
Summary statistics
attributes(item) <- item_attributes
df = data.frame(item, stringsAsFactors = FALSE)
names(df) = html_item_name
escaped_table(codebook_table(df))| name | label | data_type | missing | complete | n | mean | sd | p0 | p25 | p50 | p75 | p100 | hist | format.spss |
|---|---|---|---|---|---|---|---|---|---|---|---|---|---|---|
| PerBefLastAcc_1 | How accurate would you say this estimate is?-Menstrual Period Before Last | numeric | 1044 | 962 | 2006 | 6.69 | 2.03 | 1 | 5 | 7 | 9 | 9 | ▁▂▂▃▅▆▃▇ | F8.0 |
if (show_missing_values) {
plot_labelled(missing_values, item_name, wrap_at)
}if (!is.null(item_info)) {
# don't show choices again, if they're basically same thing as value labels
if (!is.null(choices) && !is.null(item_info$choices) &&
all(names(na.omit(choices)) == item_info$choices) &&
all(na.omit(choices) == names(item_info$choices))) {
item_info$choices <- NULL
}
item_info$label_parsed <-
item_info$choice_list <- item_info$study_id <- item_info$id <- NULL
pander::pander(item_info)
}if (!is.null(choices) && length(choices) && length(choices) < 30) {
pander::pander(as.list(choices))
}PerNext
When do you estimate your NEXT menstrual period will begin? That is, when do you expect the first…
Distribution
show_missing_values <- FALSE
if (has_labels(item)) {
missing_values <- item[is.na(haven::zap_missing(item))]
attributes(missing_values) <- attributes(item)
if (!is.null(attributes(item)$labels)) {
attributes(missing_values)$labels <- attributes(missing_values)$labels[is.na(attributes(missing_values)$labels)]
attributes(item)$labels <- attributes(item)$labels[!is.na(attributes(item)$labels)]
}
if (is.double(item)) {
show_missing_values <- length(unique(haven::na_tag(missing_values))) > 1
item <- haven::zap_missing(item)
}
if (length(item_attributes$labels) == 0 && is.numeric(item)) {
item <- haven::zap_labels(item)
}
}
item_nomiss <- item[!is.na(item)]
# unnest mc_multiple and so on
if (
is.character(item_nomiss) &&
stringr::str_detect(item_nomiss, stringr::fixed(", ")) &&
(exists("type", item_info) &&
stringr::str_detect(item_info$type, pattern = stringr::fixed("multiple")))
) {
item_nomiss <- unlist(stringr::str_split(item_nomiss, pattern = stringr::fixed(", ")))
}
attributes(item_nomiss) <- attributes(item)
old_height <- knitr::opts_chunk$get("fig.height")
non_missing_choices <- item_attributes[["labels"]]
many_labels <- length(non_missing_choices) > 7
go_vertical <- !is.numeric(item_nomiss) || many_labels
if ( go_vertical ) {
# numeric items are plotted horizontally (because that's what usually expected)
# categorical items are plotted vertically because we can use the screen real estate better this way
if (is.null(choices) ||
dplyr::n_distinct(item_nomiss) > length(non_missing_choices)) {
non_missing_choices <- unique(item_nomiss)
names(non_missing_choices) <- non_missing_choices
}
choice_multiplier <- old_height/6.5
new_height <- 2 + choice_multiplier * length(non_missing_choices)
new_height <- ifelse(new_height > 20, 20, new_height)
new_height <- ifelse(new_height < 1, 1, new_height)
knitr::opts_chunk$set(fig.height = new_height)
}
wrap_at <- knitr::opts_chunk$get("fig.width") * 10# todo: if there are free-text choices mingled in with the pre-defined ones, don't show
# todo: show rare items if they are pre-defined
# todo: bin rare responses into "other category"
if (!length(item_nomiss)) {
cat("No non-missing values to show.")
} else if (is.numeric(item_nomiss) || dplyr::n_distinct(item_nomiss) < 20) {
plot_labelled(item_nomiss, item_name, wrap_at, go_vertical)
} else {
cat(dplyr::n_distinct(item_nomiss), " unique, categorical values, so not shown.")
}## 189 unique, categorical values, so not shown.knitr::opts_chunk$set(fig.height = old_height)1045 missing values.
Summary statistics
attributes(item) <- item_attributes
df = data.frame(item, stringsAsFactors = FALSE)
names(df) = html_item_name
escaped_table(codebook_table(df))| name | label | data_type | missing | complete | n | n_unique | median | min | max | format.spss |
|---|---|---|---|---|---|---|---|---|---|---|
| PerNext | When do you estimate your NEXT menstrual period will begin? That is, when do you expect the first… | Date | 1045 | 961 | 2006 | 189 | 2017-06-16 | 2001-01-01 | 2050-01-01 | ADATE10 |
if (show_missing_values) {
plot_labelled(missing_values, item_name, wrap_at)
}if (!is.null(item_info)) {
# don't show choices again, if they're basically same thing as value labels
if (!is.null(choices) && !is.null(item_info$choices) &&
all(names(na.omit(choices)) == item_info$choices) &&
all(na.omit(choices) == names(item_info$choices))) {
item_info$choices <- NULL
}
item_info$label_parsed <-
item_info$choice_list <- item_info$study_id <- item_info$id <- NULL
pander::pander(item_info)
}if (!is.null(choices) && length(choices) && length(choices) < 30) {
pander::pander(as.list(choices))
}PerNextAcc_1
How accurate would you say this estimate is?-Next Menstrual Period
Distribution
show_missing_values <- FALSE
if (has_labels(item)) {
missing_values <- item[is.na(haven::zap_missing(item))]
attributes(missing_values) <- attributes(item)
if (!is.null(attributes(item)$labels)) {
attributes(missing_values)$labels <- attributes(missing_values)$labels[is.na(attributes(missing_values)$labels)]
attributes(item)$labels <- attributes(item)$labels[!is.na(attributes(item)$labels)]
}
if (is.double(item)) {
show_missing_values <- length(unique(haven::na_tag(missing_values))) > 1
item <- haven::zap_missing(item)
}
if (length(item_attributes$labels) == 0 && is.numeric(item)) {
item <- haven::zap_labels(item)
}
}
item_nomiss <- item[!is.na(item)]
# unnest mc_multiple and so on
if (
is.character(item_nomiss) &&
stringr::str_detect(item_nomiss, stringr::fixed(", ")) &&
(exists("type", item_info) &&
stringr::str_detect(item_info$type, pattern = stringr::fixed("multiple")))
) {
item_nomiss <- unlist(stringr::str_split(item_nomiss, pattern = stringr::fixed(", ")))
}
attributes(item_nomiss) <- attributes(item)
old_height <- knitr::opts_chunk$get("fig.height")
non_missing_choices <- item_attributes[["labels"]]
many_labels <- length(non_missing_choices) > 7
go_vertical <- !is.numeric(item_nomiss) || many_labels
if ( go_vertical ) {
# numeric items are plotted horizontally (because that's what usually expected)
# categorical items are plotted vertically because we can use the screen real estate better this way
if (is.null(choices) ||
dplyr::n_distinct(item_nomiss) > length(non_missing_choices)) {
non_missing_choices <- unique(item_nomiss)
names(non_missing_choices) <- non_missing_choices
}
choice_multiplier <- old_height/6.5
new_height <- 2 + choice_multiplier * length(non_missing_choices)
new_height <- ifelse(new_height > 20, 20, new_height)
new_height <- ifelse(new_height < 1, 1, new_height)
knitr::opts_chunk$set(fig.height = new_height)
}
wrap_at <- knitr::opts_chunk$get("fig.width") * 10# todo: if there are free-text choices mingled in with the pre-defined ones, don't show
# todo: show rare items if they are pre-defined
# todo: bin rare responses into "other category"
if (!length(item_nomiss)) {
cat("No non-missing values to show.")
} else if (is.numeric(item_nomiss) || dplyr::n_distinct(item_nomiss) < 20) {
plot_labelled(item_nomiss, item_name, wrap_at, go_vertical)
} else {
cat(dplyr::n_distinct(item_nomiss), " unique, categorical values, so not shown.")
}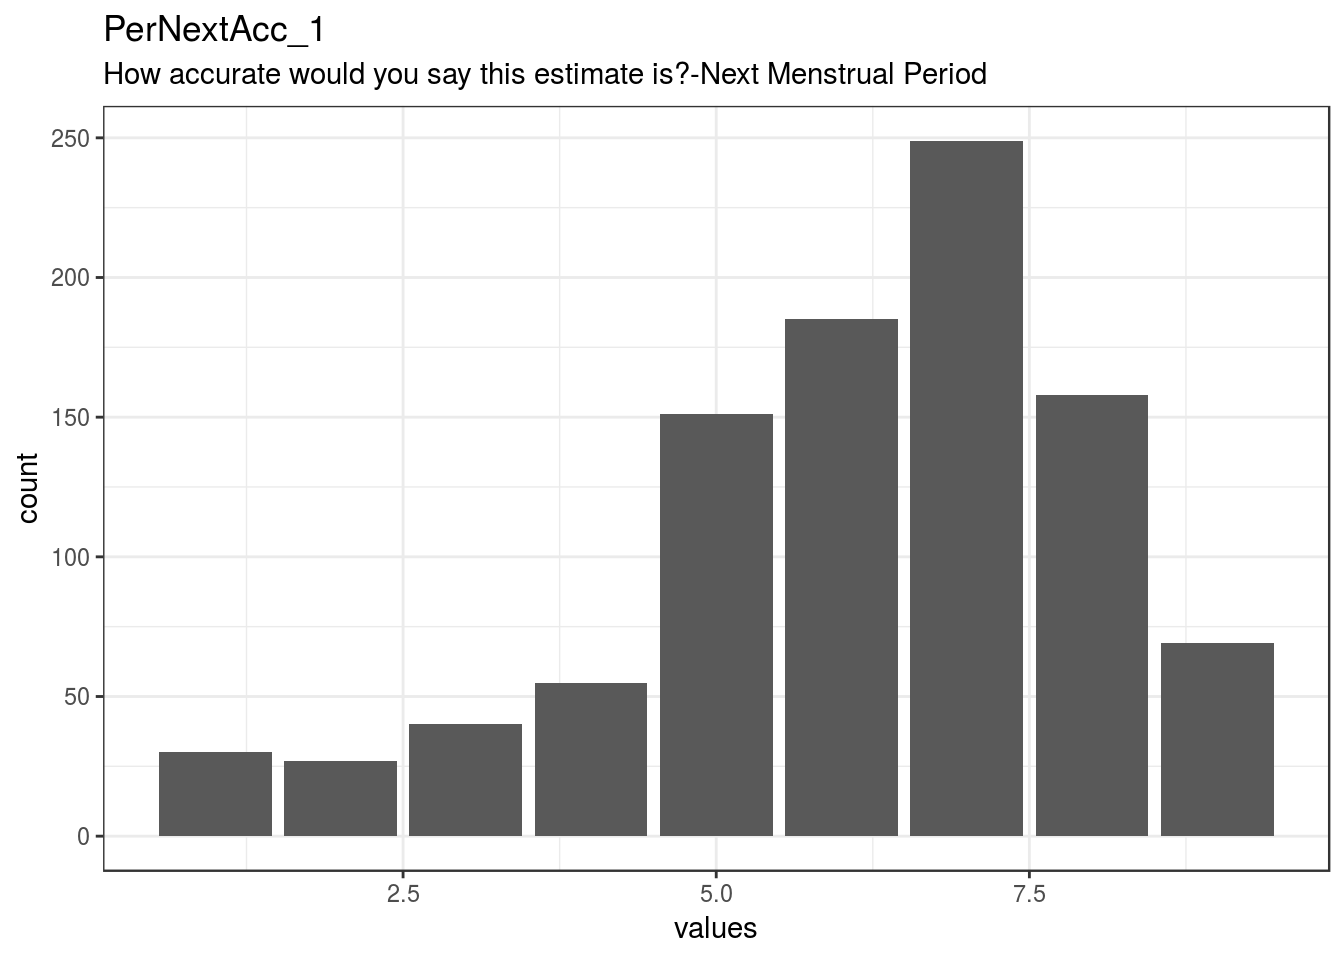
knitr::opts_chunk$set(fig.height = old_height)1042 missing values.
Summary statistics
attributes(item) <- item_attributes
df = data.frame(item, stringsAsFactors = FALSE)
names(df) = html_item_name
escaped_table(codebook_table(df))| name | label | data_type | missing | complete | n | mean | sd | p0 | p25 | p50 | p75 | p100 | hist | format.spss |
|---|---|---|---|---|---|---|---|---|---|---|---|---|---|---|
| PerNextAcc_1 | How accurate would you say this estimate is?-Next Menstrual Period | numeric | 1042 | 964 | 2006 | 6.14 | 1.88 | 1 | 5 | 6 | 7 | 9 | ▂▁▂▅▆▇▅▂ | F8.0 |
if (show_missing_values) {
plot_labelled(missing_values, item_name, wrap_at)
}if (!is.null(item_info)) {
# don't show choices again, if they're basically same thing as value labels
if (!is.null(choices) && !is.null(item_info$choices) &&
all(names(na.omit(choices)) == item_info$choices) &&
all(na.omit(choices) == names(item_info$choices))) {
item_info$choices <- NULL
}
item_info$label_parsed <-
item_info$choice_list <- item_info$study_id <- item_info$id <- NULL
pander::pander(item_info)
}if (!is.null(choices) && length(choices) && length(choices) < 30) {
pander::pander(as.list(choices))
}CycleLength
What is the AVERAGE LENGTH of your menstrual cycle (total number of days from the first day of me…
Distribution
show_missing_values <- FALSE
if (has_labels(item)) {
missing_values <- item[is.na(haven::zap_missing(item))]
attributes(missing_values) <- attributes(item)
if (!is.null(attributes(item)$labels)) {
attributes(missing_values)$labels <- attributes(missing_values)$labels[is.na(attributes(missing_values)$labels)]
attributes(item)$labels <- attributes(item)$labels[!is.na(attributes(item)$labels)]
}
if (is.double(item)) {
show_missing_values <- length(unique(haven::na_tag(missing_values))) > 1
item <- haven::zap_missing(item)
}
if (length(item_attributes$labels) == 0 && is.numeric(item)) {
item <- haven::zap_labels(item)
}
}
item_nomiss <- item[!is.na(item)]
# unnest mc_multiple and so on
if (
is.character(item_nomiss) &&
stringr::str_detect(item_nomiss, stringr::fixed(", ")) &&
(exists("type", item_info) &&
stringr::str_detect(item_info$type, pattern = stringr::fixed("multiple")))
) {
item_nomiss <- unlist(stringr::str_split(item_nomiss, pattern = stringr::fixed(", ")))
}
attributes(item_nomiss) <- attributes(item)
old_height <- knitr::opts_chunk$get("fig.height")
non_missing_choices <- item_attributes[["labels"]]
many_labels <- length(non_missing_choices) > 7
go_vertical <- !is.numeric(item_nomiss) || many_labels
if ( go_vertical ) {
# numeric items are plotted horizontally (because that's what usually expected)
# categorical items are plotted vertically because we can use the screen real estate better this way
if (is.null(choices) ||
dplyr::n_distinct(item_nomiss) > length(non_missing_choices)) {
non_missing_choices <- unique(item_nomiss)
names(non_missing_choices) <- non_missing_choices
}
choice_multiplier <- old_height/6.5
new_height <- 2 + choice_multiplier * length(non_missing_choices)
new_height <- ifelse(new_height > 20, 20, new_height)
new_height <- ifelse(new_height < 1, 1, new_height)
knitr::opts_chunk$set(fig.height = new_height)
}
wrap_at <- knitr::opts_chunk$get("fig.width") * 10# todo: if there are free-text choices mingled in with the pre-defined ones, don't show
# todo: show rare items if they are pre-defined
# todo: bin rare responses into "other category"
if (!length(item_nomiss)) {
cat("No non-missing values to show.")
} else if (is.numeric(item_nomiss) || dplyr::n_distinct(item_nomiss) < 20) {
plot_labelled(item_nomiss, item_name, wrap_at, go_vertical)
} else {
cat(dplyr::n_distinct(item_nomiss), " unique, categorical values, so not shown.")
}## 51 unique, categorical values, so not shown.knitr::opts_chunk$set(fig.height = old_height)0 missing values.
Summary statistics
attributes(item) <- item_attributes
df = data.frame(item, stringsAsFactors = FALSE)
names(df) = html_item_name
escaped_table(codebook_table(df))| name | label | data_type | missing | complete | n | empty | n_unique | min | max | format.spss | display_width |
|---|---|---|---|---|---|---|---|---|---|---|---|
| CycleLength | What is the AVERAGE LENGTH of your menstrual cycle (total number of days from the first day of me… | character | 0 | 2006 | 2006 | 1262 | 51 | 0 | 100 | A100 | 23 |
if (show_missing_values) {
plot_labelled(missing_values, item_name, wrap_at)
}if (!is.null(item_info)) {
# don't show choices again, if they're basically same thing as value labels
if (!is.null(choices) && !is.null(item_info$choices) &&
all(names(na.omit(choices)) == item_info$choices) &&
all(na.omit(choices) == names(item_info$choices))) {
item_info$choices <- NULL
}
item_info$label_parsed <-
item_info$choice_list <- item_info$study_id <- item_info$id <- NULL
pander::pander(item_info)
}if (!is.null(choices) && length(choices) && length(choices) < 30) {
pander::pander(as.list(choices))
}CycleLengthAcc_1
How accurate would you say this estimate is?-Average Cycle Length
Distribution
show_missing_values <- FALSE
if (has_labels(item)) {
missing_values <- item[is.na(haven::zap_missing(item))]
attributes(missing_values) <- attributes(item)
if (!is.null(attributes(item)$labels)) {
attributes(missing_values)$labels <- attributes(missing_values)$labels[is.na(attributes(missing_values)$labels)]
attributes(item)$labels <- attributes(item)$labels[!is.na(attributes(item)$labels)]
}
if (is.double(item)) {
show_missing_values <- length(unique(haven::na_tag(missing_values))) > 1
item <- haven::zap_missing(item)
}
if (length(item_attributes$labels) == 0 && is.numeric(item)) {
item <- haven::zap_labels(item)
}
}
item_nomiss <- item[!is.na(item)]
# unnest mc_multiple and so on
if (
is.character(item_nomiss) &&
stringr::str_detect(item_nomiss, stringr::fixed(", ")) &&
(exists("type", item_info) &&
stringr::str_detect(item_info$type, pattern = stringr::fixed("multiple")))
) {
item_nomiss <- unlist(stringr::str_split(item_nomiss, pattern = stringr::fixed(", ")))
}
attributes(item_nomiss) <- attributes(item)
old_height <- knitr::opts_chunk$get("fig.height")
non_missing_choices <- item_attributes[["labels"]]
many_labels <- length(non_missing_choices) > 7
go_vertical <- !is.numeric(item_nomiss) || many_labels
if ( go_vertical ) {
# numeric items are plotted horizontally (because that's what usually expected)
# categorical items are plotted vertically because we can use the screen real estate better this way
if (is.null(choices) ||
dplyr::n_distinct(item_nomiss) > length(non_missing_choices)) {
non_missing_choices <- unique(item_nomiss)
names(non_missing_choices) <- non_missing_choices
}
choice_multiplier <- old_height/6.5
new_height <- 2 + choice_multiplier * length(non_missing_choices)
new_height <- ifelse(new_height > 20, 20, new_height)
new_height <- ifelse(new_height < 1, 1, new_height)
knitr::opts_chunk$set(fig.height = new_height)
}
wrap_at <- knitr::opts_chunk$get("fig.width") * 10# todo: if there are free-text choices mingled in with the pre-defined ones, don't show
# todo: show rare items if they are pre-defined
# todo: bin rare responses into "other category"
if (!length(item_nomiss)) {
cat("No non-missing values to show.")
} else if (is.numeric(item_nomiss) || dplyr::n_distinct(item_nomiss) < 20) {
plot_labelled(item_nomiss, item_name, wrap_at, go_vertical)
} else {
cat(dplyr::n_distinct(item_nomiss), " unique, categorical values, so not shown.")
}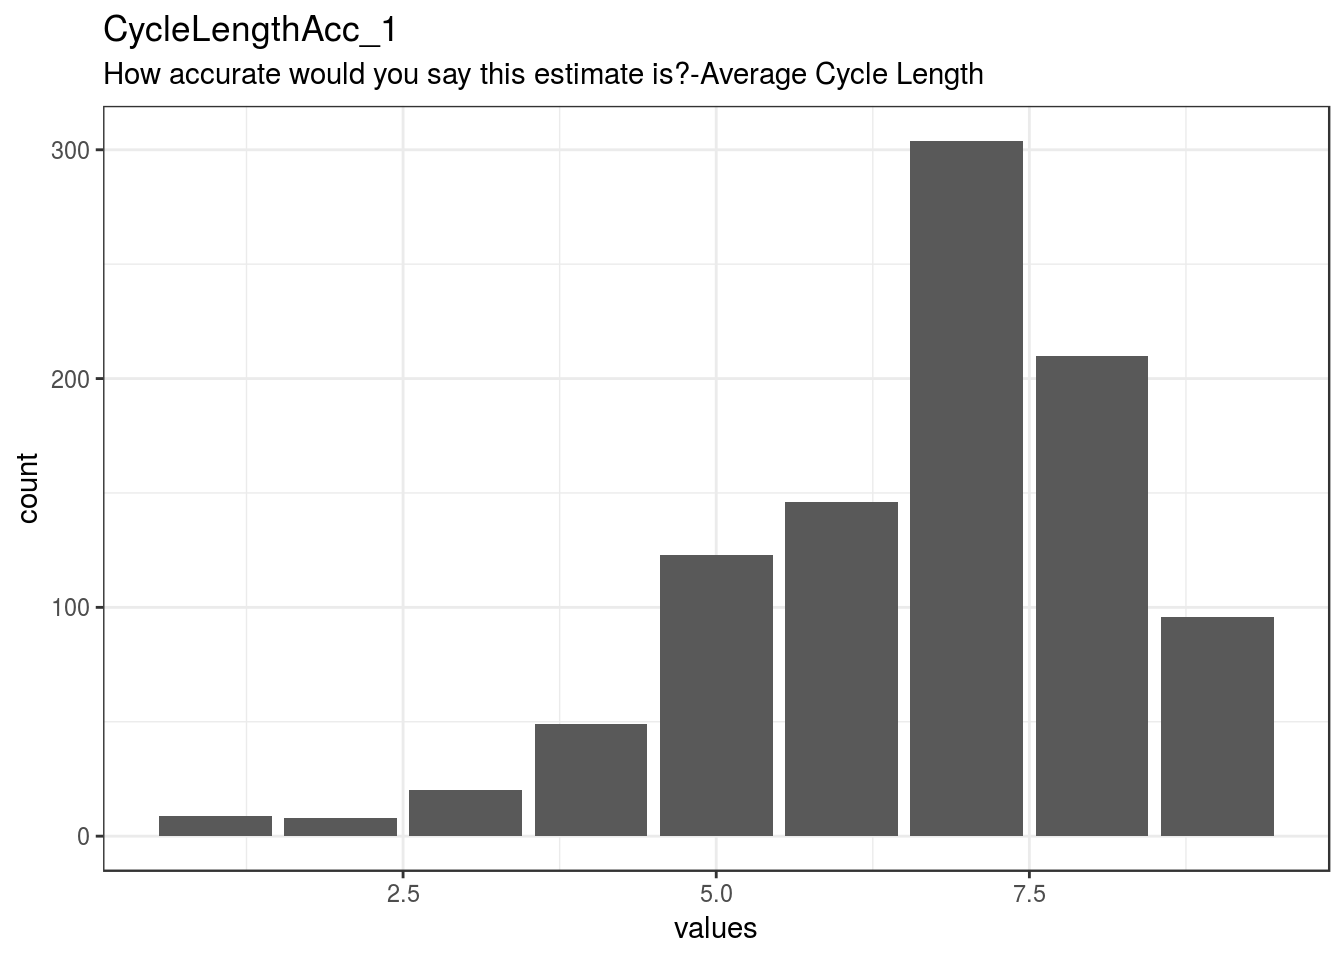
knitr::opts_chunk$set(fig.height = old_height)1041 missing values.
Summary statistics
attributes(item) <- item_attributes
df = data.frame(item, stringsAsFactors = FALSE)
names(df) = html_item_name
escaped_table(codebook_table(df))| name | label | data_type | missing | complete | n | mean | sd | p0 | p25 | p50 | p75 | p100 | hist | format.spss |
|---|---|---|---|---|---|---|---|---|---|---|---|---|---|---|
| CycleLengthAcc_1 | How accurate would you say this estimate is?-Average Cycle Length | numeric | 1041 | 965 | 2006 | 6.68 | 1.58 | 1 | 6 | 7 | 8 | 9 | ▁▁▁▃▃▇▆▂ | F8.0 |
if (show_missing_values) {
plot_labelled(missing_values, item_name, wrap_at)
}if (!is.null(item_info)) {
# don't show choices again, if they're basically same thing as value labels
if (!is.null(choices) && !is.null(item_info$choices) &&
all(names(na.omit(choices)) == item_info$choices) &&
all(na.omit(choices) == names(item_info$choices))) {
item_info$choices <- NULL
}
item_info$label_parsed <-
item_info$choice_list <- item_info$study_id <- item_info$id <- NULL
pander::pander(item_info)
}if (!is.null(choices) && length(choices) && length(choices) < 30) {
pander::pander(as.list(choices))
}conriskexclusion
0=keep, 1=nevermen, 2=menstop, 3=HRT, 4=HorCon3mon, 5=pregnant, 6=childbirth, 7=missingdata, 8=avgcyclelessthan24, 9=avgcyclegreaterthan36, 10=impossible data
Distribution
show_missing_values <- FALSE
if (has_labels(item)) {
missing_values <- item[is.na(haven::zap_missing(item))]
attributes(missing_values) <- attributes(item)
if (!is.null(attributes(item)$labels)) {
attributes(missing_values)$labels <- attributes(missing_values)$labels[is.na(attributes(missing_values)$labels)]
attributes(item)$labels <- attributes(item)$labels[!is.na(attributes(item)$labels)]
}
if (is.double(item)) {
show_missing_values <- length(unique(haven::na_tag(missing_values))) > 1
item <- haven::zap_missing(item)
}
if (length(item_attributes$labels) == 0 && is.numeric(item)) {
item <- haven::zap_labels(item)
}
}
item_nomiss <- item[!is.na(item)]
# unnest mc_multiple and so on
if (
is.character(item_nomiss) &&
stringr::str_detect(item_nomiss, stringr::fixed(", ")) &&
(exists("type", item_info) &&
stringr::str_detect(item_info$type, pattern = stringr::fixed("multiple")))
) {
item_nomiss <- unlist(stringr::str_split(item_nomiss, pattern = stringr::fixed(", ")))
}
attributes(item_nomiss) <- attributes(item)
old_height <- knitr::opts_chunk$get("fig.height")
non_missing_choices <- item_attributes[["labels"]]
many_labels <- length(non_missing_choices) > 7
go_vertical <- !is.numeric(item_nomiss) || many_labels
if ( go_vertical ) {
# numeric items are plotted horizontally (because that's what usually expected)
# categorical items are plotted vertically because we can use the screen real estate better this way
if (is.null(choices) ||
dplyr::n_distinct(item_nomiss) > length(non_missing_choices)) {
non_missing_choices <- unique(item_nomiss)
names(non_missing_choices) <- non_missing_choices
}
choice_multiplier <- old_height/6.5
new_height <- 2 + choice_multiplier * length(non_missing_choices)
new_height <- ifelse(new_height > 20, 20, new_height)
new_height <- ifelse(new_height < 1, 1, new_height)
knitr::opts_chunk$set(fig.height = new_height)
}
wrap_at <- knitr::opts_chunk$get("fig.width") * 10# todo: if there are free-text choices mingled in with the pre-defined ones, don't show
# todo: show rare items if they are pre-defined
# todo: bin rare responses into "other category"
if (!length(item_nomiss)) {
cat("No non-missing values to show.")
} else if (is.numeric(item_nomiss) || dplyr::n_distinct(item_nomiss) < 20) {
plot_labelled(item_nomiss, item_name, wrap_at, go_vertical)
} else {
cat(dplyr::n_distinct(item_nomiss), " unique, categorical values, so not shown.")
}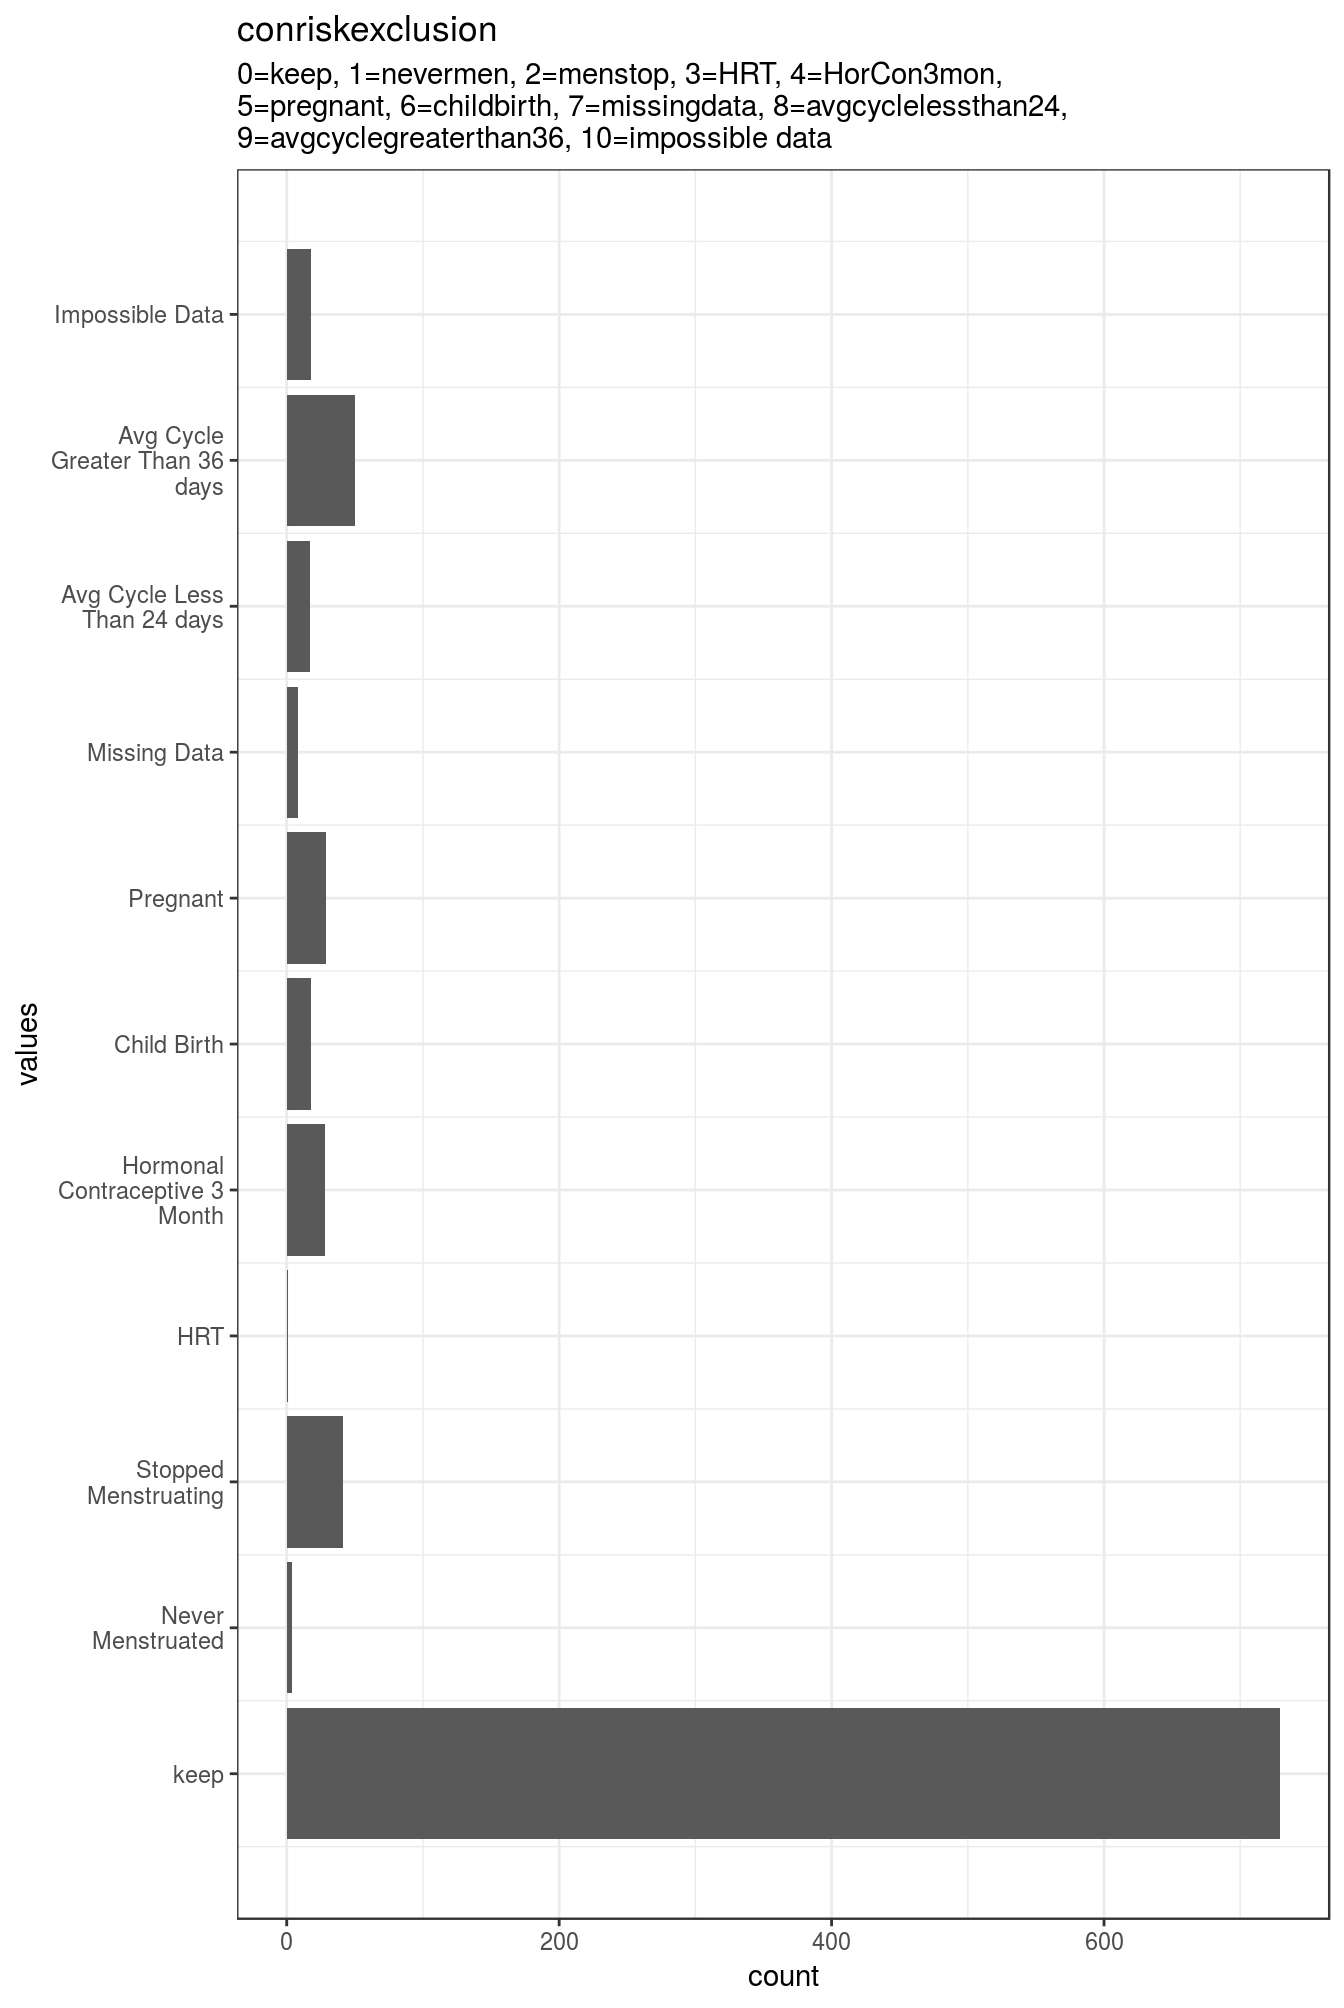
knitr::opts_chunk$set(fig.height = old_height)1063 missing values.
Summary statistics
attributes(item) <- item_attributes
df = data.frame(item, stringsAsFactors = FALSE)
names(df) = html_item_name
escaped_table(codebook_table(df))| name | label | data_type | value_labels | missing | complete | n | mean | sd | p0 | p25 | p50 | p75 | p100 | hist | format.spss |
|---|---|---|---|---|---|---|---|---|---|---|---|---|---|---|---|
| conriskexclusion | 0=keep, 1=nevermen, 2=menstop, 3=HRT, 4=HorCon3mon, 5=pregnant, 6=childbirth, 7=missingdata, 8=avgcyclelessthan24, 9=avgcyclegreaterthan36, 10=impossible data | numeric | 0. keep, 1. Never Menstruated, 2. Stopped Menstruating, 3. HRT, 4. Hormonal Contraceptive 3 Month, 5. Child Birth, 6. Pregnant, 7. Missing Data, 8. Avg Cycle Less Than 24 days, 9. Avg Cycle Greater Than 36 days, 10. Impossible Data |
1063 | 943 | 2006 | 1.36 | 2.86 | 0 | 0 | 0 | 0 | 10 | ▇▁▁▁▁▁▁▁ | F8.0 |
if (show_missing_values) {
plot_labelled(missing_values, item_name, wrap_at)
}if (!is.null(item_info)) {
# don't show choices again, if they're basically same thing as value labels
if (!is.null(choices) && !is.null(item_info$choices) &&
all(names(na.omit(choices)) == item_info$choices) &&
all(na.omit(choices) == names(item_info$choices))) {
item_info$choices <- NULL
}
item_info$label_parsed <-
item_info$choice_list <- item_info$study_id <- item_info$id <- NULL
pander::pander(item_info)
}Value labels
if (!is.null(choices) && length(choices) && length(choices) < 30) {
pander::pander(as.list(choices))
}- keep: 0
- Never Menstruated: 1
- Stopped Menstruating: 2
- HRT: 3
- Hormonal Contraceptive 3 Month: 4
- Child Birth: 5
- Pregnant: 6
- Missing Data: 7
- Avg Cycle Less Than 24 days: 8
- Avg Cycle Greater Than 36 days: 9
- Impossible Data: 10
weightedaveragecycle
weighted average cycle length
Distribution
show_missing_values <- FALSE
if (has_labels(item)) {
missing_values <- item[is.na(haven::zap_missing(item))]
attributes(missing_values) <- attributes(item)
if (!is.null(attributes(item)$labels)) {
attributes(missing_values)$labels <- attributes(missing_values)$labels[is.na(attributes(missing_values)$labels)]
attributes(item)$labels <- attributes(item)$labels[!is.na(attributes(item)$labels)]
}
if (is.double(item)) {
show_missing_values <- length(unique(haven::na_tag(missing_values))) > 1
item <- haven::zap_missing(item)
}
if (length(item_attributes$labels) == 0 && is.numeric(item)) {
item <- haven::zap_labels(item)
}
}
item_nomiss <- item[!is.na(item)]
# unnest mc_multiple and so on
if (
is.character(item_nomiss) &&
stringr::str_detect(item_nomiss, stringr::fixed(", ")) &&
(exists("type", item_info) &&
stringr::str_detect(item_info$type, pattern = stringr::fixed("multiple")))
) {
item_nomiss <- unlist(stringr::str_split(item_nomiss, pattern = stringr::fixed(", ")))
}
attributes(item_nomiss) <- attributes(item)
old_height <- knitr::opts_chunk$get("fig.height")
non_missing_choices <- item_attributes[["labels"]]
many_labels <- length(non_missing_choices) > 7
go_vertical <- !is.numeric(item_nomiss) || many_labels
if ( go_vertical ) {
# numeric items are plotted horizontally (because that's what usually expected)
# categorical items are plotted vertically because we can use the screen real estate better this way
if (is.null(choices) ||
dplyr::n_distinct(item_nomiss) > length(non_missing_choices)) {
non_missing_choices <- unique(item_nomiss)
names(non_missing_choices) <- non_missing_choices
}
choice_multiplier <- old_height/6.5
new_height <- 2 + choice_multiplier * length(non_missing_choices)
new_height <- ifelse(new_height > 20, 20, new_height)
new_height <- ifelse(new_height < 1, 1, new_height)
knitr::opts_chunk$set(fig.height = new_height)
}
wrap_at <- knitr::opts_chunk$get("fig.width") * 10# todo: if there are free-text choices mingled in with the pre-defined ones, don't show
# todo: show rare items if they are pre-defined
# todo: bin rare responses into "other category"
if (!length(item_nomiss)) {
cat("No non-missing values to show.")
} else if (is.numeric(item_nomiss) || dplyr::n_distinct(item_nomiss) < 20) {
plot_labelled(item_nomiss, item_name, wrap_at, go_vertical)
} else {
cat(dplyr::n_distinct(item_nomiss), " unique, categorical values, so not shown.")
}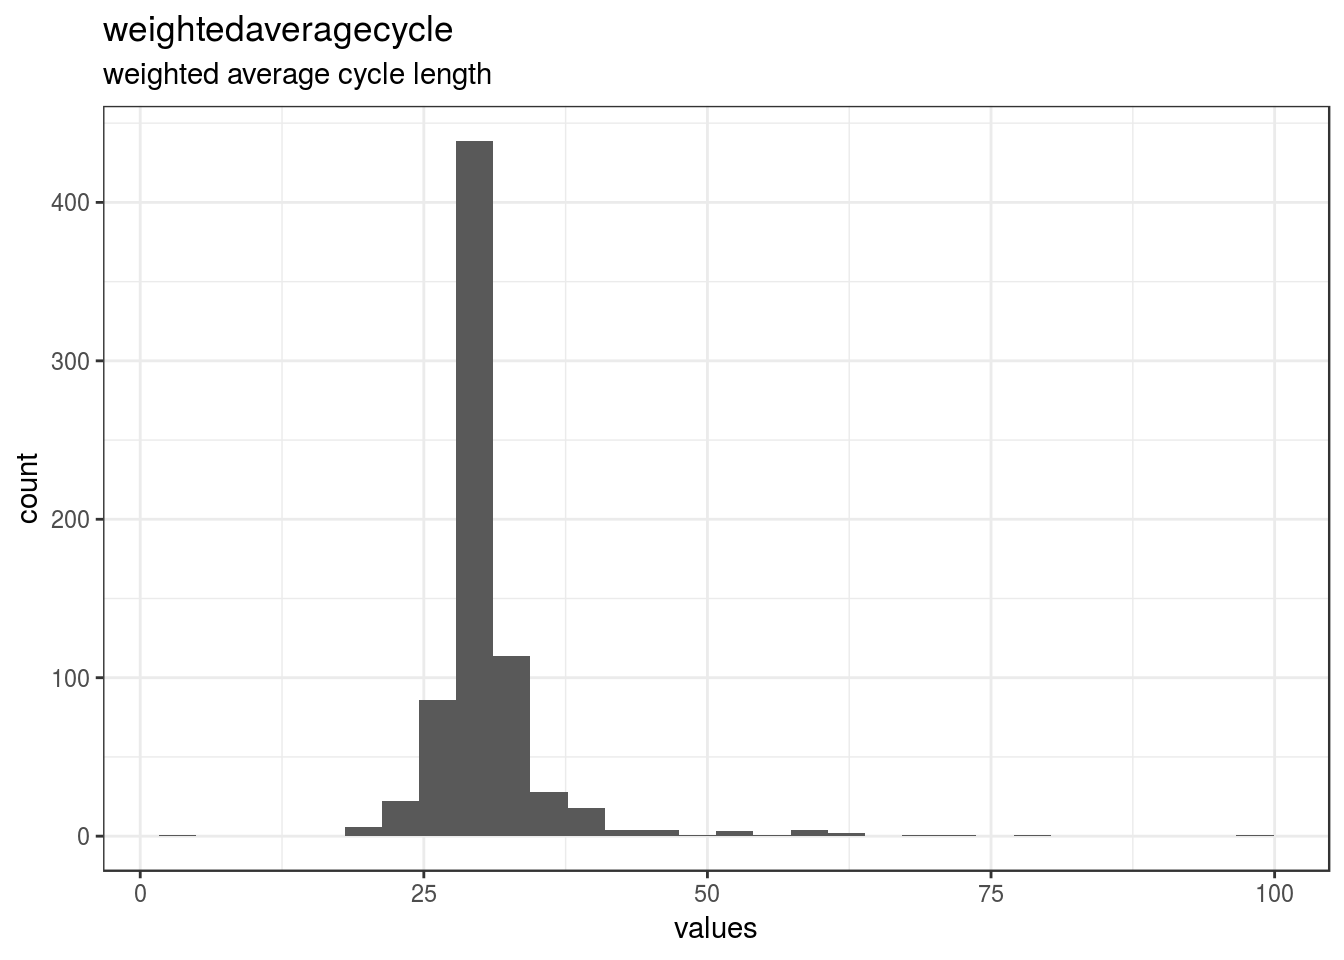
knitr::opts_chunk$set(fig.height = old_height)1269 missing values.
Summary statistics
attributes(item) <- item_attributes
df = data.frame(item, stringsAsFactors = FALSE)
names(df) = html_item_name
escaped_table(codebook_table(df))| name | label | data_type | missing | complete | n | mean | sd | p0 | p25 | p50 | p75 | p100 | hist | format.spss |
|---|---|---|---|---|---|---|---|---|---|---|---|---|---|---|
| weightedaveragecycle | weighted average cycle length | numeric | 1269 | 737 | 2006 | 30.62 | 6.02 | 4 | 28.3 | 29.9 | 31.1 | 99 | ▁▂▇▁▁▁▁▁ | F8.0 |
if (show_missing_values) {
plot_labelled(missing_values, item_name, wrap_at)
}if (!is.null(item_info)) {
# don't show choices again, if they're basically same thing as value labels
if (!is.null(choices) && !is.null(item_info$choices) &&
all(names(na.omit(choices)) == item_info$choices) &&
all(na.omit(choices) == names(item_info$choices))) {
item_info$choices <- NULL
}
item_info$label_parsed <-
item_info$choice_list <- item_info$study_id <- item_info$id <- NULL
pander::pander(item_info)
}if (!is.null(choices) && length(choices) && length(choices) < 30) {
pander::pander(as.list(choices))
}weightedaveragecyclerounded
rounded weighted average cycle length
Distribution
show_missing_values <- FALSE
if (has_labels(item)) {
missing_values <- item[is.na(haven::zap_missing(item))]
attributes(missing_values) <- attributes(item)
if (!is.null(attributes(item)$labels)) {
attributes(missing_values)$labels <- attributes(missing_values)$labels[is.na(attributes(missing_values)$labels)]
attributes(item)$labels <- attributes(item)$labels[!is.na(attributes(item)$labels)]
}
if (is.double(item)) {
show_missing_values <- length(unique(haven::na_tag(missing_values))) > 1
item <- haven::zap_missing(item)
}
if (length(item_attributes$labels) == 0 && is.numeric(item)) {
item <- haven::zap_labels(item)
}
}
item_nomiss <- item[!is.na(item)]
# unnest mc_multiple and so on
if (
is.character(item_nomiss) &&
stringr::str_detect(item_nomiss, stringr::fixed(", ")) &&
(exists("type", item_info) &&
stringr::str_detect(item_info$type, pattern = stringr::fixed("multiple")))
) {
item_nomiss <- unlist(stringr::str_split(item_nomiss, pattern = stringr::fixed(", ")))
}
attributes(item_nomiss) <- attributes(item)
old_height <- knitr::opts_chunk$get("fig.height")
non_missing_choices <- item_attributes[["labels"]]
many_labels <- length(non_missing_choices) > 7
go_vertical <- !is.numeric(item_nomiss) || many_labels
if ( go_vertical ) {
# numeric items are plotted horizontally (because that's what usually expected)
# categorical items are plotted vertically because we can use the screen real estate better this way
if (is.null(choices) ||
dplyr::n_distinct(item_nomiss) > length(non_missing_choices)) {
non_missing_choices <- unique(item_nomiss)
names(non_missing_choices) <- non_missing_choices
}
choice_multiplier <- old_height/6.5
new_height <- 2 + choice_multiplier * length(non_missing_choices)
new_height <- ifelse(new_height > 20, 20, new_height)
new_height <- ifelse(new_height < 1, 1, new_height)
knitr::opts_chunk$set(fig.height = new_height)
}
wrap_at <- knitr::opts_chunk$get("fig.width") * 10# todo: if there are free-text choices mingled in with the pre-defined ones, don't show
# todo: show rare items if they are pre-defined
# todo: bin rare responses into "other category"
if (!length(item_nomiss)) {
cat("No non-missing values to show.")
} else if (is.numeric(item_nomiss) || dplyr::n_distinct(item_nomiss) < 20) {
plot_labelled(item_nomiss, item_name, wrap_at, go_vertical)
} else {
cat(dplyr::n_distinct(item_nomiss), " unique, categorical values, so not shown.")
}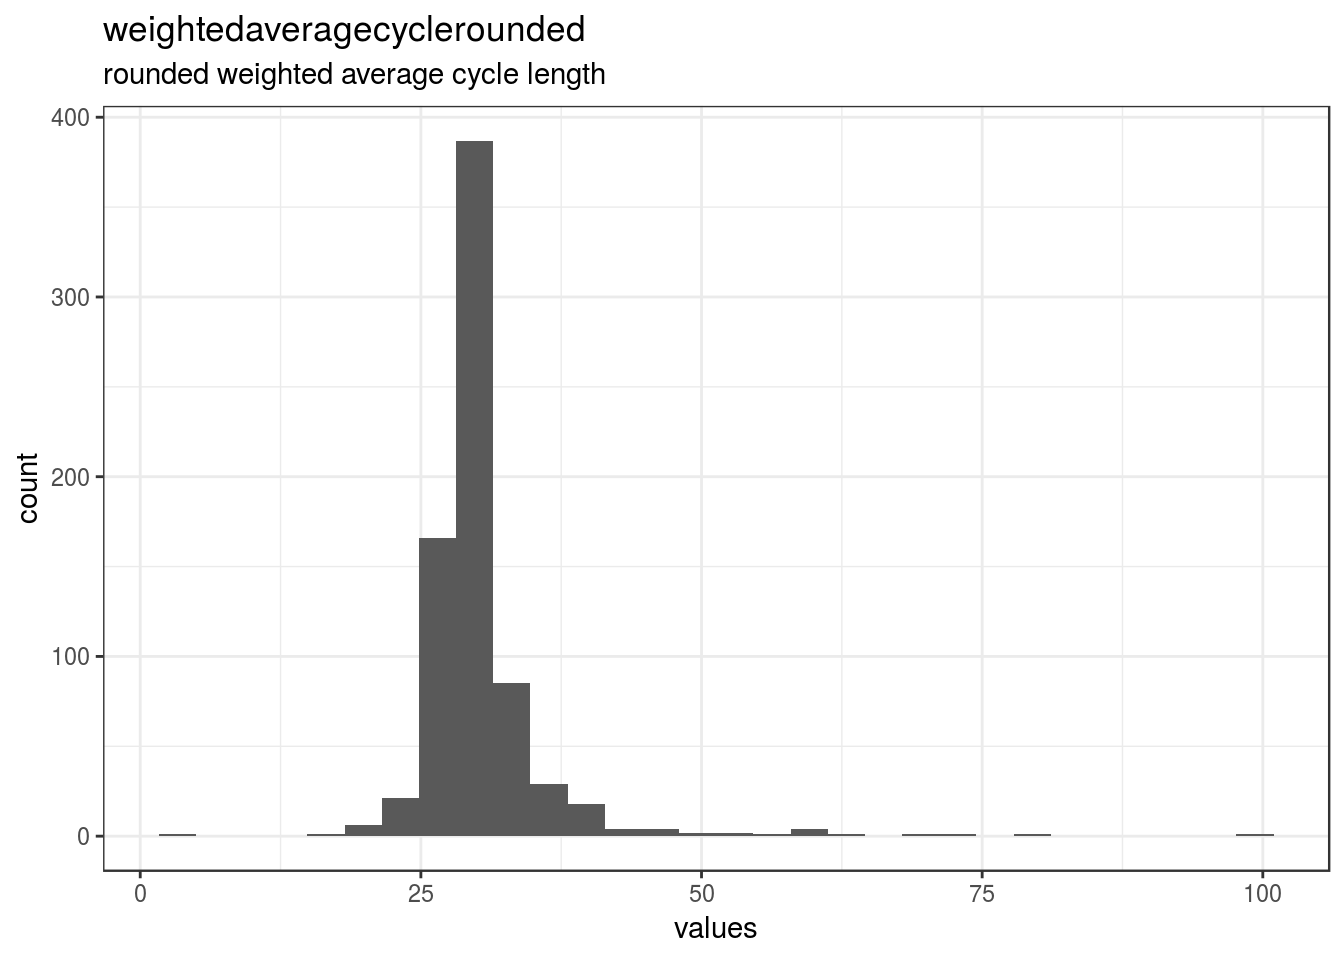
knitr::opts_chunk$set(fig.height = old_height)1270 missing values.
Summary statistics
attributes(item) <- item_attributes
df = data.frame(item, stringsAsFactors = FALSE)
names(df) = html_item_name
escaped_table(codebook_table(df))| name | label | data_type | missing | complete | n | mean | sd | p0 | p25 | p50 | p75 | p100 | hist | format.spss |
|---|---|---|---|---|---|---|---|---|---|---|---|---|---|---|
| weightedaveragecyclerounded | rounded weighted average cycle length | numeric | 1270 | 736 | 2006 | 30.63 | 5.97 | 3 | 28 | 30 | 31 | 99 | ▁▁▇▁▁▁▁▁ | F8.0 |
if (show_missing_values) {
plot_labelled(missing_values, item_name, wrap_at)
}if (!is.null(item_info)) {
# don't show choices again, if they're basically same thing as value labels
if (!is.null(choices) && !is.null(item_info$choices) &&
all(names(na.omit(choices)) == item_info$choices) &&
all(na.omit(choices) == names(item_info$choices))) {
item_info$choices <- NULL
}
item_info$label_parsed <-
item_info$choice_list <- item_info$study_id <- item_info$id <- NULL
pander::pander(item_info)
}if (!is.null(choices) && length(choices) && length(choices) < 30) {
pander::pander(as.list(choices))
}daysfromovulation
number of days from ovulation
Distribution
show_missing_values <- FALSE
if (has_labels(item)) {
missing_values <- item[is.na(haven::zap_missing(item))]
attributes(missing_values) <- attributes(item)
if (!is.null(attributes(item)$labels)) {
attributes(missing_values)$labels <- attributes(missing_values)$labels[is.na(attributes(missing_values)$labels)]
attributes(item)$labels <- attributes(item)$labels[!is.na(attributes(item)$labels)]
}
if (is.double(item)) {
show_missing_values <- length(unique(haven::na_tag(missing_values))) > 1
item <- haven::zap_missing(item)
}
if (length(item_attributes$labels) == 0 && is.numeric(item)) {
item <- haven::zap_labels(item)
}
}
item_nomiss <- item[!is.na(item)]
# unnest mc_multiple and so on
if (
is.character(item_nomiss) &&
stringr::str_detect(item_nomiss, stringr::fixed(", ")) &&
(exists("type", item_info) &&
stringr::str_detect(item_info$type, pattern = stringr::fixed("multiple")))
) {
item_nomiss <- unlist(stringr::str_split(item_nomiss, pattern = stringr::fixed(", ")))
}
attributes(item_nomiss) <- attributes(item)
old_height <- knitr::opts_chunk$get("fig.height")
non_missing_choices <- item_attributes[["labels"]]
many_labels <- length(non_missing_choices) > 7
go_vertical <- !is.numeric(item_nomiss) || many_labels
if ( go_vertical ) {
# numeric items are plotted horizontally (because that's what usually expected)
# categorical items are plotted vertically because we can use the screen real estate better this way
if (is.null(choices) ||
dplyr::n_distinct(item_nomiss) > length(non_missing_choices)) {
non_missing_choices <- unique(item_nomiss)
names(non_missing_choices) <- non_missing_choices
}
choice_multiplier <- old_height/6.5
new_height <- 2 + choice_multiplier * length(non_missing_choices)
new_height <- ifelse(new_height > 20, 20, new_height)
new_height <- ifelse(new_height < 1, 1, new_height)
knitr::opts_chunk$set(fig.height = new_height)
}
wrap_at <- knitr::opts_chunk$get("fig.width") * 10# todo: if there are free-text choices mingled in with the pre-defined ones, don't show
# todo: show rare items if they are pre-defined
# todo: bin rare responses into "other category"
if (!length(item_nomiss)) {
cat("No non-missing values to show.")
} else if (is.numeric(item_nomiss) || dplyr::n_distinct(item_nomiss) < 20) {
plot_labelled(item_nomiss, item_name, wrap_at, go_vertical)
} else {
cat(dplyr::n_distinct(item_nomiss), " unique, categorical values, so not shown.")
}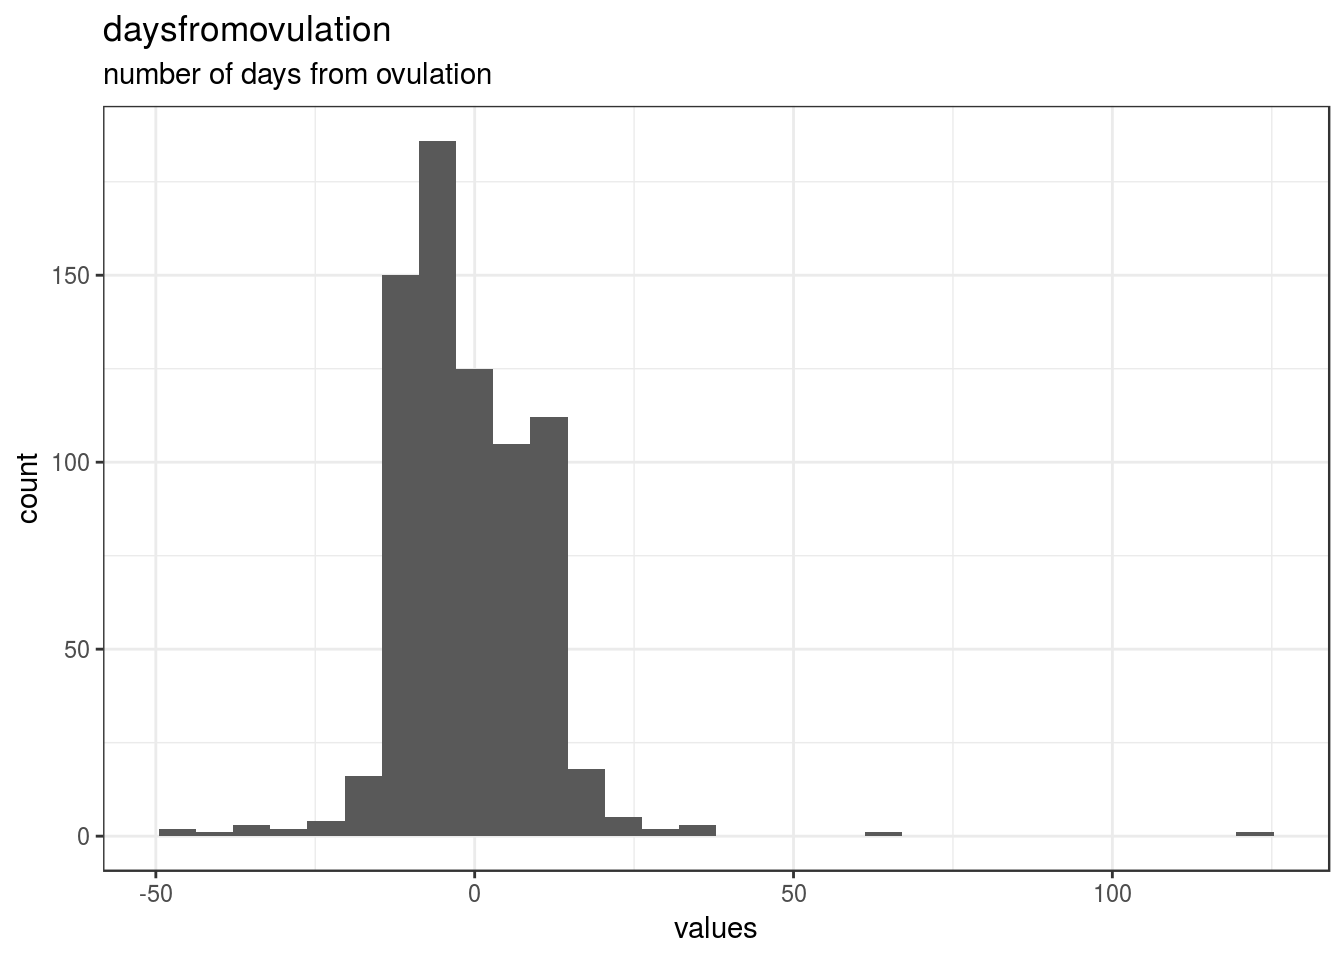
knitr::opts_chunk$set(fig.height = old_height)1270 missing values.
Summary statistics
attributes(item) <- item_attributes
df = data.frame(item, stringsAsFactors = FALSE)
names(df) = html_item_name
escaped_table(codebook_table(df))| name | label | data_type | missing | complete | n | mean | sd | p0 | p25 | p50 | p75 | p100 | hist | format.spss |
|---|---|---|---|---|---|---|---|---|---|---|---|---|---|---|
| daysfromovulation | number of days from ovulation | numeric | 1270 | 736 | 2006 | -1.04 | 11.17 | -49 | -8 | -2 | 6 | 120 | ▁▅▇▁▁▁▁▁ | F8.0 |
if (show_missing_values) {
plot_labelled(missing_values, item_name, wrap_at)
}if (!is.null(item_info)) {
# don't show choices again, if they're basically same thing as value labels
if (!is.null(choices) && !is.null(item_info$choices) &&
all(names(na.omit(choices)) == item_info$choices) &&
all(na.omit(choices) == names(item_info$choices))) {
item_info$choices <- NULL
}
item_info$label_parsed <-
item_info$choice_list <- item_info$study_id <- item_info$id <- NULL
pander::pander(item_info)
}if (!is.null(choices) && length(choices) && length(choices) < 30) {
pander::pander(as.list(choices))
}MC1nationality
What was the nationality of the man?
Distribution
show_missing_values <- FALSE
if (has_labels(item)) {
missing_values <- item[is.na(haven::zap_missing(item))]
attributes(missing_values) <- attributes(item)
if (!is.null(attributes(item)$labels)) {
attributes(missing_values)$labels <- attributes(missing_values)$labels[is.na(attributes(missing_values)$labels)]
attributes(item)$labels <- attributes(item)$labels[!is.na(attributes(item)$labels)]
}
if (is.double(item)) {
show_missing_values <- length(unique(haven::na_tag(missing_values))) > 1
item <- haven::zap_missing(item)
}
if (length(item_attributes$labels) == 0 && is.numeric(item)) {
item <- haven::zap_labels(item)
}
}
item_nomiss <- item[!is.na(item)]
# unnest mc_multiple and so on
if (
is.character(item_nomiss) &&
stringr::str_detect(item_nomiss, stringr::fixed(", ")) &&
(exists("type", item_info) &&
stringr::str_detect(item_info$type, pattern = stringr::fixed("multiple")))
) {
item_nomiss <- unlist(stringr::str_split(item_nomiss, pattern = stringr::fixed(", ")))
}
attributes(item_nomiss) <- attributes(item)
old_height <- knitr::opts_chunk$get("fig.height")
non_missing_choices <- item_attributes[["labels"]]
many_labels <- length(non_missing_choices) > 7
go_vertical <- !is.numeric(item_nomiss) || many_labels
if ( go_vertical ) {
# numeric items are plotted horizontally (because that's what usually expected)
# categorical items are plotted vertically because we can use the screen real estate better this way
if (is.null(choices) ||
dplyr::n_distinct(item_nomiss) > length(non_missing_choices)) {
non_missing_choices <- unique(item_nomiss)
names(non_missing_choices) <- non_missing_choices
}
choice_multiplier <- old_height/6.5
new_height <- 2 + choice_multiplier * length(non_missing_choices)
new_height <- ifelse(new_height > 20, 20, new_height)
new_height <- ifelse(new_height < 1, 1, new_height)
knitr::opts_chunk$set(fig.height = new_height)
}
wrap_at <- knitr::opts_chunk$get("fig.width") * 10# todo: if there are free-text choices mingled in with the pre-defined ones, don't show
# todo: show rare items if they are pre-defined
# todo: bin rare responses into "other category"
if (!length(item_nomiss)) {
cat("No non-missing values to show.")
} else if (is.numeric(item_nomiss) || dplyr::n_distinct(item_nomiss) < 20) {
plot_labelled(item_nomiss, item_name, wrap_at, go_vertical)
} else {
cat(dplyr::n_distinct(item_nomiss), " unique, categorical values, so not shown.")
}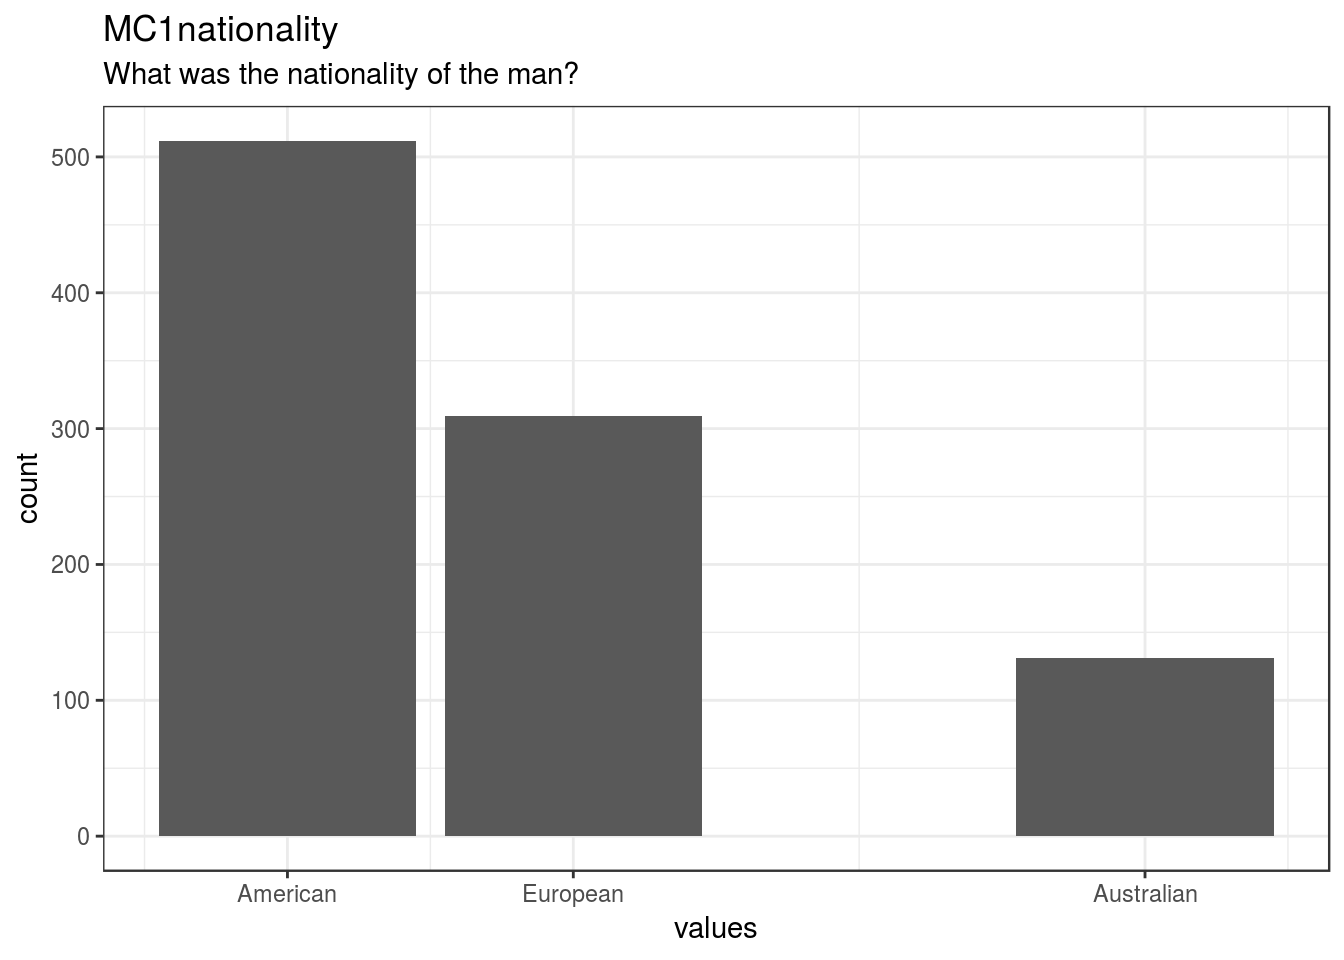
knitr::opts_chunk$set(fig.height = old_height)1054 missing values.
Summary statistics
attributes(item) <- item_attributes
df = data.frame(item, stringsAsFactors = FALSE)
names(df) = html_item_name
escaped_table(codebook_table(df))| name | label | data_type | value_labels | missing | complete | n | mean | sd | p0 | p25 | p50 | p75 | p100 | hist | format.spss |
|---|---|---|---|---|---|---|---|---|---|---|---|---|---|---|---|
| MC1nationality | What was the nationality of the man? | numeric | 1. American, 2. European, NA. [3] Asian, 4. Australian |
1054 | 952 | 2006 | 1.74 | 1.01 | 1 | 1 | 1 | 2 | 4 | ▇▁▅▁▁▁▁▂ | F8.0 |
if (show_missing_values) {
plot_labelled(missing_values, item_name, wrap_at)
}if (!is.null(item_info)) {
# don't show choices again, if they're basically same thing as value labels
if (!is.null(choices) && !is.null(item_info$choices) &&
all(names(na.omit(choices)) == item_info$choices) &&
all(na.omit(choices) == names(item_info$choices))) {
item_info$choices <- NULL
}
item_info$label_parsed <-
item_info$choice_list <- item_info$study_id <- item_info$id <- NULL
pander::pander(item_info)
}Value labels
if (!is.null(choices) && length(choices) && length(choices) < 30) {
pander::pander(as.list(choices))
}- American: 1
- European: 2
- [3] Asian: NA
- Australian: 4
MC2income
What was the man’s level of income?
Distribution
show_missing_values <- FALSE
if (has_labels(item)) {
missing_values <- item[is.na(haven::zap_missing(item))]
attributes(missing_values) <- attributes(item)
if (!is.null(attributes(item)$labels)) {
attributes(missing_values)$labels <- attributes(missing_values)$labels[is.na(attributes(missing_values)$labels)]
attributes(item)$labels <- attributes(item)$labels[!is.na(attributes(item)$labels)]
}
if (is.double(item)) {
show_missing_values <- length(unique(haven::na_tag(missing_values))) > 1
item <- haven::zap_missing(item)
}
if (length(item_attributes$labels) == 0 && is.numeric(item)) {
item <- haven::zap_labels(item)
}
}
item_nomiss <- item[!is.na(item)]
# unnest mc_multiple and so on
if (
is.character(item_nomiss) &&
stringr::str_detect(item_nomiss, stringr::fixed(", ")) &&
(exists("type", item_info) &&
stringr::str_detect(item_info$type, pattern = stringr::fixed("multiple")))
) {
item_nomiss <- unlist(stringr::str_split(item_nomiss, pattern = stringr::fixed(", ")))
}
attributes(item_nomiss) <- attributes(item)
old_height <- knitr::opts_chunk$get("fig.height")
non_missing_choices <- item_attributes[["labels"]]
many_labels <- length(non_missing_choices) > 7
go_vertical <- !is.numeric(item_nomiss) || many_labels
if ( go_vertical ) {
# numeric items are plotted horizontally (because that's what usually expected)
# categorical items are plotted vertically because we can use the screen real estate better this way
if (is.null(choices) ||
dplyr::n_distinct(item_nomiss) > length(non_missing_choices)) {
non_missing_choices <- unique(item_nomiss)
names(non_missing_choices) <- non_missing_choices
}
choice_multiplier <- old_height/6.5
new_height <- 2 + choice_multiplier * length(non_missing_choices)
new_height <- ifelse(new_height > 20, 20, new_height)
new_height <- ifelse(new_height < 1, 1, new_height)
knitr::opts_chunk$set(fig.height = new_height)
}
wrap_at <- knitr::opts_chunk$get("fig.width") * 10# todo: if there are free-text choices mingled in with the pre-defined ones, don't show
# todo: show rare items if they are pre-defined
# todo: bin rare responses into "other category"
if (!length(item_nomiss)) {
cat("No non-missing values to show.")
} else if (is.numeric(item_nomiss) || dplyr::n_distinct(item_nomiss) < 20) {
plot_labelled(item_nomiss, item_name, wrap_at, go_vertical)
} else {
cat(dplyr::n_distinct(item_nomiss), " unique, categorical values, so not shown.")
}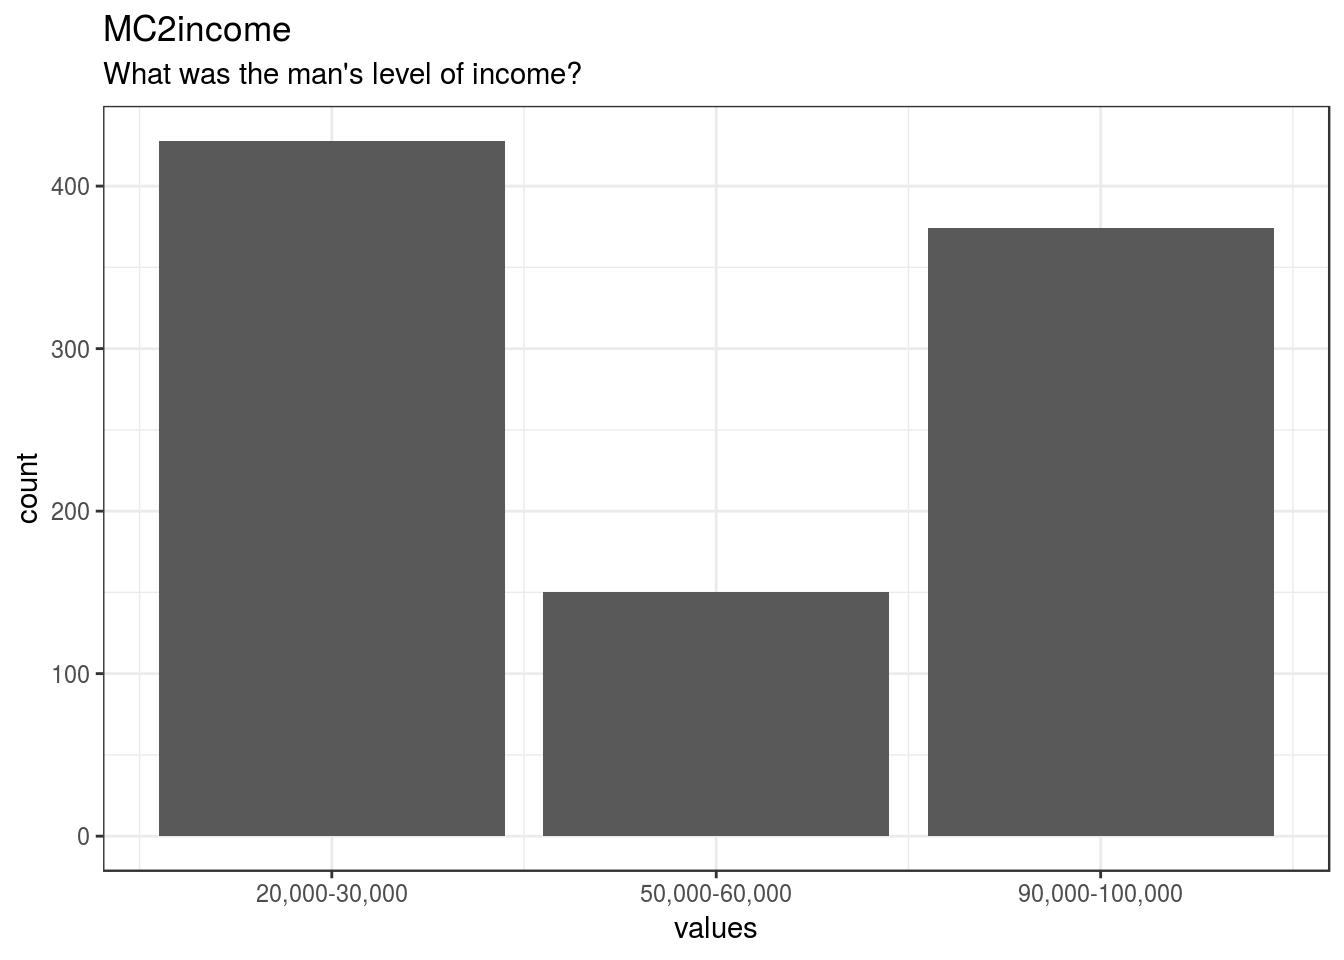
knitr::opts_chunk$set(fig.height = old_height)1054 missing values.
Summary statistics
attributes(item) <- item_attributes
df = data.frame(item, stringsAsFactors = FALSE)
names(df) = html_item_name
escaped_table(codebook_table(df))| name | label | data_type | value_labels | missing | complete | n | mean | sd | p0 | p25 | p50 | p75 | p100 | hist | format.spss |
|---|---|---|---|---|---|---|---|---|---|---|---|---|---|---|---|
| MC2income | What was the man’s level of income? | numeric | 1. 20,000-30,000, 2. 50,000-60,000, 3. 90,000-100,000 |
1054 | 952 | 2006 | 1.94 | 0.92 | 1 | 1 | 2 | 3 | 3 | ▇▁▁▃▁▁▁▇ | F8.0 |
if (show_missing_values) {
plot_labelled(missing_values, item_name, wrap_at)
}if (!is.null(item_info)) {
# don't show choices again, if they're basically same thing as value labels
if (!is.null(choices) && !is.null(item_info$choices) &&
all(names(na.omit(choices)) == item_info$choices) &&
all(na.omit(choices) == names(item_info$choices))) {
item_info$choices <- NULL
}
item_info$label_parsed <-
item_info$choice_list <- item_info$study_id <- item_info$id <- NULL
pander::pander(item_info)
}Value labels
if (!is.null(choices) && length(choices) && length(choices) < 30) {
pander::pander(as.list(choices))
}- 20,000-30,000: 1
- 50,000-60,000: 2
- 90,000-100,000: 3
MC3hobbies
What were the man’s hobbies?
Distribution
show_missing_values <- FALSE
if (has_labels(item)) {
missing_values <- item[is.na(haven::zap_missing(item))]
attributes(missing_values) <- attributes(item)
if (!is.null(attributes(item)$labels)) {
attributes(missing_values)$labels <- attributes(missing_values)$labels[is.na(attributes(missing_values)$labels)]
attributes(item)$labels <- attributes(item)$labels[!is.na(attributes(item)$labels)]
}
if (is.double(item)) {
show_missing_values <- length(unique(haven::na_tag(missing_values))) > 1
item <- haven::zap_missing(item)
}
if (length(item_attributes$labels) == 0 && is.numeric(item)) {
item <- haven::zap_labels(item)
}
}
item_nomiss <- item[!is.na(item)]
# unnest mc_multiple and so on
if (
is.character(item_nomiss) &&
stringr::str_detect(item_nomiss, stringr::fixed(", ")) &&
(exists("type", item_info) &&
stringr::str_detect(item_info$type, pattern = stringr::fixed("multiple")))
) {
item_nomiss <- unlist(stringr::str_split(item_nomiss, pattern = stringr::fixed(", ")))
}
attributes(item_nomiss) <- attributes(item)
old_height <- knitr::opts_chunk$get("fig.height")
non_missing_choices <- item_attributes[["labels"]]
many_labels <- length(non_missing_choices) > 7
go_vertical <- !is.numeric(item_nomiss) || many_labels
if ( go_vertical ) {
# numeric items are plotted horizontally (because that's what usually expected)
# categorical items are plotted vertically because we can use the screen real estate better this way
if (is.null(choices) ||
dplyr::n_distinct(item_nomiss) > length(non_missing_choices)) {
non_missing_choices <- unique(item_nomiss)
names(non_missing_choices) <- non_missing_choices
}
choice_multiplier <- old_height/6.5
new_height <- 2 + choice_multiplier * length(non_missing_choices)
new_height <- ifelse(new_height > 20, 20, new_height)
new_height <- ifelse(new_height < 1, 1, new_height)
knitr::opts_chunk$set(fig.height = new_height)
}
wrap_at <- knitr::opts_chunk$get("fig.width") * 10# todo: if there are free-text choices mingled in with the pre-defined ones, don't show
# todo: show rare items if they are pre-defined
# todo: bin rare responses into "other category"
if (!length(item_nomiss)) {
cat("No non-missing values to show.")
} else if (is.numeric(item_nomiss) || dplyr::n_distinct(item_nomiss) < 20) {
plot_labelled(item_nomiss, item_name, wrap_at, go_vertical)
} else {
cat(dplyr::n_distinct(item_nomiss), " unique, categorical values, so not shown.")
}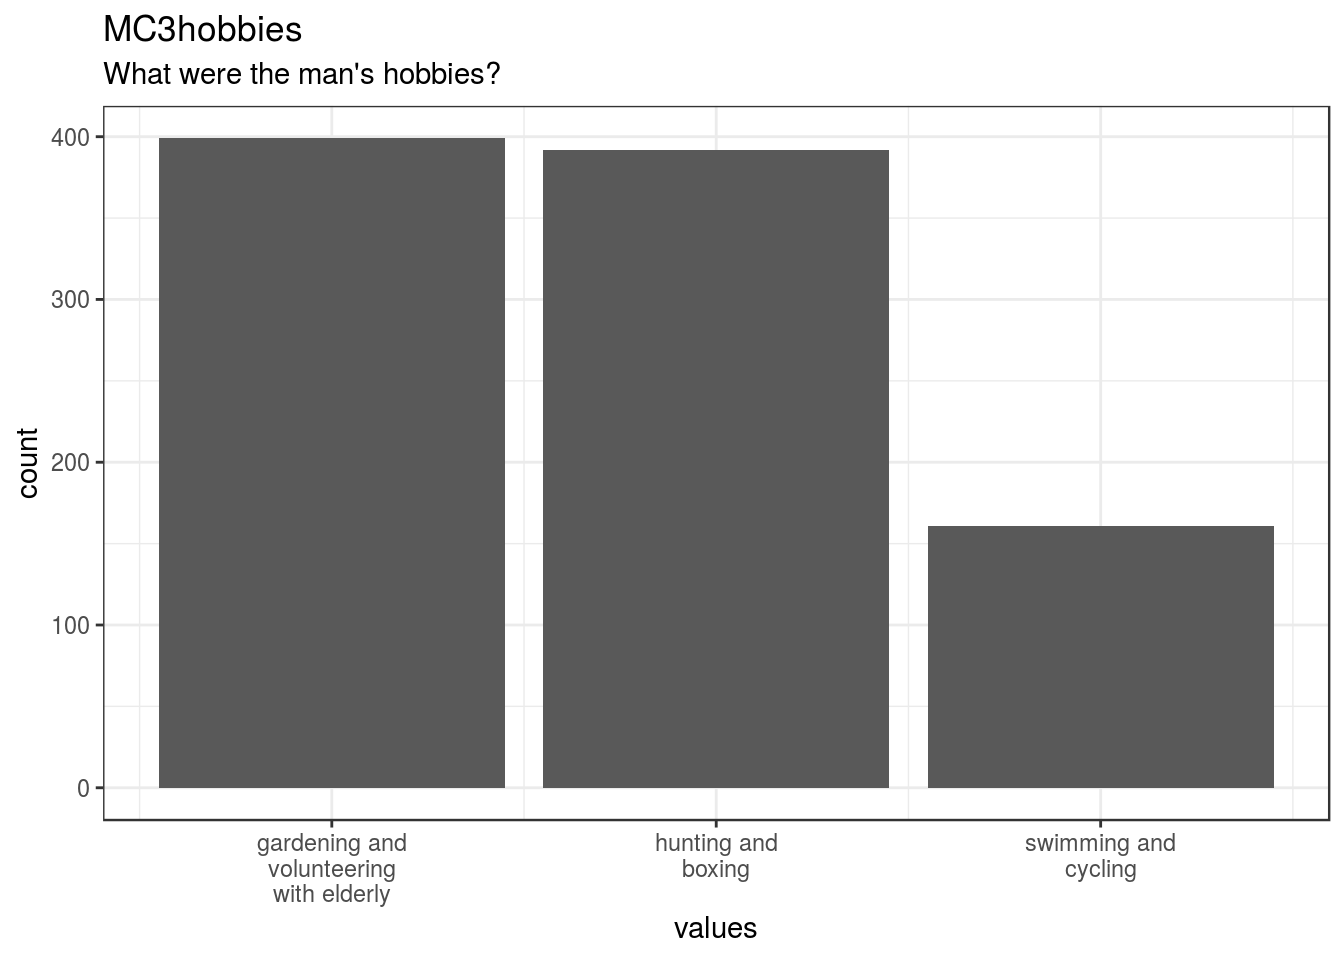
knitr::opts_chunk$set(fig.height = old_height)1054 missing values.
Summary statistics
attributes(item) <- item_attributes
df = data.frame(item, stringsAsFactors = FALSE)
names(df) = html_item_name
escaped_table(codebook_table(df))| name | label | data_type | value_labels | missing | complete | n | mean | sd | p0 | p25 | p50 | p75 | p100 | hist | format.spss |
|---|---|---|---|---|---|---|---|---|---|---|---|---|---|---|---|
| MC3hobbies | What were the man’s hobbies? | numeric | 1. gardening and volunteering with elderly, 2. hunting and boxing, 3. swimming and cycling |
1054 | 952 | 2006 | 1.75 | 0.73 | 1 | 1 | 2 | 2 | 3 | ▇▁▁▇▁▁▁▃ | F8.0 |
if (show_missing_values) {
plot_labelled(missing_values, item_name, wrap_at)
}if (!is.null(item_info)) {
# don't show choices again, if they're basically same thing as value labels
if (!is.null(choices) && !is.null(item_info$choices) &&
all(names(na.omit(choices)) == item_info$choices) &&
all(na.omit(choices) == names(item_info$choices))) {
item_info$choices <- NULL
}
item_info$label_parsed <-
item_info$choice_list <- item_info$study_id <- item_info$id <- NULL
pander::pander(item_info)
}Value labels
if (!is.null(choices) && length(choices) && length(choices) < 30) {
pander::pander(as.list(choices))
}- gardening and volunteering with elderly: 1
- hunting and boxing: 2
- swimming and cycling: 3
MC4age
What was the man’s age?
Distribution
show_missing_values <- FALSE
if (has_labels(item)) {
missing_values <- item[is.na(haven::zap_missing(item))]
attributes(missing_values) <- attributes(item)
if (!is.null(attributes(item)$labels)) {
attributes(missing_values)$labels <- attributes(missing_values)$labels[is.na(attributes(missing_values)$labels)]
attributes(item)$labels <- attributes(item)$labels[!is.na(attributes(item)$labels)]
}
if (is.double(item)) {
show_missing_values <- length(unique(haven::na_tag(missing_values))) > 1
item <- haven::zap_missing(item)
}
if (length(item_attributes$labels) == 0 && is.numeric(item)) {
item <- haven::zap_labels(item)
}
}
item_nomiss <- item[!is.na(item)]
# unnest mc_multiple and so on
if (
is.character(item_nomiss) &&
stringr::str_detect(item_nomiss, stringr::fixed(", ")) &&
(exists("type", item_info) &&
stringr::str_detect(item_info$type, pattern = stringr::fixed("multiple")))
) {
item_nomiss <- unlist(stringr::str_split(item_nomiss, pattern = stringr::fixed(", ")))
}
attributes(item_nomiss) <- attributes(item)
old_height <- knitr::opts_chunk$get("fig.height")
non_missing_choices <- item_attributes[["labels"]]
many_labels <- length(non_missing_choices) > 7
go_vertical <- !is.numeric(item_nomiss) || many_labels
if ( go_vertical ) {
# numeric items are plotted horizontally (because that's what usually expected)
# categorical items are plotted vertically because we can use the screen real estate better this way
if (is.null(choices) ||
dplyr::n_distinct(item_nomiss) > length(non_missing_choices)) {
non_missing_choices <- unique(item_nomiss)
names(non_missing_choices) <- non_missing_choices
}
choice_multiplier <- old_height/6.5
new_height <- 2 + choice_multiplier * length(non_missing_choices)
new_height <- ifelse(new_height > 20, 20, new_height)
new_height <- ifelse(new_height < 1, 1, new_height)
knitr::opts_chunk$set(fig.height = new_height)
}
wrap_at <- knitr::opts_chunk$get("fig.width") * 10# todo: if there are free-text choices mingled in with the pre-defined ones, don't show
# todo: show rare items if they are pre-defined
# todo: bin rare responses into "other category"
if (!length(item_nomiss)) {
cat("No non-missing values to show.")
} else if (is.numeric(item_nomiss) || dplyr::n_distinct(item_nomiss) < 20) {
plot_labelled(item_nomiss, item_name, wrap_at, go_vertical)
} else {
cat(dplyr::n_distinct(item_nomiss), " unique, categorical values, so not shown.")
}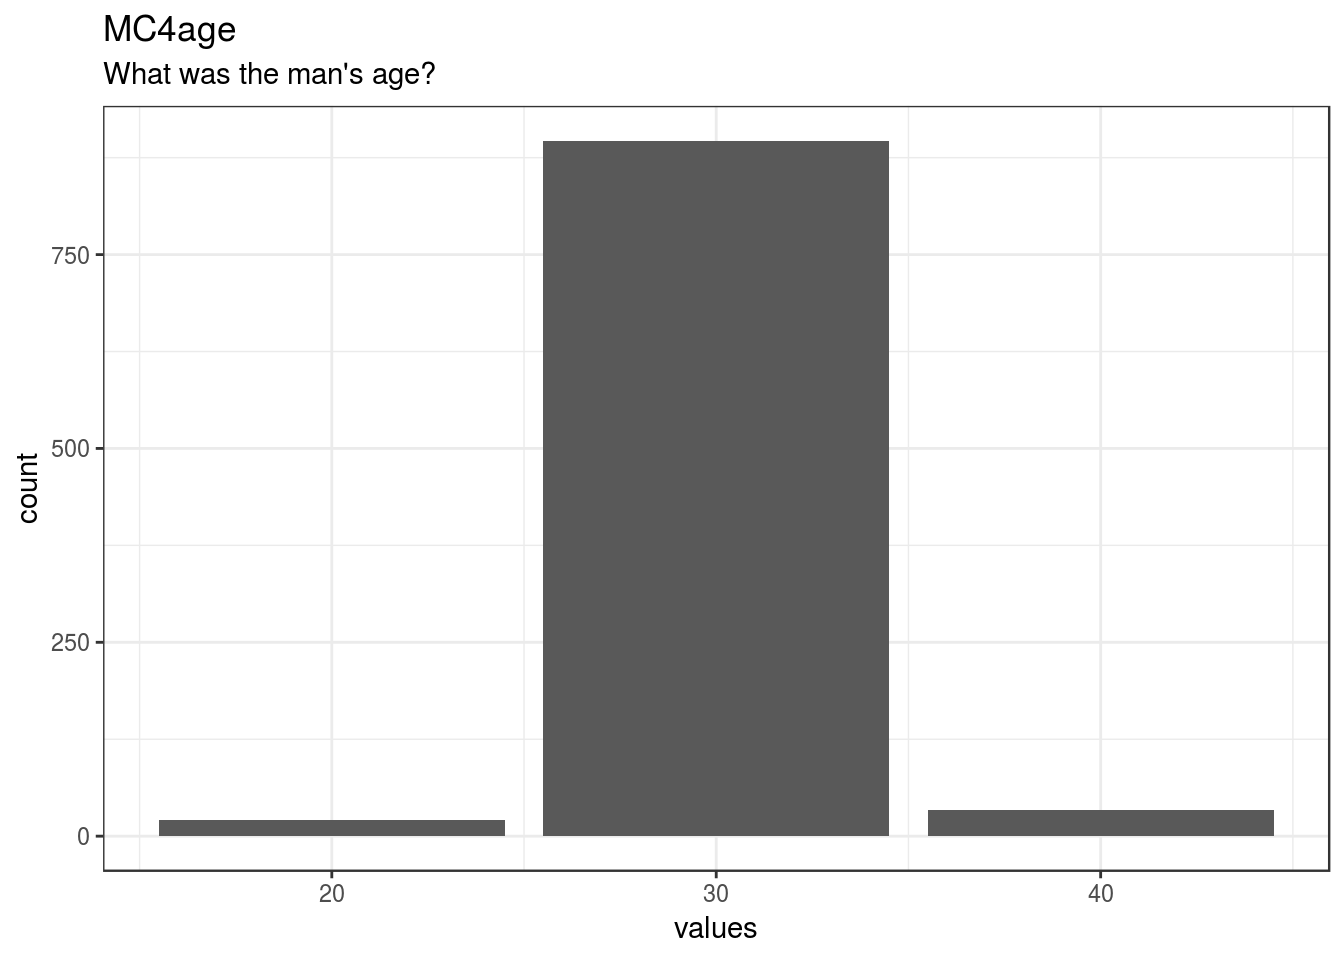
knitr::opts_chunk$set(fig.height = old_height)1054 missing values.
Summary statistics
attributes(item) <- item_attributes
df = data.frame(item, stringsAsFactors = FALSE)
names(df) = html_item_name
escaped_table(codebook_table(df))| name | label | data_type | value_labels | missing | complete | n | mean | sd | p0 | p25 | p50 | p75 | p100 | hist | format.spss |
|---|---|---|---|---|---|---|---|---|---|---|---|---|---|---|---|
| MC4age | What was the man’s age? | numeric | 1. 20, 2. 30, 3. 40 |
1054 | 952 | 2006 | 2.01 | 0.24 | 1 | 2 | 2 | 2 | 3 | ▁▁▁▇▁▁▁▁ | F8.0 |
if (show_missing_values) {
plot_labelled(missing_values, item_name, wrap_at)
}if (!is.null(item_info)) {
# don't show choices again, if they're basically same thing as value labels
if (!is.null(choices) && !is.null(item_info$choices) &&
all(names(na.omit(choices)) == item_info$choices) &&
all(na.omit(choices) == names(item_info$choices))) {
item_info$choices <- NULL
}
item_info$label_parsed <-
item_info$choice_list <- item_info$study_id <- item_info$id <- NULL
pander::pander(item_info)
}Value labels
if (!is.null(choices) && length(choices) && length(choices) < 30) {
pander::pander(as.list(choices))
}- 20: 1
- 30: 2
- 40: 3
MC5profession
In what professional area did the man work?
Distribution
show_missing_values <- FALSE
if (has_labels(item)) {
missing_values <- item[is.na(haven::zap_missing(item))]
attributes(missing_values) <- attributes(item)
if (!is.null(attributes(item)$labels)) {
attributes(missing_values)$labels <- attributes(missing_values)$labels[is.na(attributes(missing_values)$labels)]
attributes(item)$labels <- attributes(item)$labels[!is.na(attributes(item)$labels)]
}
if (is.double(item)) {
show_missing_values <- length(unique(haven::na_tag(missing_values))) > 1
item <- haven::zap_missing(item)
}
if (length(item_attributes$labels) == 0 && is.numeric(item)) {
item <- haven::zap_labels(item)
}
}
item_nomiss <- item[!is.na(item)]
# unnest mc_multiple and so on
if (
is.character(item_nomiss) &&
stringr::str_detect(item_nomiss, stringr::fixed(", ")) &&
(exists("type", item_info) &&
stringr::str_detect(item_info$type, pattern = stringr::fixed("multiple")))
) {
item_nomiss <- unlist(stringr::str_split(item_nomiss, pattern = stringr::fixed(", ")))
}
attributes(item_nomiss) <- attributes(item)
old_height <- knitr::opts_chunk$get("fig.height")
non_missing_choices <- item_attributes[["labels"]]
many_labels <- length(non_missing_choices) > 7
go_vertical <- !is.numeric(item_nomiss) || many_labels
if ( go_vertical ) {
# numeric items are plotted horizontally (because that's what usually expected)
# categorical items are plotted vertically because we can use the screen real estate better this way
if (is.null(choices) ||
dplyr::n_distinct(item_nomiss) > length(non_missing_choices)) {
non_missing_choices <- unique(item_nomiss)
names(non_missing_choices) <- non_missing_choices
}
choice_multiplier <- old_height/6.5
new_height <- 2 + choice_multiplier * length(non_missing_choices)
new_height <- ifelse(new_height > 20, 20, new_height)
new_height <- ifelse(new_height < 1, 1, new_height)
knitr::opts_chunk$set(fig.height = new_height)
}
wrap_at <- knitr::opts_chunk$get("fig.width") * 10# todo: if there are free-text choices mingled in with the pre-defined ones, don't show
# todo: show rare items if they are pre-defined
# todo: bin rare responses into "other category"
if (!length(item_nomiss)) {
cat("No non-missing values to show.")
} else if (is.numeric(item_nomiss) || dplyr::n_distinct(item_nomiss) < 20) {
plot_labelled(item_nomiss, item_name, wrap_at, go_vertical)
} else {
cat(dplyr::n_distinct(item_nomiss), " unique, categorical values, so not shown.")
}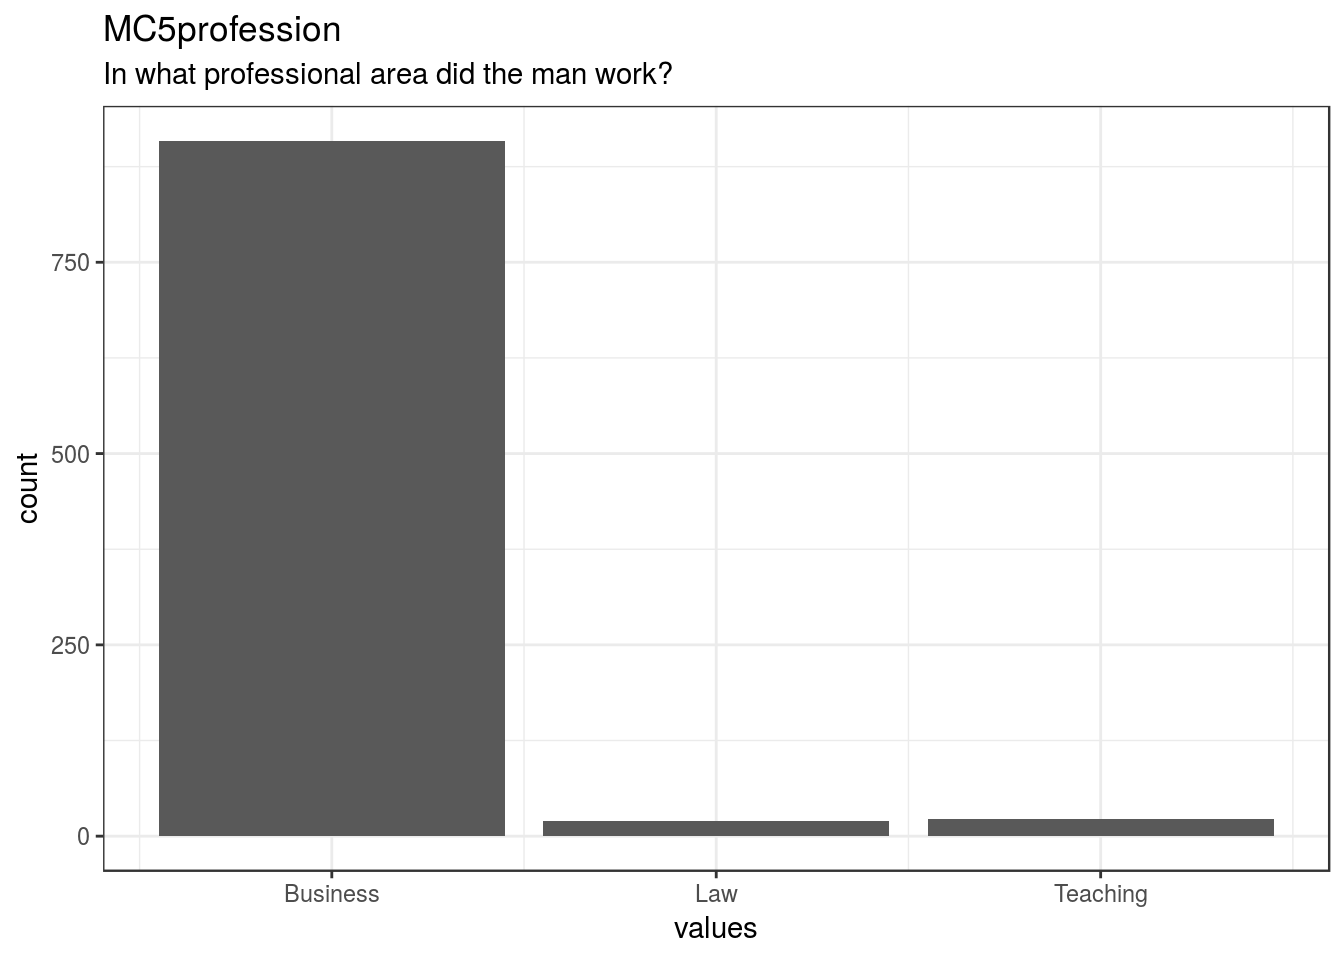
knitr::opts_chunk$set(fig.height = old_height)1055 missing values.
Summary statistics
attributes(item) <- item_attributes
df = data.frame(item, stringsAsFactors = FALSE)
names(df) = html_item_name
escaped_table(codebook_table(df))| name | label | data_type | value_labels | missing | complete | n | mean | sd | p0 | p25 | p50 | p75 | p100 | hist | format.spss |
|---|---|---|---|---|---|---|---|---|---|---|---|---|---|---|---|
| MC5profession | In what professional area did the man work? | numeric | 1. Business, 2. Law, 3. Teaching |
1055 | 951 | 2006 | 1.07 | 0.33 | 1 | 1 | 1 | 1 | 3 | ▇▁▁▁▁▁▁▁ | F8.0 |
if (show_missing_values) {
plot_labelled(missing_values, item_name, wrap_at)
}if (!is.null(item_info)) {
# don't show choices again, if they're basically same thing as value labels
if (!is.null(choices) && !is.null(item_info$choices) &&
all(names(na.omit(choices)) == item_info$choices) &&
all(na.omit(choices) == names(item_info$choices))) {
item_info$choices <- NULL
}
item_info$label_parsed <-
item_info$choice_list <- item_info$study_id <- item_info$id <- NULL
pander::pander(item_info)
}Value labels
if (!is.null(choices) && length(choices) && length(choices) < 30) {
pander::pander(as.list(choices))
}- Business: 1
- Law: 2
- Teaching: 3
MC1nationalitycorrect
0=wrong, 1=correct
Distribution
show_missing_values <- FALSE
if (has_labels(item)) {
missing_values <- item[is.na(haven::zap_missing(item))]
attributes(missing_values) <- attributes(item)
if (!is.null(attributes(item)$labels)) {
attributes(missing_values)$labels <- attributes(missing_values)$labels[is.na(attributes(missing_values)$labels)]
attributes(item)$labels <- attributes(item)$labels[!is.na(attributes(item)$labels)]
}
if (is.double(item)) {
show_missing_values <- length(unique(haven::na_tag(missing_values))) > 1
item <- haven::zap_missing(item)
}
if (length(item_attributes$labels) == 0 && is.numeric(item)) {
item <- haven::zap_labels(item)
}
}
item_nomiss <- item[!is.na(item)]
# unnest mc_multiple and so on
if (
is.character(item_nomiss) &&
stringr::str_detect(item_nomiss, stringr::fixed(", ")) &&
(exists("type", item_info) &&
stringr::str_detect(item_info$type, pattern = stringr::fixed("multiple")))
) {
item_nomiss <- unlist(stringr::str_split(item_nomiss, pattern = stringr::fixed(", ")))
}
attributes(item_nomiss) <- attributes(item)
old_height <- knitr::opts_chunk$get("fig.height")
non_missing_choices <- item_attributes[["labels"]]
many_labels <- length(non_missing_choices) > 7
go_vertical <- !is.numeric(item_nomiss) || many_labels
if ( go_vertical ) {
# numeric items are plotted horizontally (because that's what usually expected)
# categorical items are plotted vertically because we can use the screen real estate better this way
if (is.null(choices) ||
dplyr::n_distinct(item_nomiss) > length(non_missing_choices)) {
non_missing_choices <- unique(item_nomiss)
names(non_missing_choices) <- non_missing_choices
}
choice_multiplier <- old_height/6.5
new_height <- 2 + choice_multiplier * length(non_missing_choices)
new_height <- ifelse(new_height > 20, 20, new_height)
new_height <- ifelse(new_height < 1, 1, new_height)
knitr::opts_chunk$set(fig.height = new_height)
}
wrap_at <- knitr::opts_chunk$get("fig.width") * 10# todo: if there are free-text choices mingled in with the pre-defined ones, don't show
# todo: show rare items if they are pre-defined
# todo: bin rare responses into "other category"
if (!length(item_nomiss)) {
cat("No non-missing values to show.")
} else if (is.numeric(item_nomiss) || dplyr::n_distinct(item_nomiss) < 20) {
plot_labelled(item_nomiss, item_name, wrap_at, go_vertical)
} else {
cat(dplyr::n_distinct(item_nomiss), " unique, categorical values, so not shown.")
}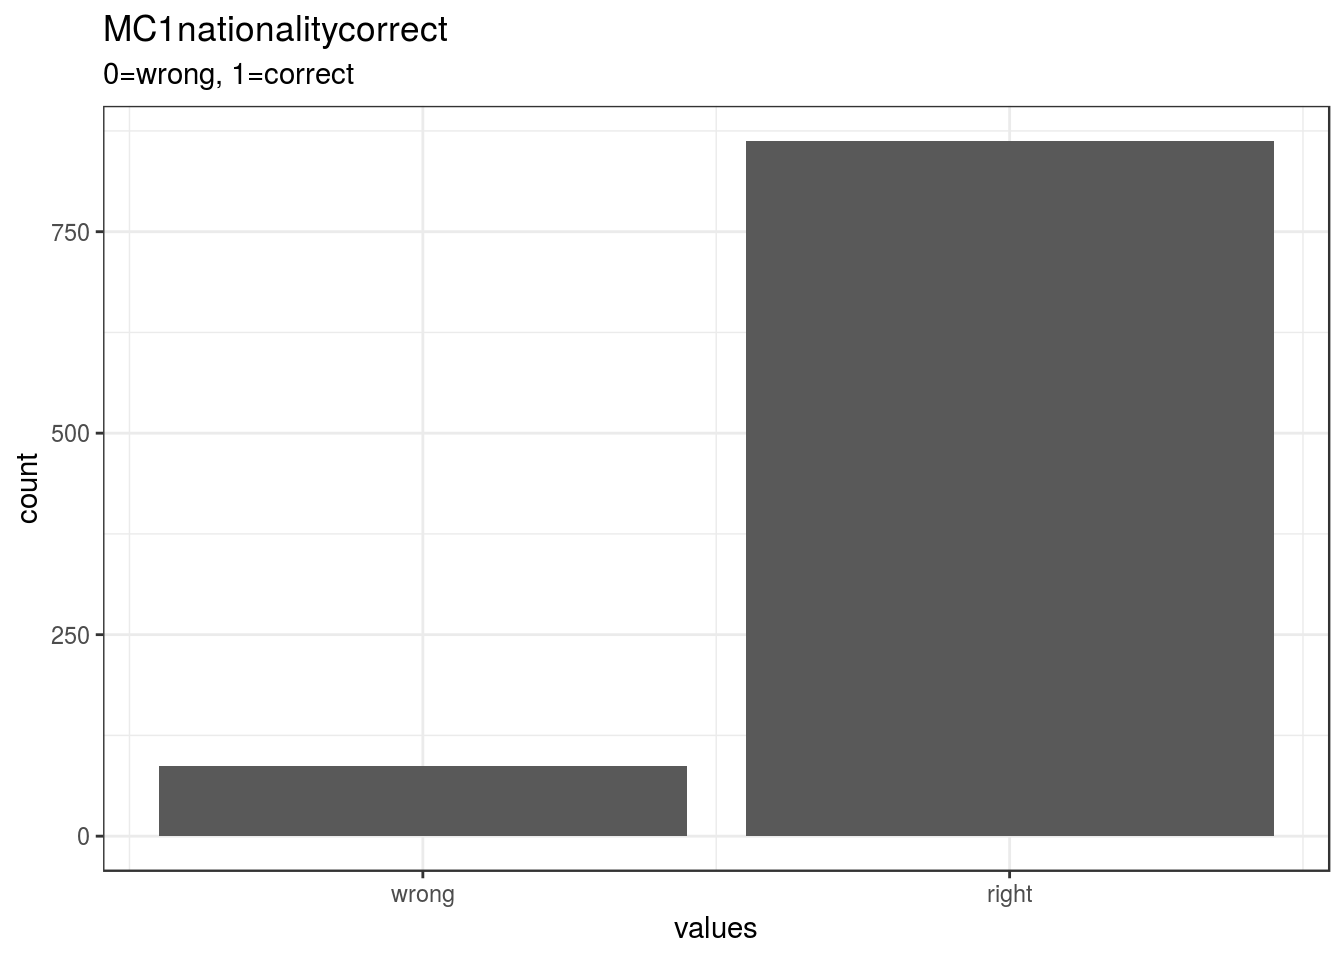
knitr::opts_chunk$set(fig.height = old_height)1056 missing values.
Summary statistics
attributes(item) <- item_attributes
df = data.frame(item, stringsAsFactors = FALSE)
names(df) = html_item_name
escaped_table(codebook_table(df))| name | label | data_type | ordered | value_labels | missing | complete | n | n_unique | top_counts | format.spss | display_width |
|---|---|---|---|---|---|---|---|---|---|---|---|
| MC1nationalitycorrect | 0=wrong, 1=correct | labelled | FALSE | 0. wrong, 1. right |
1056 | 950 | 2006 | 2 | NA: 1056, 1: 863, 0: 87 | F8.2 | 23 |
if (show_missing_values) {
plot_labelled(missing_values, item_name, wrap_at)
}if (!is.null(item_info)) {
# don't show choices again, if they're basically same thing as value labels
if (!is.null(choices) && !is.null(item_info$choices) &&
all(names(na.omit(choices)) == item_info$choices) &&
all(na.omit(choices) == names(item_info$choices))) {
item_info$choices <- NULL
}
item_info$label_parsed <-
item_info$choice_list <- item_info$study_id <- item_info$id <- NULL
pander::pander(item_info)
}Value labels
if (!is.null(choices) && length(choices) && length(choices) < 30) {
pander::pander(as.list(choices))
}- wrong: 0
- right: 1
MC2incomecorrect
0=wrong, 1=correct
Distribution
show_missing_values <- FALSE
if (has_labels(item)) {
missing_values <- item[is.na(haven::zap_missing(item))]
attributes(missing_values) <- attributes(item)
if (!is.null(attributes(item)$labels)) {
attributes(missing_values)$labels <- attributes(missing_values)$labels[is.na(attributes(missing_values)$labels)]
attributes(item)$labels <- attributes(item)$labels[!is.na(attributes(item)$labels)]
}
if (is.double(item)) {
show_missing_values <- length(unique(haven::na_tag(missing_values))) > 1
item <- haven::zap_missing(item)
}
if (length(item_attributes$labels) == 0 && is.numeric(item)) {
item <- haven::zap_labels(item)
}
}
item_nomiss <- item[!is.na(item)]
# unnest mc_multiple and so on
if (
is.character(item_nomiss) &&
stringr::str_detect(item_nomiss, stringr::fixed(", ")) &&
(exists("type", item_info) &&
stringr::str_detect(item_info$type, pattern = stringr::fixed("multiple")))
) {
item_nomiss <- unlist(stringr::str_split(item_nomiss, pattern = stringr::fixed(", ")))
}
attributes(item_nomiss) <- attributes(item)
old_height <- knitr::opts_chunk$get("fig.height")
non_missing_choices <- item_attributes[["labels"]]
many_labels <- length(non_missing_choices) > 7
go_vertical <- !is.numeric(item_nomiss) || many_labels
if ( go_vertical ) {
# numeric items are plotted horizontally (because that's what usually expected)
# categorical items are plotted vertically because we can use the screen real estate better this way
if (is.null(choices) ||
dplyr::n_distinct(item_nomiss) > length(non_missing_choices)) {
non_missing_choices <- unique(item_nomiss)
names(non_missing_choices) <- non_missing_choices
}
choice_multiplier <- old_height/6.5
new_height <- 2 + choice_multiplier * length(non_missing_choices)
new_height <- ifelse(new_height > 20, 20, new_height)
new_height <- ifelse(new_height < 1, 1, new_height)
knitr::opts_chunk$set(fig.height = new_height)
}
wrap_at <- knitr::opts_chunk$get("fig.width") * 10# todo: if there are free-text choices mingled in with the pre-defined ones, don't show
# todo: show rare items if they are pre-defined
# todo: bin rare responses into "other category"
if (!length(item_nomiss)) {
cat("No non-missing values to show.")
} else if (is.numeric(item_nomiss) || dplyr::n_distinct(item_nomiss) < 20) {
plot_labelled(item_nomiss, item_name, wrap_at, go_vertical)
} else {
cat(dplyr::n_distinct(item_nomiss), " unique, categorical values, so not shown.")
}
knitr::opts_chunk$set(fig.height = old_height)1055 missing values.
Summary statistics
attributes(item) <- item_attributes
df = data.frame(item, stringsAsFactors = FALSE)
names(df) = html_item_name
escaped_table(codebook_table(df))| name | label | data_type | ordered | value_labels | missing | complete | n | n_unique | top_counts | format.spss | display_width |
|---|---|---|---|---|---|---|---|---|---|---|---|
| MC2incomecorrect | 0=wrong, 1=correct | labelled | FALSE | 0. wrong, 1. right |
1055 | 951 | 2006 | 2 | NA: 1055, 1: 769, 0: 182 | F8.2 | 18 |
if (show_missing_values) {
plot_labelled(missing_values, item_name, wrap_at)
}if (!is.null(item_info)) {
# don't show choices again, if they're basically same thing as value labels
if (!is.null(choices) && !is.null(item_info$choices) &&
all(names(na.omit(choices)) == item_info$choices) &&
all(na.omit(choices) == names(item_info$choices))) {
item_info$choices <- NULL
}
item_info$label_parsed <-
item_info$choice_list <- item_info$study_id <- item_info$id <- NULL
pander::pander(item_info)
}Value labels
if (!is.null(choices) && length(choices) && length(choices) < 30) {
pander::pander(as.list(choices))
}- wrong: 0
- right: 1
MC3hobbiescorrect
0=wrong, 1=correct
Distribution
show_missing_values <- FALSE
if (has_labels(item)) {
missing_values <- item[is.na(haven::zap_missing(item))]
attributes(missing_values) <- attributes(item)
if (!is.null(attributes(item)$labels)) {
attributes(missing_values)$labels <- attributes(missing_values)$labels[is.na(attributes(missing_values)$labels)]
attributes(item)$labels <- attributes(item)$labels[!is.na(attributes(item)$labels)]
}
if (is.double(item)) {
show_missing_values <- length(unique(haven::na_tag(missing_values))) > 1
item <- haven::zap_missing(item)
}
if (length(item_attributes$labels) == 0 && is.numeric(item)) {
item <- haven::zap_labels(item)
}
}
item_nomiss <- item[!is.na(item)]
# unnest mc_multiple and so on
if (
is.character(item_nomiss) &&
stringr::str_detect(item_nomiss, stringr::fixed(", ")) &&
(exists("type", item_info) &&
stringr::str_detect(item_info$type, pattern = stringr::fixed("multiple")))
) {
item_nomiss <- unlist(stringr::str_split(item_nomiss, pattern = stringr::fixed(", ")))
}
attributes(item_nomiss) <- attributes(item)
old_height <- knitr::opts_chunk$get("fig.height")
non_missing_choices <- item_attributes[["labels"]]
many_labels <- length(non_missing_choices) > 7
go_vertical <- !is.numeric(item_nomiss) || many_labels
if ( go_vertical ) {
# numeric items are plotted horizontally (because that's what usually expected)
# categorical items are plotted vertically because we can use the screen real estate better this way
if (is.null(choices) ||
dplyr::n_distinct(item_nomiss) > length(non_missing_choices)) {
non_missing_choices <- unique(item_nomiss)
names(non_missing_choices) <- non_missing_choices
}
choice_multiplier <- old_height/6.5
new_height <- 2 + choice_multiplier * length(non_missing_choices)
new_height <- ifelse(new_height > 20, 20, new_height)
new_height <- ifelse(new_height < 1, 1, new_height)
knitr::opts_chunk$set(fig.height = new_height)
}
wrap_at <- knitr::opts_chunk$get("fig.width") * 10# todo: if there are free-text choices mingled in with the pre-defined ones, don't show
# todo: show rare items if they are pre-defined
# todo: bin rare responses into "other category"
if (!length(item_nomiss)) {
cat("No non-missing values to show.")
} else if (is.numeric(item_nomiss) || dplyr::n_distinct(item_nomiss) < 20) {
plot_labelled(item_nomiss, item_name, wrap_at, go_vertical)
} else {
cat(dplyr::n_distinct(item_nomiss), " unique, categorical values, so not shown.")
}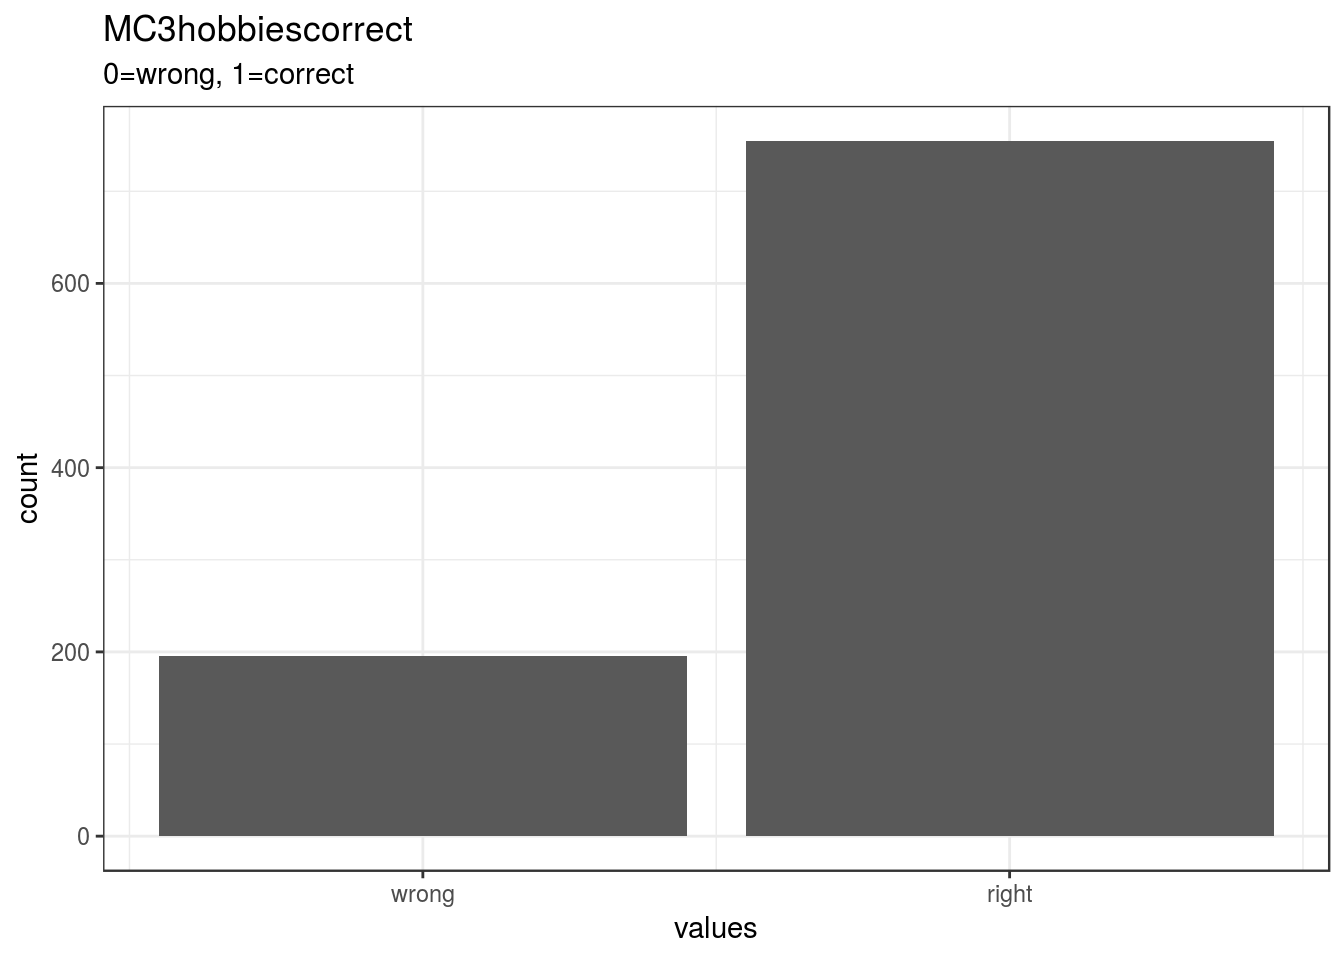
knitr::opts_chunk$set(fig.height = old_height)1055 missing values.
Summary statistics
attributes(item) <- item_attributes
df = data.frame(item, stringsAsFactors = FALSE)
names(df) = html_item_name
escaped_table(codebook_table(df))| name | label | data_type | ordered | value_labels | missing | complete | n | n_unique | top_counts | format.spss | display_width |
|---|---|---|---|---|---|---|---|---|---|---|---|
| MC3hobbiescorrect | 0=wrong, 1=correct | labelled | FALSE | 0. wrong, 1. right |
1055 | 951 | 2006 | 2 | NA: 1055, 1: 755, 0: 196 | F8.2 | 19 |
if (show_missing_values) {
plot_labelled(missing_values, item_name, wrap_at)
}if (!is.null(item_info)) {
# don't show choices again, if they're basically same thing as value labels
if (!is.null(choices) && !is.null(item_info$choices) &&
all(names(na.omit(choices)) == item_info$choices) &&
all(na.omit(choices) == names(item_info$choices))) {
item_info$choices <- NULL
}
item_info$label_parsed <-
item_info$choice_list <- item_info$study_id <- item_info$id <- NULL
pander::pander(item_info)
}Value labels
if (!is.null(choices) && length(choices) && length(choices) < 30) {
pander::pander(as.list(choices))
}- wrong: 0
- right: 1
groupXincome
Distribution
show_missing_values <- FALSE
if (has_labels(item)) {
missing_values <- item[is.na(haven::zap_missing(item))]
attributes(missing_values) <- attributes(item)
if (!is.null(attributes(item)$labels)) {
attributes(missing_values)$labels <- attributes(missing_values)$labels[is.na(attributes(missing_values)$labels)]
attributes(item)$labels <- attributes(item)$labels[!is.na(attributes(item)$labels)]
}
if (is.double(item)) {
show_missing_values <- length(unique(haven::na_tag(missing_values))) > 1
item <- haven::zap_missing(item)
}
if (length(item_attributes$labels) == 0 && is.numeric(item)) {
item <- haven::zap_labels(item)
}
}
item_nomiss <- item[!is.na(item)]
# unnest mc_multiple and so on
if (
is.character(item_nomiss) &&
stringr::str_detect(item_nomiss, stringr::fixed(", ")) &&
(exists("type", item_info) &&
stringr::str_detect(item_info$type, pattern = stringr::fixed("multiple")))
) {
item_nomiss <- unlist(stringr::str_split(item_nomiss, pattern = stringr::fixed(", ")))
}
attributes(item_nomiss) <- attributes(item)
old_height <- knitr::opts_chunk$get("fig.height")
non_missing_choices <- item_attributes[["labels"]]
many_labels <- length(non_missing_choices) > 7
go_vertical <- !is.numeric(item_nomiss) || many_labels
if ( go_vertical ) {
# numeric items are plotted horizontally (because that's what usually expected)
# categorical items are plotted vertically because we can use the screen real estate better this way
if (is.null(choices) ||
dplyr::n_distinct(item_nomiss) > length(non_missing_choices)) {
non_missing_choices <- unique(item_nomiss)
names(non_missing_choices) <- non_missing_choices
}
choice_multiplier <- old_height/6.5
new_height <- 2 + choice_multiplier * length(non_missing_choices)
new_height <- ifelse(new_height > 20, 20, new_height)
new_height <- ifelse(new_height < 1, 1, new_height)
knitr::opts_chunk$set(fig.height = new_height)
}
wrap_at <- knitr::opts_chunk$get("fig.width") * 10# todo: if there are free-text choices mingled in with the pre-defined ones, don't show
# todo: show rare items if they are pre-defined
# todo: bin rare responses into "other category"
if (!length(item_nomiss)) {
cat("No non-missing values to show.")
} else if (is.numeric(item_nomiss) || dplyr::n_distinct(item_nomiss) < 20) {
plot_labelled(item_nomiss, item_name, wrap_at, go_vertical)
} else {
cat(dplyr::n_distinct(item_nomiss), " unique, categorical values, so not shown.")
}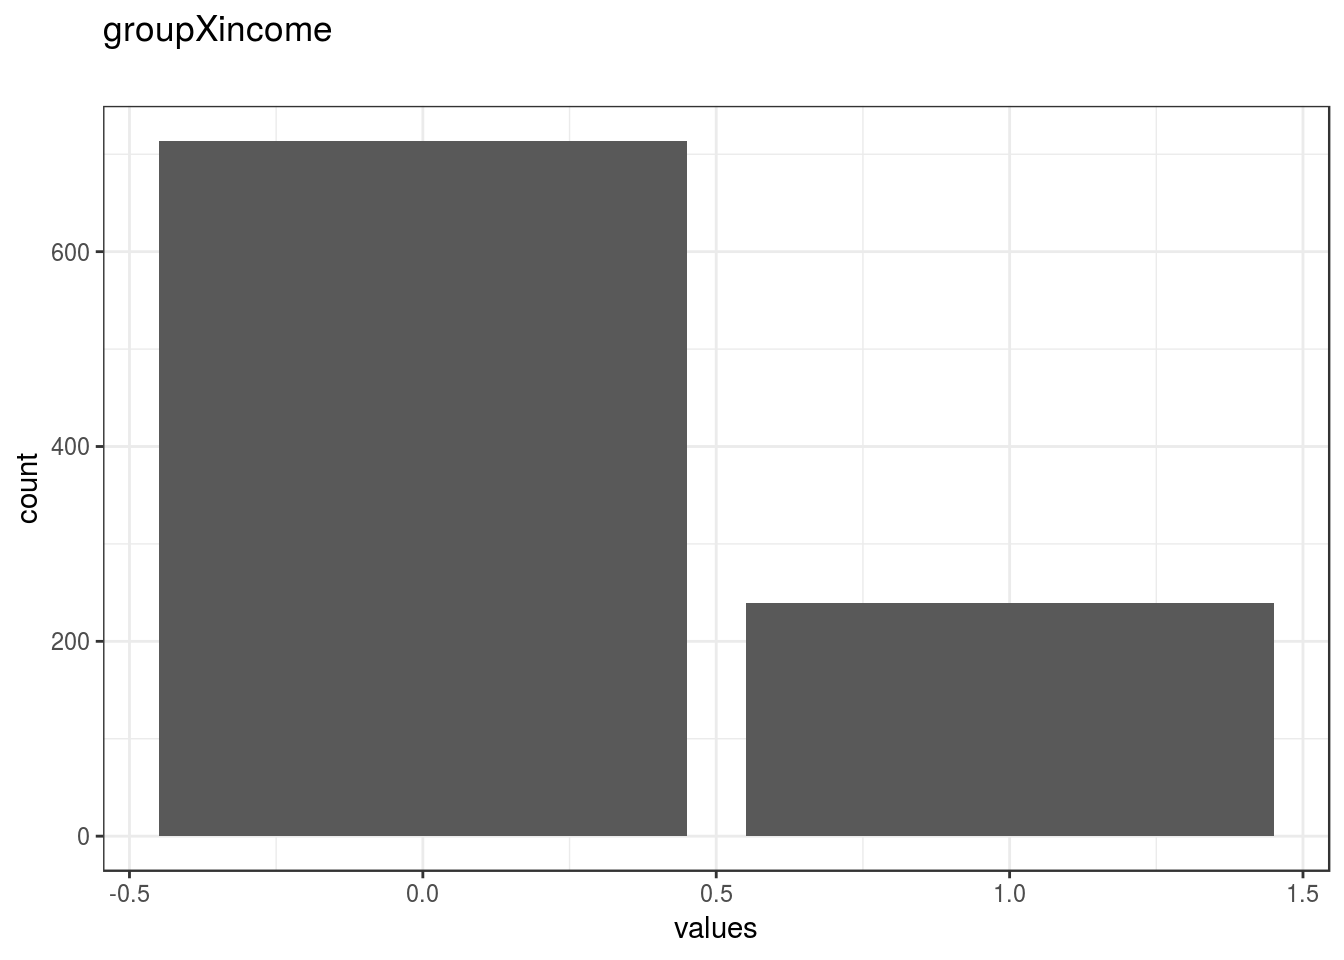
knitr::opts_chunk$set(fig.height = old_height)1053 missing values.
Summary statistics
attributes(item) <- item_attributes
df = data.frame(item, stringsAsFactors = FALSE)
names(df) = html_item_name
escaped_table(codebook_table(df))| name | data_type | missing | complete | n | mean | sd | p0 | p25 | p50 | p75 | p100 | hist | format.spss | display_width |
|---|---|---|---|---|---|---|---|---|---|---|---|---|---|---|
| groupXincome | numeric | 1053 | 953 | 2006 | 0.25 | 0.43 | 0 | 0 | 0 | 1 | 1 | ▇▁▁▁▁▁▁▃ | F8.2 | 14 |
if (show_missing_values) {
plot_labelled(missing_values, item_name, wrap_at)
}if (!is.null(item_info)) {
# don't show choices again, if they're basically same thing as value labels
if (!is.null(choices) && !is.null(item_info$choices) &&
all(names(na.omit(choices)) == item_info$choices) &&
all(na.omit(choices) == names(item_info$choices))) {
item_info$choices <- NULL
}
item_info$label_parsed <-
item_info$choice_list <- item_info$study_id <- item_info$id <- NULL
pander::pander(item_info)
}if (!is.null(choices) && length(choices) && length(choices) < 30) {
pander::pander(as.list(choices))
}groupXformid
Distribution
show_missing_values <- FALSE
if (has_labels(item)) {
missing_values <- item[is.na(haven::zap_missing(item))]
attributes(missing_values) <- attributes(item)
if (!is.null(attributes(item)$labels)) {
attributes(missing_values)$labels <- attributes(missing_values)$labels[is.na(attributes(missing_values)$labels)]
attributes(item)$labels <- attributes(item)$labels[!is.na(attributes(item)$labels)]
}
if (is.double(item)) {
show_missing_values <- length(unique(haven::na_tag(missing_values))) > 1
item <- haven::zap_missing(item)
}
if (length(item_attributes$labels) == 0 && is.numeric(item)) {
item <- haven::zap_labels(item)
}
}
item_nomiss <- item[!is.na(item)]
# unnest mc_multiple and so on
if (
is.character(item_nomiss) &&
stringr::str_detect(item_nomiss, stringr::fixed(", ")) &&
(exists("type", item_info) &&
stringr::str_detect(item_info$type, pattern = stringr::fixed("multiple")))
) {
item_nomiss <- unlist(stringr::str_split(item_nomiss, pattern = stringr::fixed(", ")))
}
attributes(item_nomiss) <- attributes(item)
old_height <- knitr::opts_chunk$get("fig.height")
non_missing_choices <- item_attributes[["labels"]]
many_labels <- length(non_missing_choices) > 7
go_vertical <- !is.numeric(item_nomiss) || many_labels
if ( go_vertical ) {
# numeric items are plotted horizontally (because that's what usually expected)
# categorical items are plotted vertically because we can use the screen real estate better this way
if (is.null(choices) ||
dplyr::n_distinct(item_nomiss) > length(non_missing_choices)) {
non_missing_choices <- unique(item_nomiss)
names(non_missing_choices) <- non_missing_choices
}
choice_multiplier <- old_height/6.5
new_height <- 2 + choice_multiplier * length(non_missing_choices)
new_height <- ifelse(new_height > 20, 20, new_height)
new_height <- ifelse(new_height < 1, 1, new_height)
knitr::opts_chunk$set(fig.height = new_height)
}
wrap_at <- knitr::opts_chunk$get("fig.width") * 10# todo: if there are free-text choices mingled in with the pre-defined ones, don't show
# todo: show rare items if they are pre-defined
# todo: bin rare responses into "other category"
if (!length(item_nomiss)) {
cat("No non-missing values to show.")
} else if (is.numeric(item_nomiss) || dplyr::n_distinct(item_nomiss) < 20) {
plot_labelled(item_nomiss, item_name, wrap_at, go_vertical)
} else {
cat(dplyr::n_distinct(item_nomiss), " unique, categorical values, so not shown.")
}
knitr::opts_chunk$set(fig.height = old_height)1053 missing values.
Summary statistics
attributes(item) <- item_attributes
df = data.frame(item, stringsAsFactors = FALSE)
names(df) = html_item_name
escaped_table(codebook_table(df))| name | data_type | missing | complete | n | mean | sd | p0 | p25 | p50 | p75 | p100 | hist | format.spss | display_width |
|---|---|---|---|---|---|---|---|---|---|---|---|---|---|---|
| groupXformid | numeric | 1053 | 953 | 2006 | 0.25 | 0.43 | 0 | 0 | 0 | 0 | 1 | ▇▁▁▁▁▁▁▂ | F8.2 | 14 |
if (show_missing_values) {
plot_labelled(missing_values, item_name, wrap_at)
}if (!is.null(item_info)) {
# don't show choices again, if they're basically same thing as value labels
if (!is.null(choices) && !is.null(item_info$choices) &&
all(names(na.omit(choices)) == item_info$choices) &&
all(na.omit(choices) == names(item_info$choices))) {
item_info$choices <- NULL
}
item_info$label_parsed <-
item_info$choice_list <- item_info$study_id <- item_info$id <- NULL
pander::pander(item_info)
}if (!is.null(choices) && length(choices) && length(choices) < 30) {
pander::pander(as.list(choices))
}groupXcrisk
Distribution
show_missing_values <- FALSE
if (has_labels(item)) {
missing_values <- item[is.na(haven::zap_missing(item))]
attributes(missing_values) <- attributes(item)
if (!is.null(attributes(item)$labels)) {
attributes(missing_values)$labels <- attributes(missing_values)$labels[is.na(attributes(missing_values)$labels)]
attributes(item)$labels <- attributes(item)$labels[!is.na(attributes(item)$labels)]
}
if (is.double(item)) {
show_missing_values <- length(unique(haven::na_tag(missing_values))) > 1
item <- haven::zap_missing(item)
}
if (length(item_attributes$labels) == 0 && is.numeric(item)) {
item <- haven::zap_labels(item)
}
}
item_nomiss <- item[!is.na(item)]
# unnest mc_multiple and so on
if (
is.character(item_nomiss) &&
stringr::str_detect(item_nomiss, stringr::fixed(", ")) &&
(exists("type", item_info) &&
stringr::str_detect(item_info$type, pattern = stringr::fixed("multiple")))
) {
item_nomiss <- unlist(stringr::str_split(item_nomiss, pattern = stringr::fixed(", ")))
}
attributes(item_nomiss) <- attributes(item)
old_height <- knitr::opts_chunk$get("fig.height")
non_missing_choices <- item_attributes[["labels"]]
many_labels <- length(non_missing_choices) > 7
go_vertical <- !is.numeric(item_nomiss) || many_labels
if ( go_vertical ) {
# numeric items are plotted horizontally (because that's what usually expected)
# categorical items are plotted vertically because we can use the screen real estate better this way
if (is.null(choices) ||
dplyr::n_distinct(item_nomiss) > length(non_missing_choices)) {
non_missing_choices <- unique(item_nomiss)
names(non_missing_choices) <- non_missing_choices
}
choice_multiplier <- old_height/6.5
new_height <- 2 + choice_multiplier * length(non_missing_choices)
new_height <- ifelse(new_height > 20, 20, new_height)
new_height <- ifelse(new_height < 1, 1, new_height)
knitr::opts_chunk$set(fig.height = new_height)
}
wrap_at <- knitr::opts_chunk$get("fig.width") * 10# todo: if there are free-text choices mingled in with the pre-defined ones, don't show
# todo: show rare items if they are pre-defined
# todo: bin rare responses into "other category"
if (!length(item_nomiss)) {
cat("No non-missing values to show.")
} else if (is.numeric(item_nomiss) || dplyr::n_distinct(item_nomiss) < 20) {
plot_labelled(item_nomiss, item_name, wrap_at, go_vertical)
} else {
cat(dplyr::n_distinct(item_nomiss), " unique, categorical values, so not shown.")
}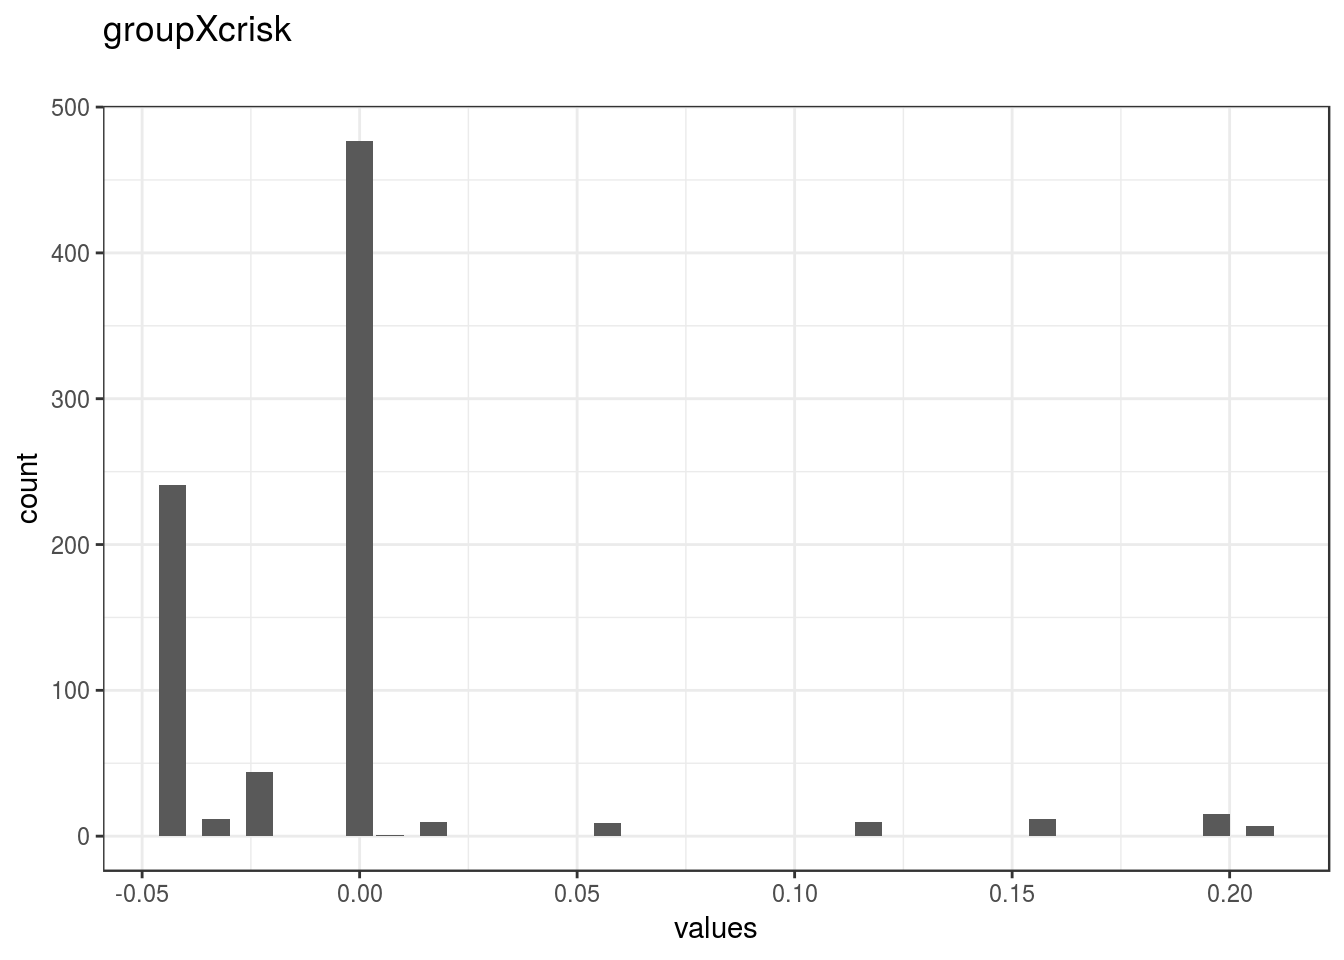
knitr::opts_chunk$set(fig.height = old_height)1168 missing values.
Summary statistics
attributes(item) <- item_attributes
df = data.frame(item, stringsAsFactors = FALSE)
names(df) = html_item_name
escaped_table(codebook_table(df))| name | data_type | missing | complete | n | mean | sd | p0 | p25 | p50 | p75 | p100 | hist | format.spss | display_width |
|---|---|---|---|---|---|---|---|---|---|---|---|---|---|---|
| groupXcrisk | numeric | 1168 | 838 | 2006 | -0.0043 | 0.047 | -0.043 | -0.043 | 0 | 0 | 0.21 | ▅▇▁▁▁▁▁▁ | F8.2 | 13 |
if (show_missing_values) {
plot_labelled(missing_values, item_name, wrap_at)
}if (!is.null(item_info)) {
# don't show choices again, if they're basically same thing as value labels
if (!is.null(choices) && !is.null(item_info$choices) &&
all(names(na.omit(choices)) == item_info$choices) &&
all(na.omit(choices) == names(item_info$choices))) {
item_info$choices <- NULL
}
item_info$label_parsed <-
item_info$choice_list <- item_info$study_id <- item_info$id <- NULL
pander::pander(item_info)
}if (!is.null(choices) && length(choices) && length(choices) < 30) {
pander::pander(as.list(choices))
}groupXvsc
Distribution
show_missing_values <- FALSE
if (has_labels(item)) {
missing_values <- item[is.na(haven::zap_missing(item))]
attributes(missing_values) <- attributes(item)
if (!is.null(attributes(item)$labels)) {
attributes(missing_values)$labels <- attributes(missing_values)$labels[is.na(attributes(missing_values)$labels)]
attributes(item)$labels <- attributes(item)$labels[!is.na(attributes(item)$labels)]
}
if (is.double(item)) {
show_missing_values <- length(unique(haven::na_tag(missing_values))) > 1
item <- haven::zap_missing(item)
}
if (length(item_attributes$labels) == 0 && is.numeric(item)) {
item <- haven::zap_labels(item)
}
}
item_nomiss <- item[!is.na(item)]
# unnest mc_multiple and so on
if (
is.character(item_nomiss) &&
stringr::str_detect(item_nomiss, stringr::fixed(", ")) &&
(exists("type", item_info) &&
stringr::str_detect(item_info$type, pattern = stringr::fixed("multiple")))
) {
item_nomiss <- unlist(stringr::str_split(item_nomiss, pattern = stringr::fixed(", ")))
}
attributes(item_nomiss) <- attributes(item)
old_height <- knitr::opts_chunk$get("fig.height")
non_missing_choices <- item_attributes[["labels"]]
many_labels <- length(non_missing_choices) > 7
go_vertical <- !is.numeric(item_nomiss) || many_labels
if ( go_vertical ) {
# numeric items are plotted horizontally (because that's what usually expected)
# categorical items are plotted vertically because we can use the screen real estate better this way
if (is.null(choices) ||
dplyr::n_distinct(item_nomiss) > length(non_missing_choices)) {
non_missing_choices <- unique(item_nomiss)
names(non_missing_choices) <- non_missing_choices
}
choice_multiplier <- old_height/6.5
new_height <- 2 + choice_multiplier * length(non_missing_choices)
new_height <- ifelse(new_height > 20, 20, new_height)
new_height <- ifelse(new_height < 1, 1, new_height)
knitr::opts_chunk$set(fig.height = new_height)
}
wrap_at <- knitr::opts_chunk$get("fig.width") * 10# todo: if there are free-text choices mingled in with the pre-defined ones, don't show
# todo: show rare items if they are pre-defined
# todo: bin rare responses into "other category"
if (!length(item_nomiss)) {
cat("No non-missing values to show.")
} else if (is.numeric(item_nomiss) || dplyr::n_distinct(item_nomiss) < 20) {
plot_labelled(item_nomiss, item_name, wrap_at, go_vertical)
} else {
cat(dplyr::n_distinct(item_nomiss), " unique, categorical values, so not shown.")
}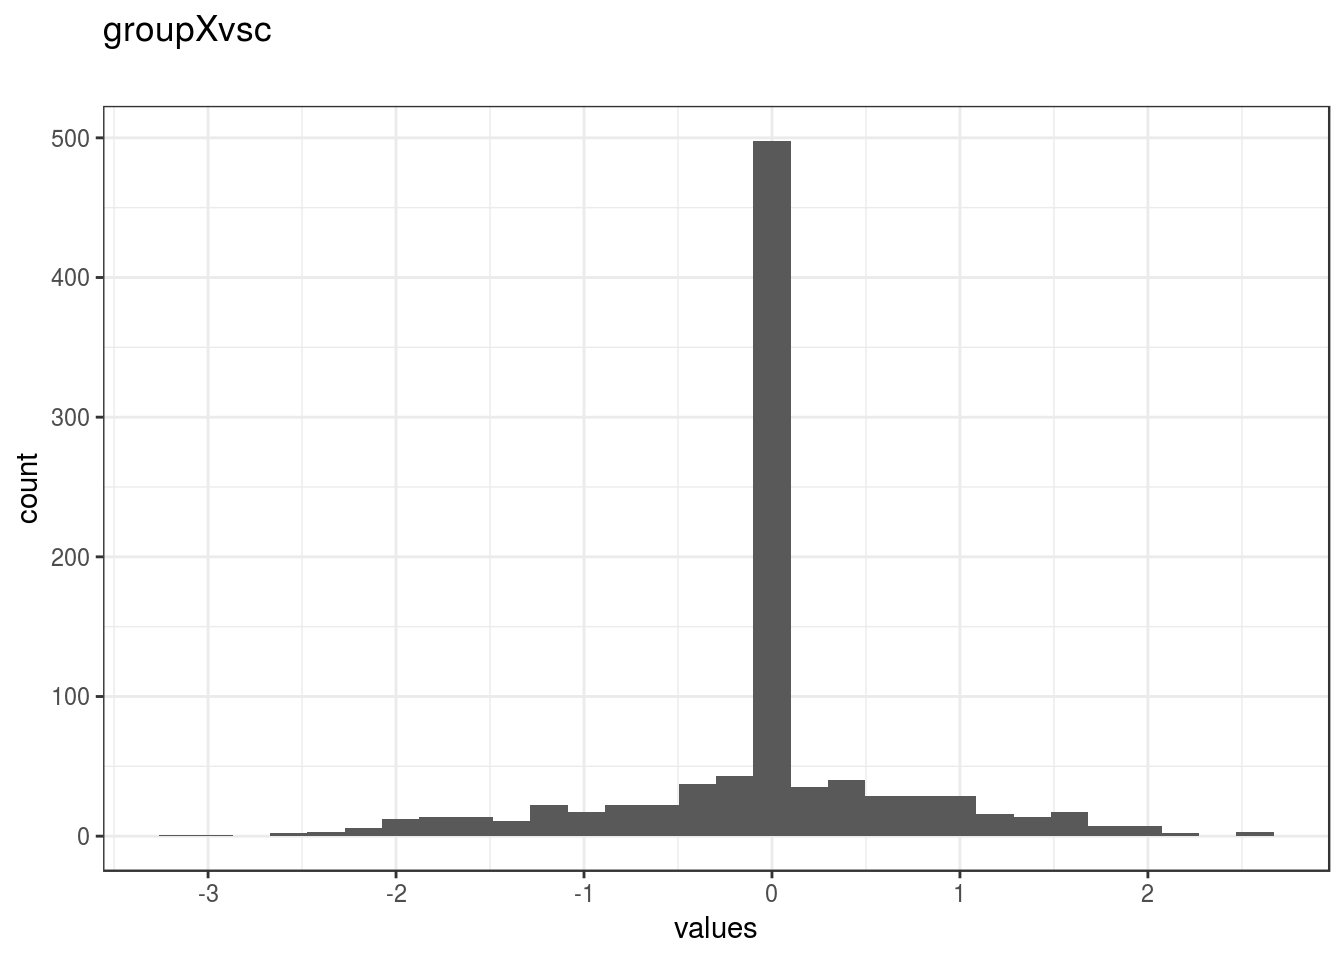
knitr::opts_chunk$set(fig.height = old_height)1053 missing values.
Summary statistics
attributes(item) <- item_attributes
df = data.frame(item, stringsAsFactors = FALSE)
names(df) = html_item_name
escaped_table(codebook_table(df))| name | data_type | missing | complete | n | mean | sd | p0 | p25 | p50 | p75 | p100 | hist | format.spss | display_width |
|---|---|---|---|---|---|---|---|---|---|---|---|---|---|---|
| groupXvsc | numeric | 1053 | 953 | 2006 | -0.019 | 0.75 | -3.13 | 0 | 0 | 0 | 2.6 | ▁▁▁▁▇▂▁▁ | F8.2 | 11 |
if (show_missing_values) {
plot_labelled(missing_values, item_name, wrap_at)
}if (!is.null(item_info)) {
# don't show choices again, if they're basically same thing as value labels
if (!is.null(choices) && !is.null(item_info$choices) &&
all(names(na.omit(choices)) == item_info$choices) &&
all(na.omit(choices) == names(item_info$choices))) {
item_info$choices <- NULL
}
item_info$label_parsed <-
item_info$choice_list <- item_info$study_id <- item_info$id <- NULL
pander::pander(item_info)
}if (!is.null(choices) && length(choices) && length(choices) < 30) {
pander::pander(as.list(choices))
}incomeXformid
Distribution
show_missing_values <- FALSE
if (has_labels(item)) {
missing_values <- item[is.na(haven::zap_missing(item))]
attributes(missing_values) <- attributes(item)
if (!is.null(attributes(item)$labels)) {
attributes(missing_values)$labels <- attributes(missing_values)$labels[is.na(attributes(missing_values)$labels)]
attributes(item)$labels <- attributes(item)$labels[!is.na(attributes(item)$labels)]
}
if (is.double(item)) {
show_missing_values <- length(unique(haven::na_tag(missing_values))) > 1
item <- haven::zap_missing(item)
}
if (length(item_attributes$labels) == 0 && is.numeric(item)) {
item <- haven::zap_labels(item)
}
}
item_nomiss <- item[!is.na(item)]
# unnest mc_multiple and so on
if (
is.character(item_nomiss) &&
stringr::str_detect(item_nomiss, stringr::fixed(", ")) &&
(exists("type", item_info) &&
stringr::str_detect(item_info$type, pattern = stringr::fixed("multiple")))
) {
item_nomiss <- unlist(stringr::str_split(item_nomiss, pattern = stringr::fixed(", ")))
}
attributes(item_nomiss) <- attributes(item)
old_height <- knitr::opts_chunk$get("fig.height")
non_missing_choices <- item_attributes[["labels"]]
many_labels <- length(non_missing_choices) > 7
go_vertical <- !is.numeric(item_nomiss) || many_labels
if ( go_vertical ) {
# numeric items are plotted horizontally (because that's what usually expected)
# categorical items are plotted vertically because we can use the screen real estate better this way
if (is.null(choices) ||
dplyr::n_distinct(item_nomiss) > length(non_missing_choices)) {
non_missing_choices <- unique(item_nomiss)
names(non_missing_choices) <- non_missing_choices
}
choice_multiplier <- old_height/6.5
new_height <- 2 + choice_multiplier * length(non_missing_choices)
new_height <- ifelse(new_height > 20, 20, new_height)
new_height <- ifelse(new_height < 1, 1, new_height)
knitr::opts_chunk$set(fig.height = new_height)
}
wrap_at <- knitr::opts_chunk$get("fig.width") * 10# todo: if there are free-text choices mingled in with the pre-defined ones, don't show
# todo: show rare items if they are pre-defined
# todo: bin rare responses into "other category"
if (!length(item_nomiss)) {
cat("No non-missing values to show.")
} else if (is.numeric(item_nomiss) || dplyr::n_distinct(item_nomiss) < 20) {
plot_labelled(item_nomiss, item_name, wrap_at, go_vertical)
} else {
cat(dplyr::n_distinct(item_nomiss), " unique, categorical values, so not shown.")
}
knitr::opts_chunk$set(fig.height = old_height)1053 missing values.
Summary statistics
attributes(item) <- item_attributes
df = data.frame(item, stringsAsFactors = FALSE)
names(df) = html_item_name
escaped_table(codebook_table(df))| name | data_type | missing | complete | n | mean | sd | p0 | p25 | p50 | p75 | p100 | hist | format.spss | display_width |
|---|---|---|---|---|---|---|---|---|---|---|---|---|---|---|
| incomeXformid | numeric | 1053 | 953 | 2006 | 0.25 | 0.43 | 0 | 0 | 0 | 1 | 1 | ▇▁▁▁▁▁▁▃ | F8.2 | 15 |
if (show_missing_values) {
plot_labelled(missing_values, item_name, wrap_at)
}if (!is.null(item_info)) {
# don't show choices again, if they're basically same thing as value labels
if (!is.null(choices) && !is.null(item_info$choices) &&
all(names(na.omit(choices)) == item_info$choices) &&
all(na.omit(choices) == names(item_info$choices))) {
item_info$choices <- NULL
}
item_info$label_parsed <-
item_info$choice_list <- item_info$study_id <- item_info$id <- NULL
pander::pander(item_info)
}if (!is.null(choices) && length(choices) && length(choices) < 30) {
pander::pander(as.list(choices))
}incomeXcrisk
Distribution
show_missing_values <- FALSE
if (has_labels(item)) {
missing_values <- item[is.na(haven::zap_missing(item))]
attributes(missing_values) <- attributes(item)
if (!is.null(attributes(item)$labels)) {
attributes(missing_values)$labels <- attributes(missing_values)$labels[is.na(attributes(missing_values)$labels)]
attributes(item)$labels <- attributes(item)$labels[!is.na(attributes(item)$labels)]
}
if (is.double(item)) {
show_missing_values <- length(unique(haven::na_tag(missing_values))) > 1
item <- haven::zap_missing(item)
}
if (length(item_attributes$labels) == 0 && is.numeric(item)) {
item <- haven::zap_labels(item)
}
}
item_nomiss <- item[!is.na(item)]
# unnest mc_multiple and so on
if (
is.character(item_nomiss) &&
stringr::str_detect(item_nomiss, stringr::fixed(", ")) &&
(exists("type", item_info) &&
stringr::str_detect(item_info$type, pattern = stringr::fixed("multiple")))
) {
item_nomiss <- unlist(stringr::str_split(item_nomiss, pattern = stringr::fixed(", ")))
}
attributes(item_nomiss) <- attributes(item)
old_height <- knitr::opts_chunk$get("fig.height")
non_missing_choices <- item_attributes[["labels"]]
many_labels <- length(non_missing_choices) > 7
go_vertical <- !is.numeric(item_nomiss) || many_labels
if ( go_vertical ) {
# numeric items are plotted horizontally (because that's what usually expected)
# categorical items are plotted vertically because we can use the screen real estate better this way
if (is.null(choices) ||
dplyr::n_distinct(item_nomiss) > length(non_missing_choices)) {
non_missing_choices <- unique(item_nomiss)
names(non_missing_choices) <- non_missing_choices
}
choice_multiplier <- old_height/6.5
new_height <- 2 + choice_multiplier * length(non_missing_choices)
new_height <- ifelse(new_height > 20, 20, new_height)
new_height <- ifelse(new_height < 1, 1, new_height)
knitr::opts_chunk$set(fig.height = new_height)
}
wrap_at <- knitr::opts_chunk$get("fig.width") * 10# todo: if there are free-text choices mingled in with the pre-defined ones, don't show
# todo: show rare items if they are pre-defined
# todo: bin rare responses into "other category"
if (!length(item_nomiss)) {
cat("No non-missing values to show.")
} else if (is.numeric(item_nomiss) || dplyr::n_distinct(item_nomiss) < 20) {
plot_labelled(item_nomiss, item_name, wrap_at, go_vertical)
} else {
cat(dplyr::n_distinct(item_nomiss), " unique, categorical values, so not shown.")
}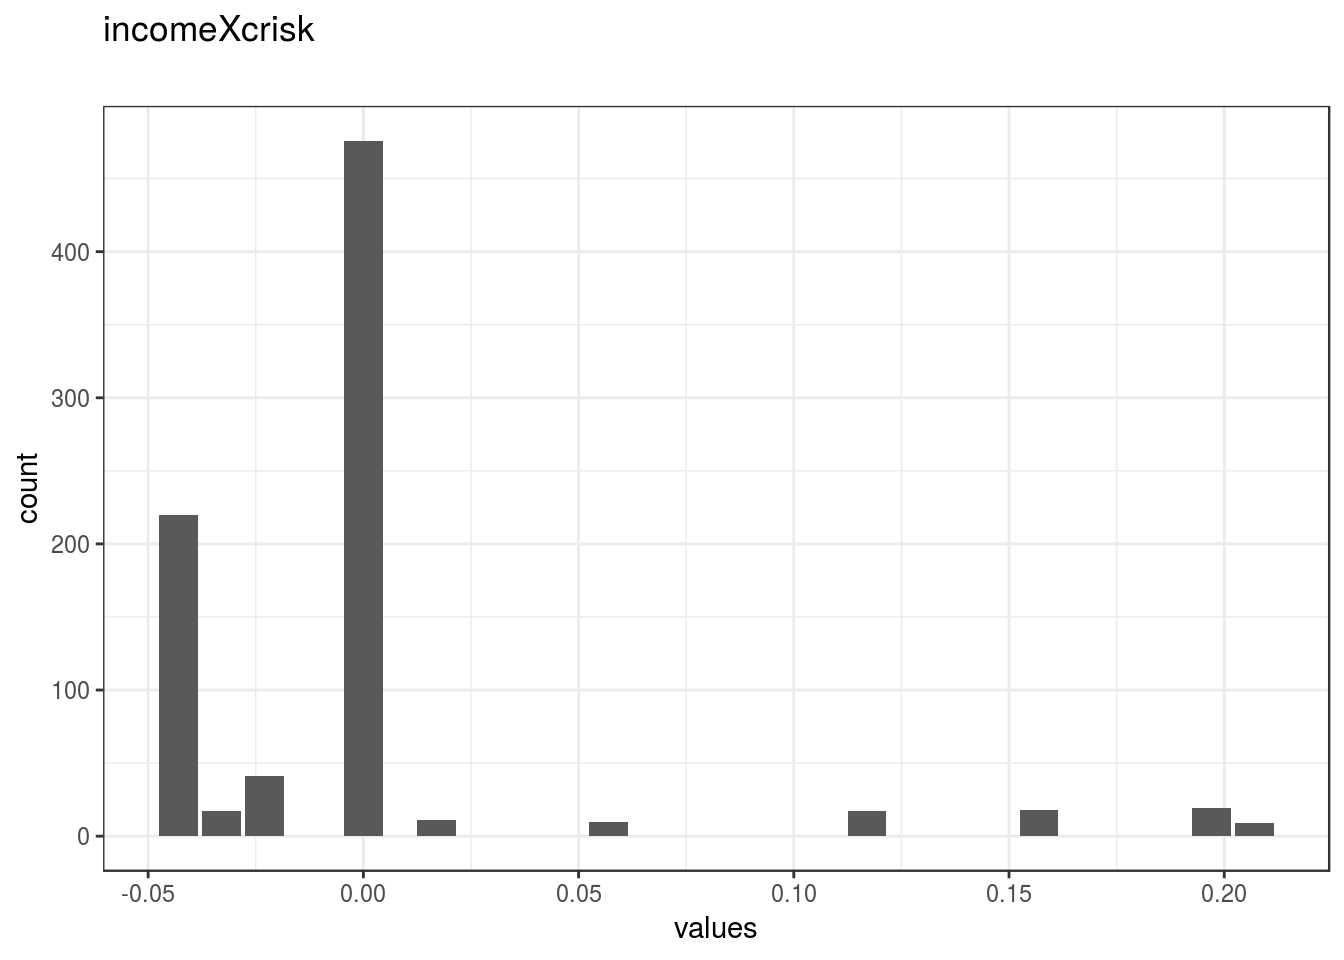
knitr::opts_chunk$set(fig.height = old_height)1168 missing values.
Summary statistics
attributes(item) <- item_attributes
df = data.frame(item, stringsAsFactors = FALSE)
names(df) = html_item_name
escaped_table(codebook_table(df))| name | data_type | missing | complete | n | mean | sd | p0 | p25 | p50 | p75 | p100 | hist | format.spss | display_width |
|---|---|---|---|---|---|---|---|---|---|---|---|---|---|---|
| incomeXcrisk | numeric | 1168 | 838 | 2006 | 0.00025 | 0.052 | -0.043 | -0.043 | 0 | 0 | 0.21 | ▅▇▁▁▁▁▁▁ | F8.2 | 14 |
if (show_missing_values) {
plot_labelled(missing_values, item_name, wrap_at)
}if (!is.null(item_info)) {
# don't show choices again, if they're basically same thing as value labels
if (!is.null(choices) && !is.null(item_info$choices) &&
all(names(na.omit(choices)) == item_info$choices) &&
all(na.omit(choices) == names(item_info$choices))) {
item_info$choices <- NULL
}
item_info$label_parsed <-
item_info$choice_list <- item_info$study_id <- item_info$id <- NULL
pander::pander(item_info)
}if (!is.null(choices) && length(choices) && length(choices) < 30) {
pander::pander(as.list(choices))
}incomeXvsc
Distribution
show_missing_values <- FALSE
if (has_labels(item)) {
missing_values <- item[is.na(haven::zap_missing(item))]
attributes(missing_values) <- attributes(item)
if (!is.null(attributes(item)$labels)) {
attributes(missing_values)$labels <- attributes(missing_values)$labels[is.na(attributes(missing_values)$labels)]
attributes(item)$labels <- attributes(item)$labels[!is.na(attributes(item)$labels)]
}
if (is.double(item)) {
show_missing_values <- length(unique(haven::na_tag(missing_values))) > 1
item <- haven::zap_missing(item)
}
if (length(item_attributes$labels) == 0 && is.numeric(item)) {
item <- haven::zap_labels(item)
}
}
item_nomiss <- item[!is.na(item)]
# unnest mc_multiple and so on
if (
is.character(item_nomiss) &&
stringr::str_detect(item_nomiss, stringr::fixed(", ")) &&
(exists("type", item_info) &&
stringr::str_detect(item_info$type, pattern = stringr::fixed("multiple")))
) {
item_nomiss <- unlist(stringr::str_split(item_nomiss, pattern = stringr::fixed(", ")))
}
attributes(item_nomiss) <- attributes(item)
old_height <- knitr::opts_chunk$get("fig.height")
non_missing_choices <- item_attributes[["labels"]]
many_labels <- length(non_missing_choices) > 7
go_vertical <- !is.numeric(item_nomiss) || many_labels
if ( go_vertical ) {
# numeric items are plotted horizontally (because that's what usually expected)
# categorical items are plotted vertically because we can use the screen real estate better this way
if (is.null(choices) ||
dplyr::n_distinct(item_nomiss) > length(non_missing_choices)) {
non_missing_choices <- unique(item_nomiss)
names(non_missing_choices) <- non_missing_choices
}
choice_multiplier <- old_height/6.5
new_height <- 2 + choice_multiplier * length(non_missing_choices)
new_height <- ifelse(new_height > 20, 20, new_height)
new_height <- ifelse(new_height < 1, 1, new_height)
knitr::opts_chunk$set(fig.height = new_height)
}
wrap_at <- knitr::opts_chunk$get("fig.width") * 10# todo: if there are free-text choices mingled in with the pre-defined ones, don't show
# todo: show rare items if they are pre-defined
# todo: bin rare responses into "other category"
if (!length(item_nomiss)) {
cat("No non-missing values to show.")
} else if (is.numeric(item_nomiss) || dplyr::n_distinct(item_nomiss) < 20) {
plot_labelled(item_nomiss, item_name, wrap_at, go_vertical)
} else {
cat(dplyr::n_distinct(item_nomiss), " unique, categorical values, so not shown.")
}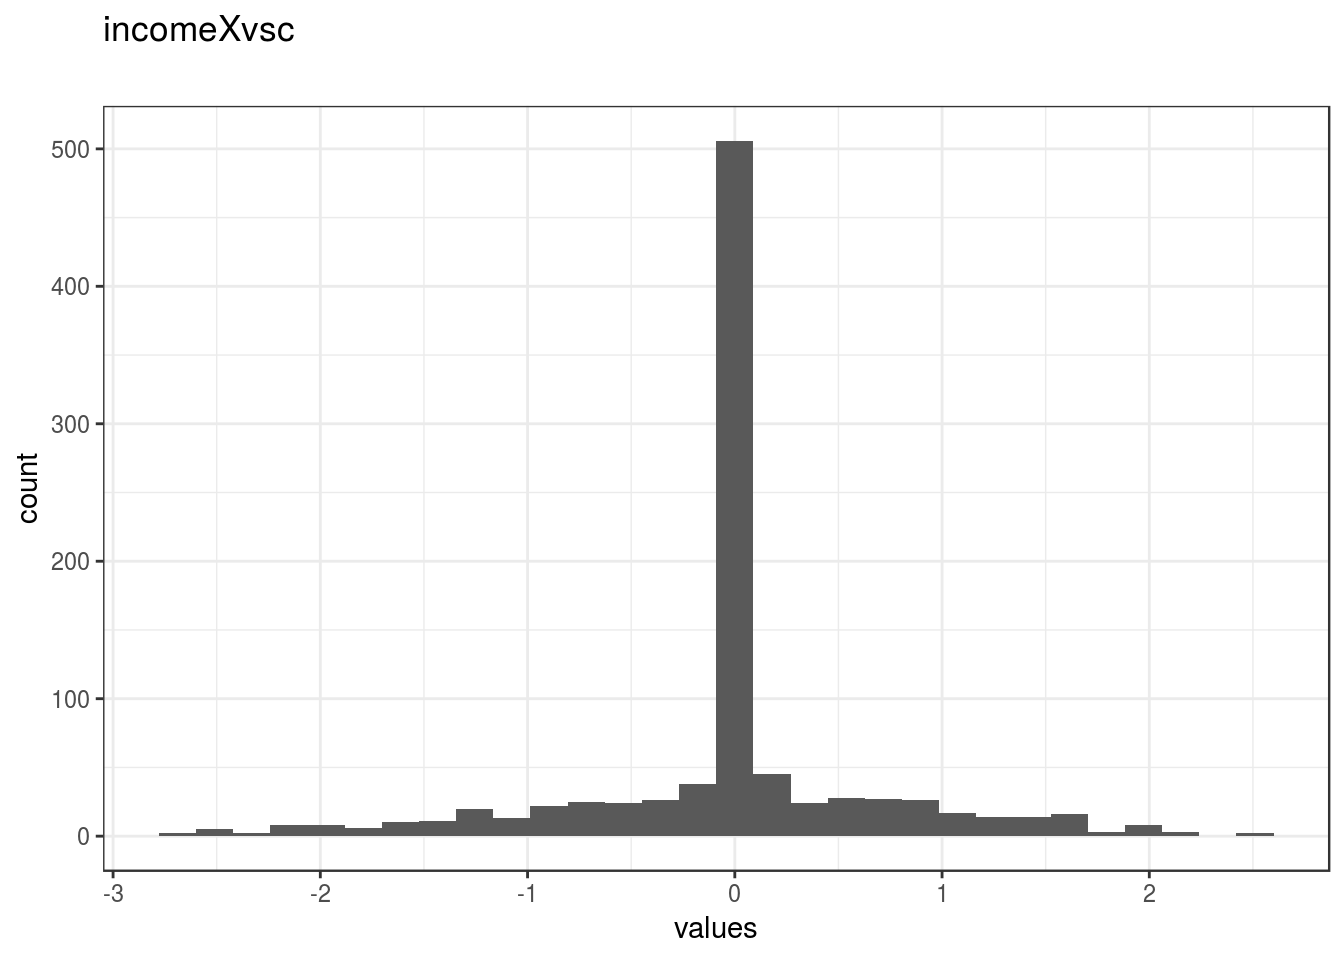
knitr::opts_chunk$set(fig.height = old_height)1053 missing values.
Summary statistics
attributes(item) <- item_attributes
df = data.frame(item, stringsAsFactors = FALSE)
names(df) = html_item_name
escaped_table(codebook_table(df))| name | data_type | missing | complete | n | mean | sd | p0 | p25 | p50 | p75 | p100 | hist | format.spss | display_width |
|---|---|---|---|---|---|---|---|---|---|---|---|---|---|---|
| incomeXvsc | numeric | 1053 | 953 | 2006 | -0.014 | 0.73 | -2.7 | -0.00062 | 0 | 0 | 2.5 | ▁▁▁▂▇▁▁▁ | F8.2 | 12 |
if (show_missing_values) {
plot_labelled(missing_values, item_name, wrap_at)
}if (!is.null(item_info)) {
# don't show choices again, if they're basically same thing as value labels
if (!is.null(choices) && !is.null(item_info$choices) &&
all(names(na.omit(choices)) == item_info$choices) &&
all(na.omit(choices) == names(item_info$choices))) {
item_info$choices <- NULL
}
item_info$label_parsed <-
item_info$choice_list <- item_info$study_id <- item_info$id <- NULL
pander::pander(item_info)
}if (!is.null(choices) && length(choices) && length(choices) < 30) {
pander::pander(as.list(choices))
}formidXcrisk
Distribution
show_missing_values <- FALSE
if (has_labels(item)) {
missing_values <- item[is.na(haven::zap_missing(item))]
attributes(missing_values) <- attributes(item)
if (!is.null(attributes(item)$labels)) {
attributes(missing_values)$labels <- attributes(missing_values)$labels[is.na(attributes(missing_values)$labels)]
attributes(item)$labels <- attributes(item)$labels[!is.na(attributes(item)$labels)]
}
if (is.double(item)) {
show_missing_values <- length(unique(haven::na_tag(missing_values))) > 1
item <- haven::zap_missing(item)
}
if (length(item_attributes$labels) == 0 && is.numeric(item)) {
item <- haven::zap_labels(item)
}
}
item_nomiss <- item[!is.na(item)]
# unnest mc_multiple and so on
if (
is.character(item_nomiss) &&
stringr::str_detect(item_nomiss, stringr::fixed(", ")) &&
(exists("type", item_info) &&
stringr::str_detect(item_info$type, pattern = stringr::fixed("multiple")))
) {
item_nomiss <- unlist(stringr::str_split(item_nomiss, pattern = stringr::fixed(", ")))
}
attributes(item_nomiss) <- attributes(item)
old_height <- knitr::opts_chunk$get("fig.height")
non_missing_choices <- item_attributes[["labels"]]
many_labels <- length(non_missing_choices) > 7
go_vertical <- !is.numeric(item_nomiss) || many_labels
if ( go_vertical ) {
# numeric items are plotted horizontally (because that's what usually expected)
# categorical items are plotted vertically because we can use the screen real estate better this way
if (is.null(choices) ||
dplyr::n_distinct(item_nomiss) > length(non_missing_choices)) {
non_missing_choices <- unique(item_nomiss)
names(non_missing_choices) <- non_missing_choices
}
choice_multiplier <- old_height/6.5
new_height <- 2 + choice_multiplier * length(non_missing_choices)
new_height <- ifelse(new_height > 20, 20, new_height)
new_height <- ifelse(new_height < 1, 1, new_height)
knitr::opts_chunk$set(fig.height = new_height)
}
wrap_at <- knitr::opts_chunk$get("fig.width") * 10# todo: if there are free-text choices mingled in with the pre-defined ones, don't show
# todo: show rare items if they are pre-defined
# todo: bin rare responses into "other category"
if (!length(item_nomiss)) {
cat("No non-missing values to show.")
} else if (is.numeric(item_nomiss) || dplyr::n_distinct(item_nomiss) < 20) {
plot_labelled(item_nomiss, item_name, wrap_at, go_vertical)
} else {
cat(dplyr::n_distinct(item_nomiss), " unique, categorical values, so not shown.")
}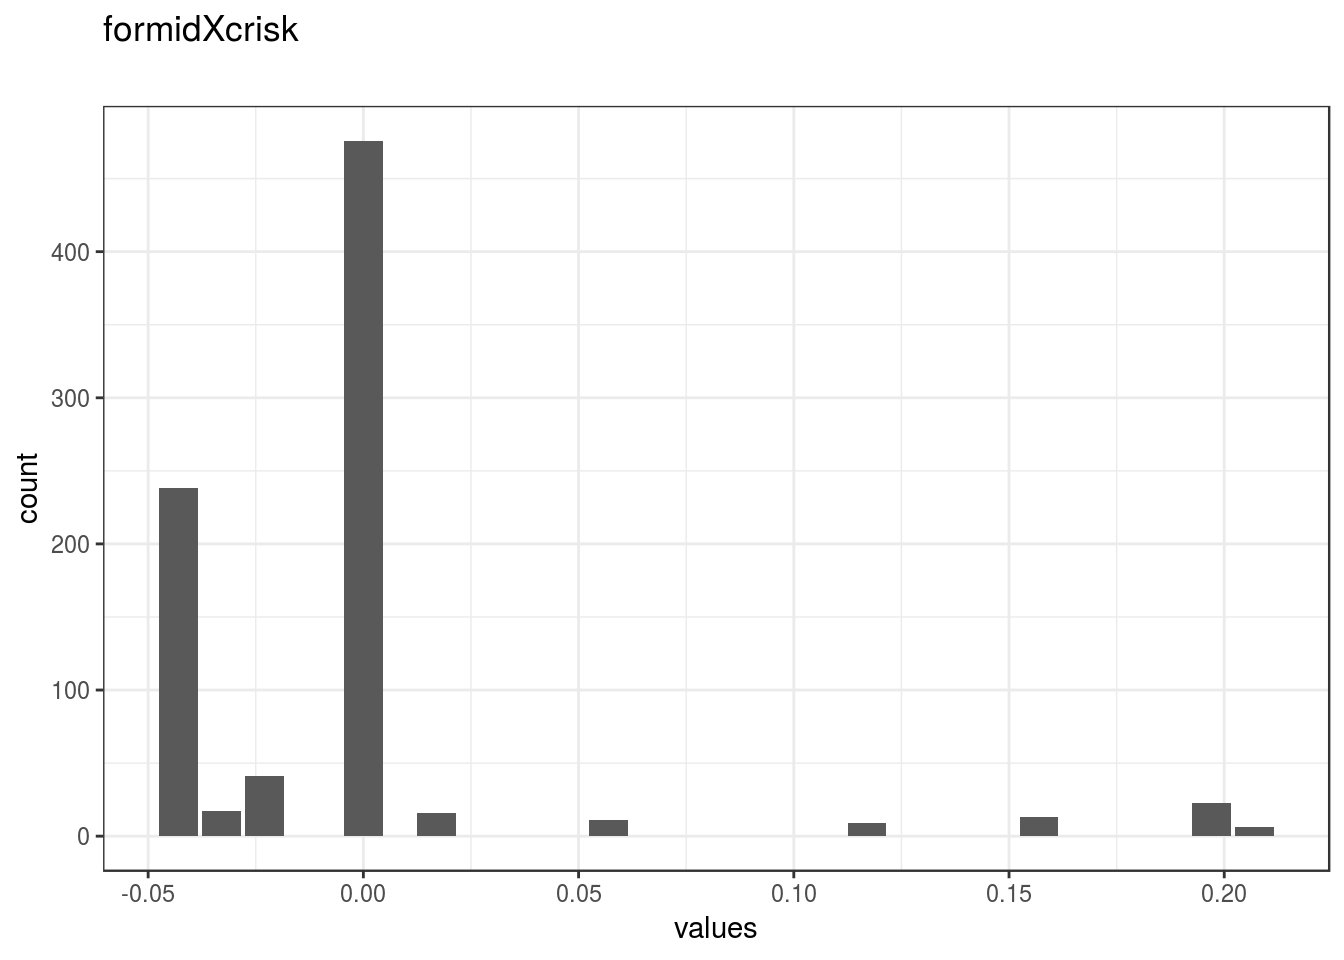
knitr::opts_chunk$set(fig.height = old_height)1156 missing values.
Summary statistics
attributes(item) <- item_attributes
df = data.frame(item, stringsAsFactors = FALSE)
names(df) = html_item_name
escaped_table(codebook_table(df))| name | data_type | missing | complete | n | mean | sd | p0 | p25 | p50 | p75 | p100 | hist | format.spss | display_width |
|---|---|---|---|---|---|---|---|---|---|---|---|---|---|---|
| formidXcrisk | numeric | 1156 | 850 | 2006 | -0.0023 | 0.05 | -0.043 | -0.043 | 0 | 0 | 0.21 | ▅▇▁▁▁▁▁▁ | F8.2 | 14 |
if (show_missing_values) {
plot_labelled(missing_values, item_name, wrap_at)
}if (!is.null(item_info)) {
# don't show choices again, if they're basically same thing as value labels
if (!is.null(choices) && !is.null(item_info$choices) &&
all(names(na.omit(choices)) == item_info$choices) &&
all(na.omit(choices) == names(item_info$choices))) {
item_info$choices <- NULL
}
item_info$label_parsed <-
item_info$choice_list <- item_info$study_id <- item_info$id <- NULL
pander::pander(item_info)
}if (!is.null(choices) && length(choices) && length(choices) < 30) {
pander::pander(as.list(choices))
}formidXvsc
Distribution
show_missing_values <- FALSE
if (has_labels(item)) {
missing_values <- item[is.na(haven::zap_missing(item))]
attributes(missing_values) <- attributes(item)
if (!is.null(attributes(item)$labels)) {
attributes(missing_values)$labels <- attributes(missing_values)$labels[is.na(attributes(missing_values)$labels)]
attributes(item)$labels <- attributes(item)$labels[!is.na(attributes(item)$labels)]
}
if (is.double(item)) {
show_missing_values <- length(unique(haven::na_tag(missing_values))) > 1
item <- haven::zap_missing(item)
}
if (length(item_attributes$labels) == 0 && is.numeric(item)) {
item <- haven::zap_labels(item)
}
}
item_nomiss <- item[!is.na(item)]
# unnest mc_multiple and so on
if (
is.character(item_nomiss) &&
stringr::str_detect(item_nomiss, stringr::fixed(", ")) &&
(exists("type", item_info) &&
stringr::str_detect(item_info$type, pattern = stringr::fixed("multiple")))
) {
item_nomiss <- unlist(stringr::str_split(item_nomiss, pattern = stringr::fixed(", ")))
}
attributes(item_nomiss) <- attributes(item)
old_height <- knitr::opts_chunk$get("fig.height")
non_missing_choices <- item_attributes[["labels"]]
many_labels <- length(non_missing_choices) > 7
go_vertical <- !is.numeric(item_nomiss) || many_labels
if ( go_vertical ) {
# numeric items are plotted horizontally (because that's what usually expected)
# categorical items are plotted vertically because we can use the screen real estate better this way
if (is.null(choices) ||
dplyr::n_distinct(item_nomiss) > length(non_missing_choices)) {
non_missing_choices <- unique(item_nomiss)
names(non_missing_choices) <- non_missing_choices
}
choice_multiplier <- old_height/6.5
new_height <- 2 + choice_multiplier * length(non_missing_choices)
new_height <- ifelse(new_height > 20, 20, new_height)
new_height <- ifelse(new_height < 1, 1, new_height)
knitr::opts_chunk$set(fig.height = new_height)
}
wrap_at <- knitr::opts_chunk$get("fig.width") * 10# todo: if there are free-text choices mingled in with the pre-defined ones, don't show
# todo: show rare items if they are pre-defined
# todo: bin rare responses into "other category"
if (!length(item_nomiss)) {
cat("No non-missing values to show.")
} else if (is.numeric(item_nomiss) || dplyr::n_distinct(item_nomiss) < 20) {
plot_labelled(item_nomiss, item_name, wrap_at, go_vertical)
} else {
cat(dplyr::n_distinct(item_nomiss), " unique, categorical values, so not shown.")
}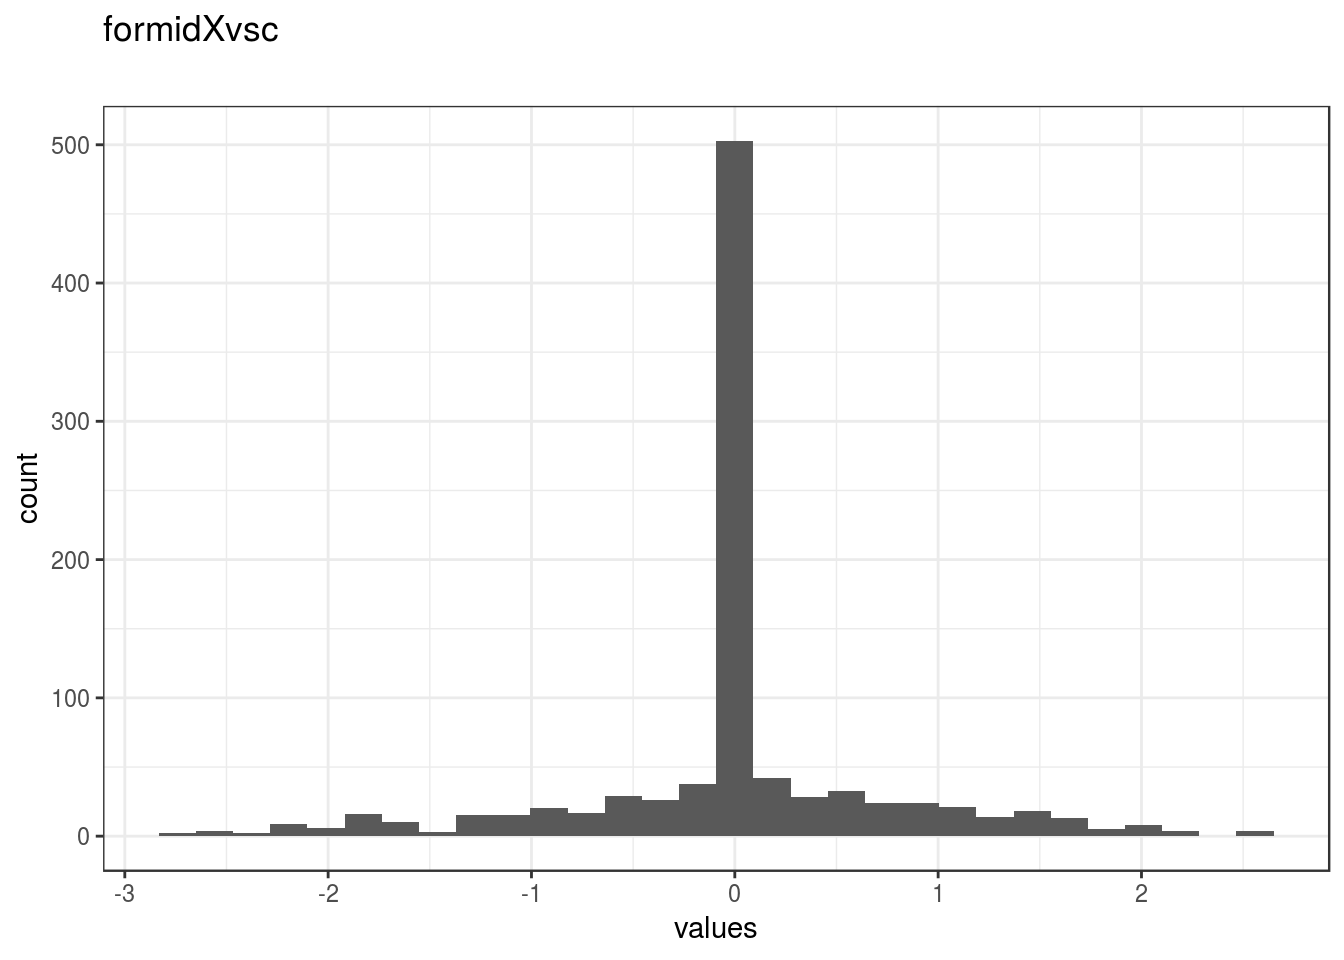
knitr::opts_chunk$set(fig.height = old_height)1053 missing values.
Summary statistics
attributes(item) <- item_attributes
df = data.frame(item, stringsAsFactors = FALSE)
names(df) = html_item_name
escaped_table(codebook_table(df))| name | data_type | missing | complete | n | mean | sd | p0 | p25 | p50 | p75 | p100 | hist | format.spss | display_width |
|---|---|---|---|---|---|---|---|---|---|---|---|---|---|---|
| formidXvsc | numeric | 1053 | 953 | 2006 | 0.0072 | 0.76 | -2.7 | 0 | 0 | 0.066 | 2.6 | ▁▁▁▂▇▁▁▁ | F8.2 | 12 |
if (show_missing_values) {
plot_labelled(missing_values, item_name, wrap_at)
}if (!is.null(item_info)) {
# don't show choices again, if they're basically same thing as value labels
if (!is.null(choices) && !is.null(item_info$choices) &&
all(names(na.omit(choices)) == item_info$choices) &&
all(na.omit(choices) == names(item_info$choices))) {
item_info$choices <- NULL
}
item_info$label_parsed <-
item_info$choice_list <- item_info$study_id <- item_info$id <- NULL
pander::pander(item_info)
}if (!is.null(choices) && length(choices) && length(choices) < 30) {
pander::pander(as.list(choices))
}criskXvsc
Distribution
show_missing_values <- FALSE
if (has_labels(item)) {
missing_values <- item[is.na(haven::zap_missing(item))]
attributes(missing_values) <- attributes(item)
if (!is.null(attributes(item)$labels)) {
attributes(missing_values)$labels <- attributes(missing_values)$labels[is.na(attributes(missing_values)$labels)]
attributes(item)$labels <- attributes(item)$labels[!is.na(attributes(item)$labels)]
}
if (is.double(item)) {
show_missing_values <- length(unique(haven::na_tag(missing_values))) > 1
item <- haven::zap_missing(item)
}
if (length(item_attributes$labels) == 0 && is.numeric(item)) {
item <- haven::zap_labels(item)
}
}
item_nomiss <- item[!is.na(item)]
# unnest mc_multiple and so on
if (
is.character(item_nomiss) &&
stringr::str_detect(item_nomiss, stringr::fixed(", ")) &&
(exists("type", item_info) &&
stringr::str_detect(item_info$type, pattern = stringr::fixed("multiple")))
) {
item_nomiss <- unlist(stringr::str_split(item_nomiss, pattern = stringr::fixed(", ")))
}
attributes(item_nomiss) <- attributes(item)
old_height <- knitr::opts_chunk$get("fig.height")
non_missing_choices <- item_attributes[["labels"]]
many_labels <- length(non_missing_choices) > 7
go_vertical <- !is.numeric(item_nomiss) || many_labels
if ( go_vertical ) {
# numeric items are plotted horizontally (because that's what usually expected)
# categorical items are plotted vertically because we can use the screen real estate better this way
if (is.null(choices) ||
dplyr::n_distinct(item_nomiss) > length(non_missing_choices)) {
non_missing_choices <- unique(item_nomiss)
names(non_missing_choices) <- non_missing_choices
}
choice_multiplier <- old_height/6.5
new_height <- 2 + choice_multiplier * length(non_missing_choices)
new_height <- ifelse(new_height > 20, 20, new_height)
new_height <- ifelse(new_height < 1, 1, new_height)
knitr::opts_chunk$set(fig.height = new_height)
}
wrap_at <- knitr::opts_chunk$get("fig.width") * 10# todo: if there are free-text choices mingled in with the pre-defined ones, don't show
# todo: show rare items if they are pre-defined
# todo: bin rare responses into "other category"
if (!length(item_nomiss)) {
cat("No non-missing values to show.")
} else if (is.numeric(item_nomiss) || dplyr::n_distinct(item_nomiss) < 20) {
plot_labelled(item_nomiss, item_name, wrap_at, go_vertical)
} else {
cat(dplyr::n_distinct(item_nomiss), " unique, categorical values, so not shown.")
}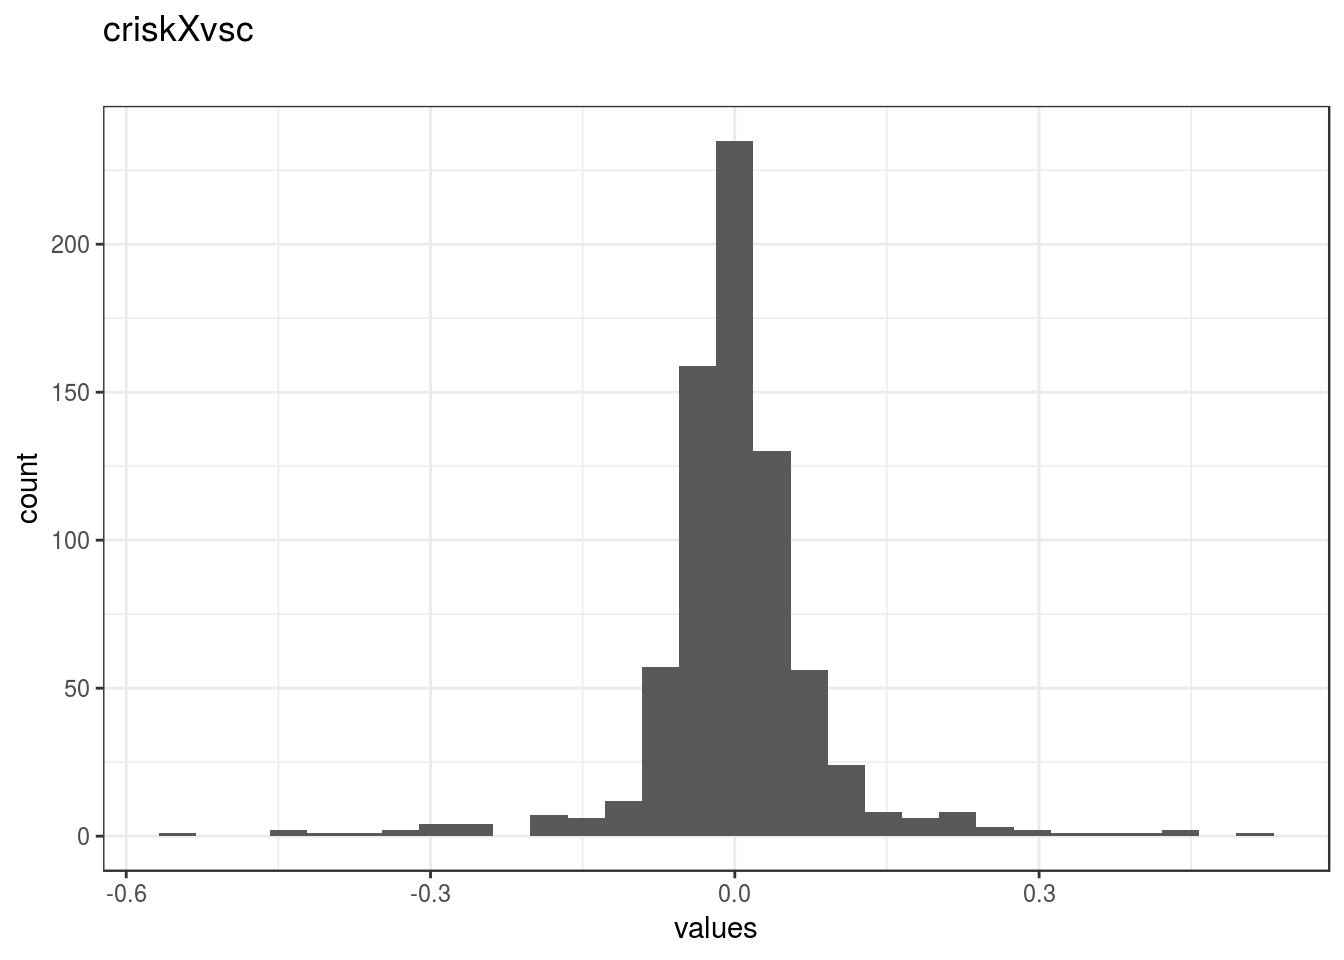
knitr::opts_chunk$set(fig.height = old_height)1272 missing values.
Summary statistics
attributes(item) <- item_attributes
df = data.frame(item, stringsAsFactors = FALSE)
names(df) = html_item_name
escaped_table(codebook_table(df))| name | data_type | missing | complete | n | mean | sd | p0 | p25 | p50 | p75 | p100 | hist | format.spss | display_width |
|---|---|---|---|---|---|---|---|---|---|---|---|---|---|---|
| criskXvsc | numeric | 1272 | 734 | 2006 | 0.0016 | 0.089 | -0.55 | -0.031 | 2e-05 | 0.031 | 0.52 | ▁▁▁▅▇▁▁▁ | F8.2 | 11 |
if (show_missing_values) {
plot_labelled(missing_values, item_name, wrap_at)
}if (!is.null(item_info)) {
# don't show choices again, if they're basically same thing as value labels
if (!is.null(choices) && !is.null(item_info$choices) &&
all(names(na.omit(choices)) == item_info$choices) &&
all(na.omit(choices) == names(item_info$choices))) {
item_info$choices <- NULL
}
item_info$label_parsed <-
item_info$choice_list <- item_info$study_id <- item_info$id <- NULL
pander::pander(item_info)
}if (!is.null(choices) && length(choices) && length(choices) < 30) {
pander::pander(as.list(choices))
}groupXincomeXformid
Distribution
show_missing_values <- FALSE
if (has_labels(item)) {
missing_values <- item[is.na(haven::zap_missing(item))]
attributes(missing_values) <- attributes(item)
if (!is.null(attributes(item)$labels)) {
attributes(missing_values)$labels <- attributes(missing_values)$labels[is.na(attributes(missing_values)$labels)]
attributes(item)$labels <- attributes(item)$labels[!is.na(attributes(item)$labels)]
}
if (is.double(item)) {
show_missing_values <- length(unique(haven::na_tag(missing_values))) > 1
item <- haven::zap_missing(item)
}
if (length(item_attributes$labels) == 0 && is.numeric(item)) {
item <- haven::zap_labels(item)
}
}
item_nomiss <- item[!is.na(item)]
# unnest mc_multiple and so on
if (
is.character(item_nomiss) &&
stringr::str_detect(item_nomiss, stringr::fixed(", ")) &&
(exists("type", item_info) &&
stringr::str_detect(item_info$type, pattern = stringr::fixed("multiple")))
) {
item_nomiss <- unlist(stringr::str_split(item_nomiss, pattern = stringr::fixed(", ")))
}
attributes(item_nomiss) <- attributes(item)
old_height <- knitr::opts_chunk$get("fig.height")
non_missing_choices <- item_attributes[["labels"]]
many_labels <- length(non_missing_choices) > 7
go_vertical <- !is.numeric(item_nomiss) || many_labels
if ( go_vertical ) {
# numeric items are plotted horizontally (because that's what usually expected)
# categorical items are plotted vertically because we can use the screen real estate better this way
if (is.null(choices) ||
dplyr::n_distinct(item_nomiss) > length(non_missing_choices)) {
non_missing_choices <- unique(item_nomiss)
names(non_missing_choices) <- non_missing_choices
}
choice_multiplier <- old_height/6.5
new_height <- 2 + choice_multiplier * length(non_missing_choices)
new_height <- ifelse(new_height > 20, 20, new_height)
new_height <- ifelse(new_height < 1, 1, new_height)
knitr::opts_chunk$set(fig.height = new_height)
}
wrap_at <- knitr::opts_chunk$get("fig.width") * 10# todo: if there are free-text choices mingled in with the pre-defined ones, don't show
# todo: show rare items if they are pre-defined
# todo: bin rare responses into "other category"
if (!length(item_nomiss)) {
cat("No non-missing values to show.")
} else if (is.numeric(item_nomiss) || dplyr::n_distinct(item_nomiss) < 20) {
plot_labelled(item_nomiss, item_name, wrap_at, go_vertical)
} else {
cat(dplyr::n_distinct(item_nomiss), " unique, categorical values, so not shown.")
}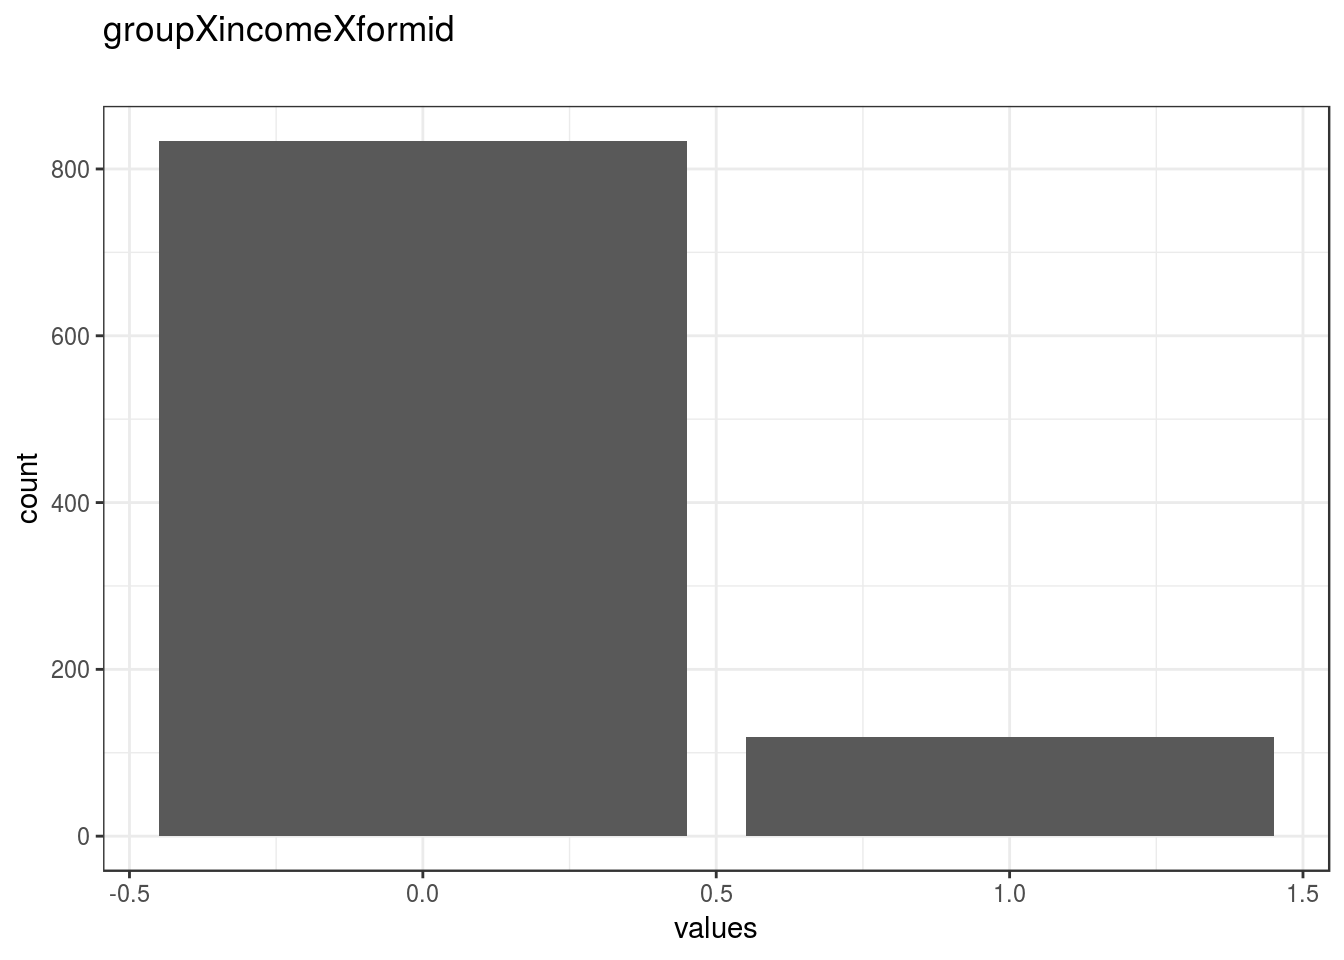
knitr::opts_chunk$set(fig.height = old_height)1053 missing values.
Summary statistics
attributes(item) <- item_attributes
df = data.frame(item, stringsAsFactors = FALSE)
names(df) = html_item_name
escaped_table(codebook_table(df))| name | data_type | missing | complete | n | mean | sd | p0 | p25 | p50 | p75 | p100 | hist | format.spss | display_width |
|---|---|---|---|---|---|---|---|---|---|---|---|---|---|---|
| groupXincomeXformid | numeric | 1053 | 953 | 2006 | 0.12 | 0.33 | 0 | 0 | 0 | 0 | 1 | ▇▁▁▁▁▁▁▁ | F8.2 | 21 |
if (show_missing_values) {
plot_labelled(missing_values, item_name, wrap_at)
}if (!is.null(item_info)) {
# don't show choices again, if they're basically same thing as value labels
if (!is.null(choices) && !is.null(item_info$choices) &&
all(names(na.omit(choices)) == item_info$choices) &&
all(na.omit(choices) == names(item_info$choices))) {
item_info$choices <- NULL
}
item_info$label_parsed <-
item_info$choice_list <- item_info$study_id <- item_info$id <- NULL
pander::pander(item_info)
}if (!is.null(choices) && length(choices) && length(choices) < 30) {
pander::pander(as.list(choices))
}groupXincomeXcrisk
Distribution
show_missing_values <- FALSE
if (has_labels(item)) {
missing_values <- item[is.na(haven::zap_missing(item))]
attributes(missing_values) <- attributes(item)
if (!is.null(attributes(item)$labels)) {
attributes(missing_values)$labels <- attributes(missing_values)$labels[is.na(attributes(missing_values)$labels)]
attributes(item)$labels <- attributes(item)$labels[!is.na(attributes(item)$labels)]
}
if (is.double(item)) {
show_missing_values <- length(unique(haven::na_tag(missing_values))) > 1
item <- haven::zap_missing(item)
}
if (length(item_attributes$labels) == 0 && is.numeric(item)) {
item <- haven::zap_labels(item)
}
}
item_nomiss <- item[!is.na(item)]
# unnest mc_multiple and so on
if (
is.character(item_nomiss) &&
stringr::str_detect(item_nomiss, stringr::fixed(", ")) &&
(exists("type", item_info) &&
stringr::str_detect(item_info$type, pattern = stringr::fixed("multiple")))
) {
item_nomiss <- unlist(stringr::str_split(item_nomiss, pattern = stringr::fixed(", ")))
}
attributes(item_nomiss) <- attributes(item)
old_height <- knitr::opts_chunk$get("fig.height")
non_missing_choices <- item_attributes[["labels"]]
many_labels <- length(non_missing_choices) > 7
go_vertical <- !is.numeric(item_nomiss) || many_labels
if ( go_vertical ) {
# numeric items are plotted horizontally (because that's what usually expected)
# categorical items are plotted vertically because we can use the screen real estate better this way
if (is.null(choices) ||
dplyr::n_distinct(item_nomiss) > length(non_missing_choices)) {
non_missing_choices <- unique(item_nomiss)
names(non_missing_choices) <- non_missing_choices
}
choice_multiplier <- old_height/6.5
new_height <- 2 + choice_multiplier * length(non_missing_choices)
new_height <- ifelse(new_height > 20, 20, new_height)
new_height <- ifelse(new_height < 1, 1, new_height)
knitr::opts_chunk$set(fig.height = new_height)
}
wrap_at <- knitr::opts_chunk$get("fig.width") * 10# todo: if there are free-text choices mingled in with the pre-defined ones, don't show
# todo: show rare items if they are pre-defined
# todo: bin rare responses into "other category"
if (!length(item_nomiss)) {
cat("No non-missing values to show.")
} else if (is.numeric(item_nomiss) || dplyr::n_distinct(item_nomiss) < 20) {
plot_labelled(item_nomiss, item_name, wrap_at, go_vertical)
} else {
cat(dplyr::n_distinct(item_nomiss), " unique, categorical values, so not shown.")
}
knitr::opts_chunk$set(fig.height = old_height)1111 missing values.
Summary statistics
attributes(item) <- item_attributes
df = data.frame(item, stringsAsFactors = FALSE)
names(df) = html_item_name
escaped_table(codebook_table(df))| name | data_type | missing | complete | n | mean | sd | p0 | p25 | p50 | p75 | p100 | hist | format.spss | display_width |
|---|---|---|---|---|---|---|---|---|---|---|---|---|---|---|
| groupXincomeXcrisk | numeric | 1111 | 895 | 2006 | -0.00059 | 0.034 | -0.043 | 0 | 0 | 0 | 0.21 | ▂▇▁▁▁▁▁▁ | F8.2 | 20 |
if (show_missing_values) {
plot_labelled(missing_values, item_name, wrap_at)
}if (!is.null(item_info)) {
# don't show choices again, if they're basically same thing as value labels
if (!is.null(choices) && !is.null(item_info$choices) &&
all(names(na.omit(choices)) == item_info$choices) &&
all(na.omit(choices) == names(item_info$choices))) {
item_info$choices <- NULL
}
item_info$label_parsed <-
item_info$choice_list <- item_info$study_id <- item_info$id <- NULL
pander::pander(item_info)
}if (!is.null(choices) && length(choices) && length(choices) < 30) {
pander::pander(as.list(choices))
}groupXincomeXvsc
Distribution
show_missing_values <- FALSE
if (has_labels(item)) {
missing_values <- item[is.na(haven::zap_missing(item))]
attributes(missing_values) <- attributes(item)
if (!is.null(attributes(item)$labels)) {
attributes(missing_values)$labels <- attributes(missing_values)$labels[is.na(attributes(missing_values)$labels)]
attributes(item)$labels <- attributes(item)$labels[!is.na(attributes(item)$labels)]
}
if (is.double(item)) {
show_missing_values <- length(unique(haven::na_tag(missing_values))) > 1
item <- haven::zap_missing(item)
}
if (length(item_attributes$labels) == 0 && is.numeric(item)) {
item <- haven::zap_labels(item)
}
}
item_nomiss <- item[!is.na(item)]
# unnest mc_multiple and so on
if (
is.character(item_nomiss) &&
stringr::str_detect(item_nomiss, stringr::fixed(", ")) &&
(exists("type", item_info) &&
stringr::str_detect(item_info$type, pattern = stringr::fixed("multiple")))
) {
item_nomiss <- unlist(stringr::str_split(item_nomiss, pattern = stringr::fixed(", ")))
}
attributes(item_nomiss) <- attributes(item)
old_height <- knitr::opts_chunk$get("fig.height")
non_missing_choices <- item_attributes[["labels"]]
many_labels <- length(non_missing_choices) > 7
go_vertical <- !is.numeric(item_nomiss) || many_labels
if ( go_vertical ) {
# numeric items are plotted horizontally (because that's what usually expected)
# categorical items are plotted vertically because we can use the screen real estate better this way
if (is.null(choices) ||
dplyr::n_distinct(item_nomiss) > length(non_missing_choices)) {
non_missing_choices <- unique(item_nomiss)
names(non_missing_choices) <- non_missing_choices
}
choice_multiplier <- old_height/6.5
new_height <- 2 + choice_multiplier * length(non_missing_choices)
new_height <- ifelse(new_height > 20, 20, new_height)
new_height <- ifelse(new_height < 1, 1, new_height)
knitr::opts_chunk$set(fig.height = new_height)
}
wrap_at <- knitr::opts_chunk$get("fig.width") * 10# todo: if there are free-text choices mingled in with the pre-defined ones, don't show
# todo: show rare items if they are pre-defined
# todo: bin rare responses into "other category"
if (!length(item_nomiss)) {
cat("No non-missing values to show.")
} else if (is.numeric(item_nomiss) || dplyr::n_distinct(item_nomiss) < 20) {
plot_labelled(item_nomiss, item_name, wrap_at, go_vertical)
} else {
cat(dplyr::n_distinct(item_nomiss), " unique, categorical values, so not shown.")
}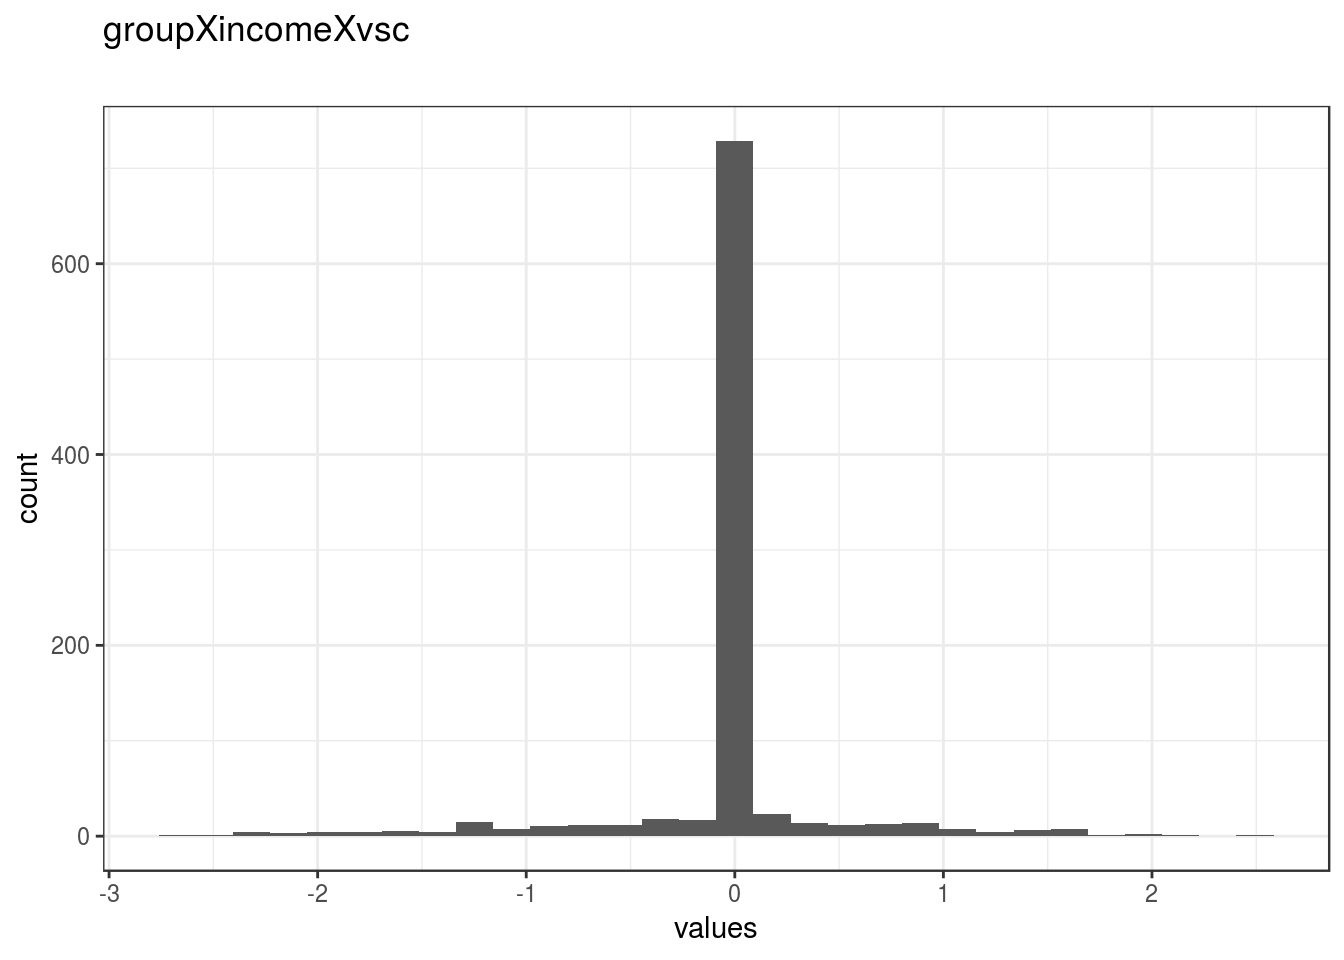
knitr::opts_chunk$set(fig.height = old_height)1053 missing values.
Summary statistics
attributes(item) <- item_attributes
df = data.frame(item, stringsAsFactors = FALSE)
names(df) = html_item_name
escaped_table(codebook_table(df))| name | data_type | missing | complete | n | mean | sd | p0 | p25 | p50 | p75 | p100 | hist | format.spss | display_width |
|---|---|---|---|---|---|---|---|---|---|---|---|---|---|---|
| groupXincomeXvsc | numeric | 1053 | 953 | 2006 | -0.029 | 0.5 | -2.67 | 0 | 0 | 0 | 2.5 | ▁▁▁▁▇▁▁▁ | F8.2 | 18 |
if (show_missing_values) {
plot_labelled(missing_values, item_name, wrap_at)
}if (!is.null(item_info)) {
# don't show choices again, if they're basically same thing as value labels
if (!is.null(choices) && !is.null(item_info$choices) &&
all(names(na.omit(choices)) == item_info$choices) &&
all(na.omit(choices) == names(item_info$choices))) {
item_info$choices <- NULL
}
item_info$label_parsed <-
item_info$choice_list <- item_info$study_id <- item_info$id <- NULL
pander::pander(item_info)
}if (!is.null(choices) && length(choices) && length(choices) < 30) {
pander::pander(as.list(choices))
}groupXformidXcrisk
Distribution
show_missing_values <- FALSE
if (has_labels(item)) {
missing_values <- item[is.na(haven::zap_missing(item))]
attributes(missing_values) <- attributes(item)
if (!is.null(attributes(item)$labels)) {
attributes(missing_values)$labels <- attributes(missing_values)$labels[is.na(attributes(missing_values)$labels)]
attributes(item)$labels <- attributes(item)$labels[!is.na(attributes(item)$labels)]
}
if (is.double(item)) {
show_missing_values <- length(unique(haven::na_tag(missing_values))) > 1
item <- haven::zap_missing(item)
}
if (length(item_attributes$labels) == 0 && is.numeric(item)) {
item <- haven::zap_labels(item)
}
}
item_nomiss <- item[!is.na(item)]
# unnest mc_multiple and so on
if (
is.character(item_nomiss) &&
stringr::str_detect(item_nomiss, stringr::fixed(", ")) &&
(exists("type", item_info) &&
stringr::str_detect(item_info$type, pattern = stringr::fixed("multiple")))
) {
item_nomiss <- unlist(stringr::str_split(item_nomiss, pattern = stringr::fixed(", ")))
}
attributes(item_nomiss) <- attributes(item)
old_height <- knitr::opts_chunk$get("fig.height")
non_missing_choices <- item_attributes[["labels"]]
many_labels <- length(non_missing_choices) > 7
go_vertical <- !is.numeric(item_nomiss) || many_labels
if ( go_vertical ) {
# numeric items are plotted horizontally (because that's what usually expected)
# categorical items are plotted vertically because we can use the screen real estate better this way
if (is.null(choices) ||
dplyr::n_distinct(item_nomiss) > length(non_missing_choices)) {
non_missing_choices <- unique(item_nomiss)
names(non_missing_choices) <- non_missing_choices
}
choice_multiplier <- old_height/6.5
new_height <- 2 + choice_multiplier * length(non_missing_choices)
new_height <- ifelse(new_height > 20, 20, new_height)
new_height <- ifelse(new_height < 1, 1, new_height)
knitr::opts_chunk$set(fig.height = new_height)
}
wrap_at <- knitr::opts_chunk$get("fig.width") * 10# todo: if there are free-text choices mingled in with the pre-defined ones, don't show
# todo: show rare items if they are pre-defined
# todo: bin rare responses into "other category"
if (!length(item_nomiss)) {
cat("No non-missing values to show.")
} else if (is.numeric(item_nomiss) || dplyr::n_distinct(item_nomiss) < 20) {
plot_labelled(item_nomiss, item_name, wrap_at, go_vertical)
} else {
cat(dplyr::n_distinct(item_nomiss), " unique, categorical values, so not shown.")
}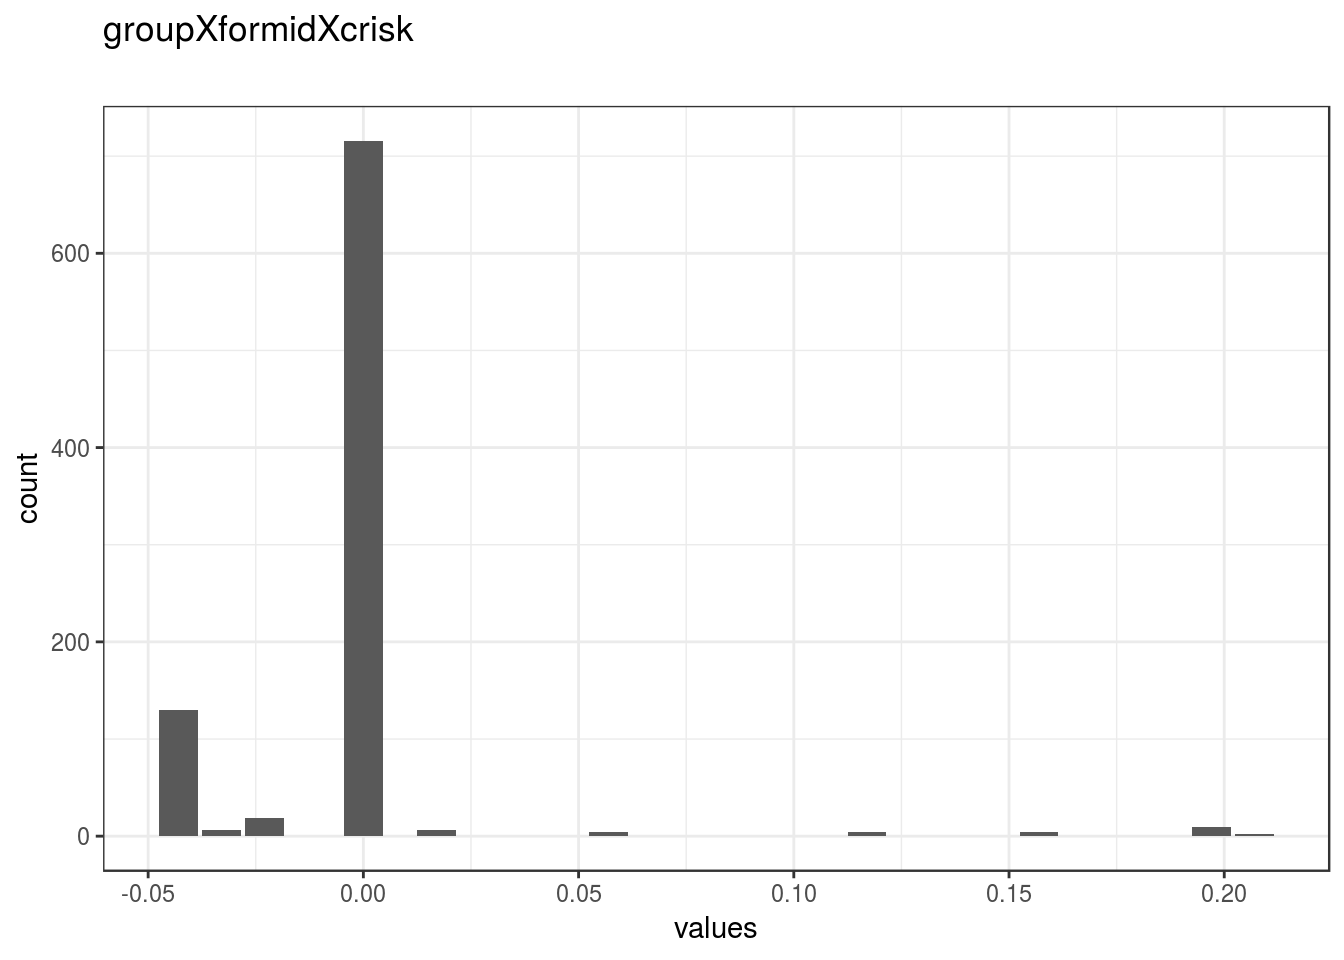
knitr::opts_chunk$set(fig.height = old_height)1106 missing values.
Summary statistics
attributes(item) <- item_attributes
df = data.frame(item, stringsAsFactors = FALSE)
names(df) = html_item_name
escaped_table(codebook_table(df))| name | data_type | missing | complete | n | mean | sd | p0 | p25 | p50 | p75 | p100 | hist | format.spss | display_width |
|---|---|---|---|---|---|---|---|---|---|---|---|---|---|---|
| groupXformidXcrisk | numeric | 1106 | 900 | 2006 | -0.0029 | 0.031 | -0.043 | 0 | 0 | 0 | 0.21 | ▂▇▁▁▁▁▁▁ | F8.2 | 20 |
if (show_missing_values) {
plot_labelled(missing_values, item_name, wrap_at)
}if (!is.null(item_info)) {
# don't show choices again, if they're basically same thing as value labels
if (!is.null(choices) && !is.null(item_info$choices) &&
all(names(na.omit(choices)) == item_info$choices) &&
all(na.omit(choices) == names(item_info$choices))) {
item_info$choices <- NULL
}
item_info$label_parsed <-
item_info$choice_list <- item_info$study_id <- item_info$id <- NULL
pander::pander(item_info)
}if (!is.null(choices) && length(choices) && length(choices) < 30) {
pander::pander(as.list(choices))
}groupXformidXvsc
Distribution
show_missing_values <- FALSE
if (has_labels(item)) {
missing_values <- item[is.na(haven::zap_missing(item))]
attributes(missing_values) <- attributes(item)
if (!is.null(attributes(item)$labels)) {
attributes(missing_values)$labels <- attributes(missing_values)$labels[is.na(attributes(missing_values)$labels)]
attributes(item)$labels <- attributes(item)$labels[!is.na(attributes(item)$labels)]
}
if (is.double(item)) {
show_missing_values <- length(unique(haven::na_tag(missing_values))) > 1
item <- haven::zap_missing(item)
}
if (length(item_attributes$labels) == 0 && is.numeric(item)) {
item <- haven::zap_labels(item)
}
}
item_nomiss <- item[!is.na(item)]
# unnest mc_multiple and so on
if (
is.character(item_nomiss) &&
stringr::str_detect(item_nomiss, stringr::fixed(", ")) &&
(exists("type", item_info) &&
stringr::str_detect(item_info$type, pattern = stringr::fixed("multiple")))
) {
item_nomiss <- unlist(stringr::str_split(item_nomiss, pattern = stringr::fixed(", ")))
}
attributes(item_nomiss) <- attributes(item)
old_height <- knitr::opts_chunk$get("fig.height")
non_missing_choices <- item_attributes[["labels"]]
many_labels <- length(non_missing_choices) > 7
go_vertical <- !is.numeric(item_nomiss) || many_labels
if ( go_vertical ) {
# numeric items are plotted horizontally (because that's what usually expected)
# categorical items are plotted vertically because we can use the screen real estate better this way
if (is.null(choices) ||
dplyr::n_distinct(item_nomiss) > length(non_missing_choices)) {
non_missing_choices <- unique(item_nomiss)
names(non_missing_choices) <- non_missing_choices
}
choice_multiplier <- old_height/6.5
new_height <- 2 + choice_multiplier * length(non_missing_choices)
new_height <- ifelse(new_height > 20, 20, new_height)
new_height <- ifelse(new_height < 1, 1, new_height)
knitr::opts_chunk$set(fig.height = new_height)
}
wrap_at <- knitr::opts_chunk$get("fig.width") * 10# todo: if there are free-text choices mingled in with the pre-defined ones, don't show
# todo: show rare items if they are pre-defined
# todo: bin rare responses into "other category"
if (!length(item_nomiss)) {
cat("No non-missing values to show.")
} else if (is.numeric(item_nomiss) || dplyr::n_distinct(item_nomiss) < 20) {
plot_labelled(item_nomiss, item_name, wrap_at, go_vertical)
} else {
cat(dplyr::n_distinct(item_nomiss), " unique, categorical values, so not shown.")
}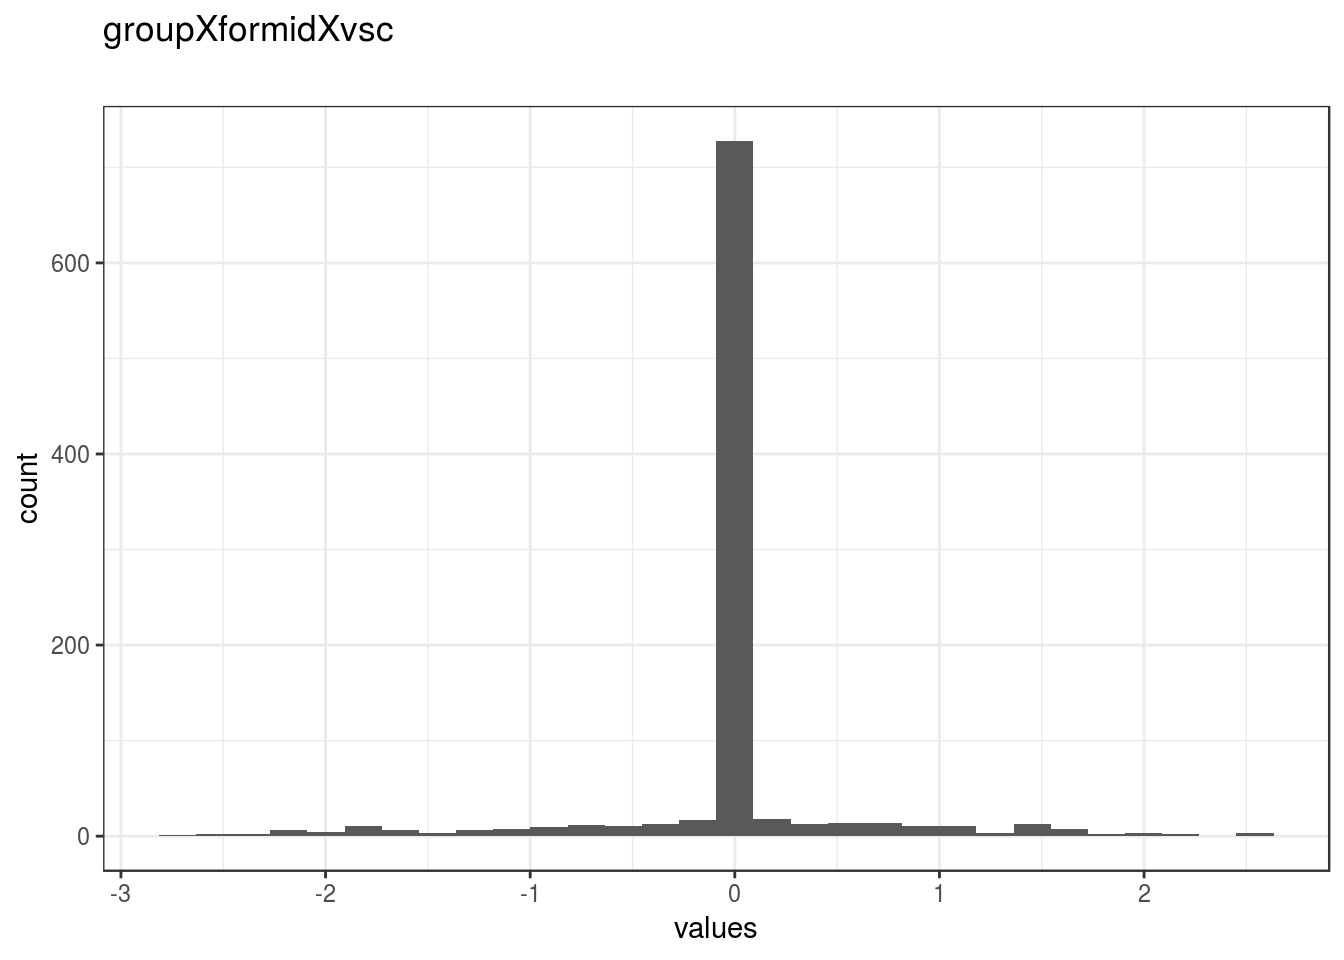
knitr::opts_chunk$set(fig.height = old_height)1053 missing values.
Summary statistics
attributes(item) <- item_attributes
df = data.frame(item, stringsAsFactors = FALSE)
names(df) = html_item_name
escaped_table(codebook_table(df))| name | data_type | missing | complete | n | mean | sd | p0 | p25 | p50 | p75 | p100 | hist | format.spss | display_width |
|---|---|---|---|---|---|---|---|---|---|---|---|---|---|---|
| groupXformidXvsc | numeric | 1053 | 953 | 2006 | -0.012 | 0.57 | -2.67 | 0 | 0 | 0 | 2.6 | ▁▁▁▁▇▁▁▁ | F8.2 | 18 |
if (show_missing_values) {
plot_labelled(missing_values, item_name, wrap_at)
}if (!is.null(item_info)) {
# don't show choices again, if they're basically same thing as value labels
if (!is.null(choices) && !is.null(item_info$choices) &&
all(names(na.omit(choices)) == item_info$choices) &&
all(na.omit(choices) == names(item_info$choices))) {
item_info$choices <- NULL
}
item_info$label_parsed <-
item_info$choice_list <- item_info$study_id <- item_info$id <- NULL
pander::pander(item_info)
}if (!is.null(choices) && length(choices) && length(choices) < 30) {
pander::pander(as.list(choices))
}groupXcriskXvsc
Distribution
show_missing_values <- FALSE
if (has_labels(item)) {
missing_values <- item[is.na(haven::zap_missing(item))]
attributes(missing_values) <- attributes(item)
if (!is.null(attributes(item)$labels)) {
attributes(missing_values)$labels <- attributes(missing_values)$labels[is.na(attributes(missing_values)$labels)]
attributes(item)$labels <- attributes(item)$labels[!is.na(attributes(item)$labels)]
}
if (is.double(item)) {
show_missing_values <- length(unique(haven::na_tag(missing_values))) > 1
item <- haven::zap_missing(item)
}
if (length(item_attributes$labels) == 0 && is.numeric(item)) {
item <- haven::zap_labels(item)
}
}
item_nomiss <- item[!is.na(item)]
# unnest mc_multiple and so on
if (
is.character(item_nomiss) &&
stringr::str_detect(item_nomiss, stringr::fixed(", ")) &&
(exists("type", item_info) &&
stringr::str_detect(item_info$type, pattern = stringr::fixed("multiple")))
) {
item_nomiss <- unlist(stringr::str_split(item_nomiss, pattern = stringr::fixed(", ")))
}
attributes(item_nomiss) <- attributes(item)
old_height <- knitr::opts_chunk$get("fig.height")
non_missing_choices <- item_attributes[["labels"]]
many_labels <- length(non_missing_choices) > 7
go_vertical <- !is.numeric(item_nomiss) || many_labels
if ( go_vertical ) {
# numeric items are plotted horizontally (because that's what usually expected)
# categorical items are plotted vertically because we can use the screen real estate better this way
if (is.null(choices) ||
dplyr::n_distinct(item_nomiss) > length(non_missing_choices)) {
non_missing_choices <- unique(item_nomiss)
names(non_missing_choices) <- non_missing_choices
}
choice_multiplier <- old_height/6.5
new_height <- 2 + choice_multiplier * length(non_missing_choices)
new_height <- ifelse(new_height > 20, 20, new_height)
new_height <- ifelse(new_height < 1, 1, new_height)
knitr::opts_chunk$set(fig.height = new_height)
}
wrap_at <- knitr::opts_chunk$get("fig.width") * 10# todo: if there are free-text choices mingled in with the pre-defined ones, don't show
# todo: show rare items if they are pre-defined
# todo: bin rare responses into "other category"
if (!length(item_nomiss)) {
cat("No non-missing values to show.")
} else if (is.numeric(item_nomiss) || dplyr::n_distinct(item_nomiss) < 20) {
plot_labelled(item_nomiss, item_name, wrap_at, go_vertical)
} else {
cat(dplyr::n_distinct(item_nomiss), " unique, categorical values, so not shown.")
}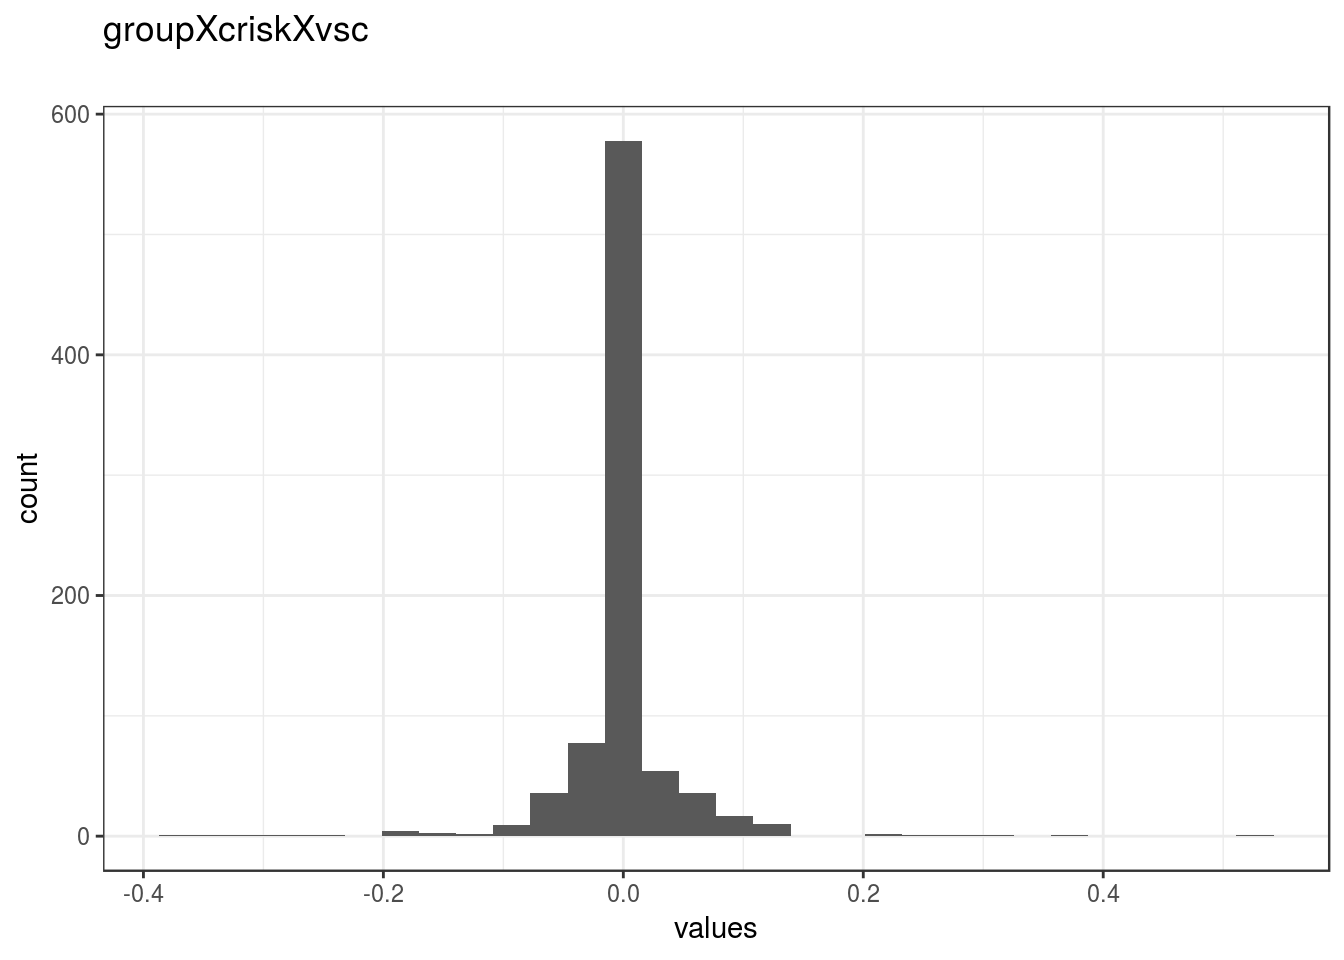
knitr::opts_chunk$set(fig.height = old_height)1168 missing values.
Summary statistics
attributes(item) <- item_attributes
df = data.frame(item, stringsAsFactors = FALSE)
names(df) = html_item_name
escaped_table(codebook_table(df))| name | data_type | missing | complete | n | mean | sd | p0 | p25 | p50 | p75 | p100 | hist | format.spss | display_width |
|---|---|---|---|---|---|---|---|---|---|---|---|---|---|---|
| groupXcriskXvsc | numeric | 1168 | 838 | 2006 | 0.00048 | 0.051 | -0.38 | 0 | 0 | 0 | 0.52 | ▁▁▁▇▁▁▁▁ | F8.2 | 17 |
if (show_missing_values) {
plot_labelled(missing_values, item_name, wrap_at)
}if (!is.null(item_info)) {
# don't show choices again, if they're basically same thing as value labels
if (!is.null(choices) && !is.null(item_info$choices) &&
all(names(na.omit(choices)) == item_info$choices) &&
all(na.omit(choices) == names(item_info$choices))) {
item_info$choices <- NULL
}
item_info$label_parsed <-
item_info$choice_list <- item_info$study_id <- item_info$id <- NULL
pander::pander(item_info)
}if (!is.null(choices) && length(choices) && length(choices) < 30) {
pander::pander(as.list(choices))
}incomeXformidXcrisk
Distribution
show_missing_values <- FALSE
if (has_labels(item)) {
missing_values <- item[is.na(haven::zap_missing(item))]
attributes(missing_values) <- attributes(item)
if (!is.null(attributes(item)$labels)) {
attributes(missing_values)$labels <- attributes(missing_values)$labels[is.na(attributes(missing_values)$labels)]
attributes(item)$labels <- attributes(item)$labels[!is.na(attributes(item)$labels)]
}
if (is.double(item)) {
show_missing_values <- length(unique(haven::na_tag(missing_values))) > 1
item <- haven::zap_missing(item)
}
if (length(item_attributes$labels) == 0 && is.numeric(item)) {
item <- haven::zap_labels(item)
}
}
item_nomiss <- item[!is.na(item)]
# unnest mc_multiple and so on
if (
is.character(item_nomiss) &&
stringr::str_detect(item_nomiss, stringr::fixed(", ")) &&
(exists("type", item_info) &&
stringr::str_detect(item_info$type, pattern = stringr::fixed("multiple")))
) {
item_nomiss <- unlist(stringr::str_split(item_nomiss, pattern = stringr::fixed(", ")))
}
attributes(item_nomiss) <- attributes(item)
old_height <- knitr::opts_chunk$get("fig.height")
non_missing_choices <- item_attributes[["labels"]]
many_labels <- length(non_missing_choices) > 7
go_vertical <- !is.numeric(item_nomiss) || many_labels
if ( go_vertical ) {
# numeric items are plotted horizontally (because that's what usually expected)
# categorical items are plotted vertically because we can use the screen real estate better this way
if (is.null(choices) ||
dplyr::n_distinct(item_nomiss) > length(non_missing_choices)) {
non_missing_choices <- unique(item_nomiss)
names(non_missing_choices) <- non_missing_choices
}
choice_multiplier <- old_height/6.5
new_height <- 2 + choice_multiplier * length(non_missing_choices)
new_height <- ifelse(new_height > 20, 20, new_height)
new_height <- ifelse(new_height < 1, 1, new_height)
knitr::opts_chunk$set(fig.height = new_height)
}
wrap_at <- knitr::opts_chunk$get("fig.width") * 10# todo: if there are free-text choices mingled in with the pre-defined ones, don't show
# todo: show rare items if they are pre-defined
# todo: bin rare responses into "other category"
if (!length(item_nomiss)) {
cat("No non-missing values to show.")
} else if (is.numeric(item_nomiss) || dplyr::n_distinct(item_nomiss) < 20) {
plot_labelled(item_nomiss, item_name, wrap_at, go_vertical)
} else {
cat(dplyr::n_distinct(item_nomiss), " unique, categorical values, so not shown.")
}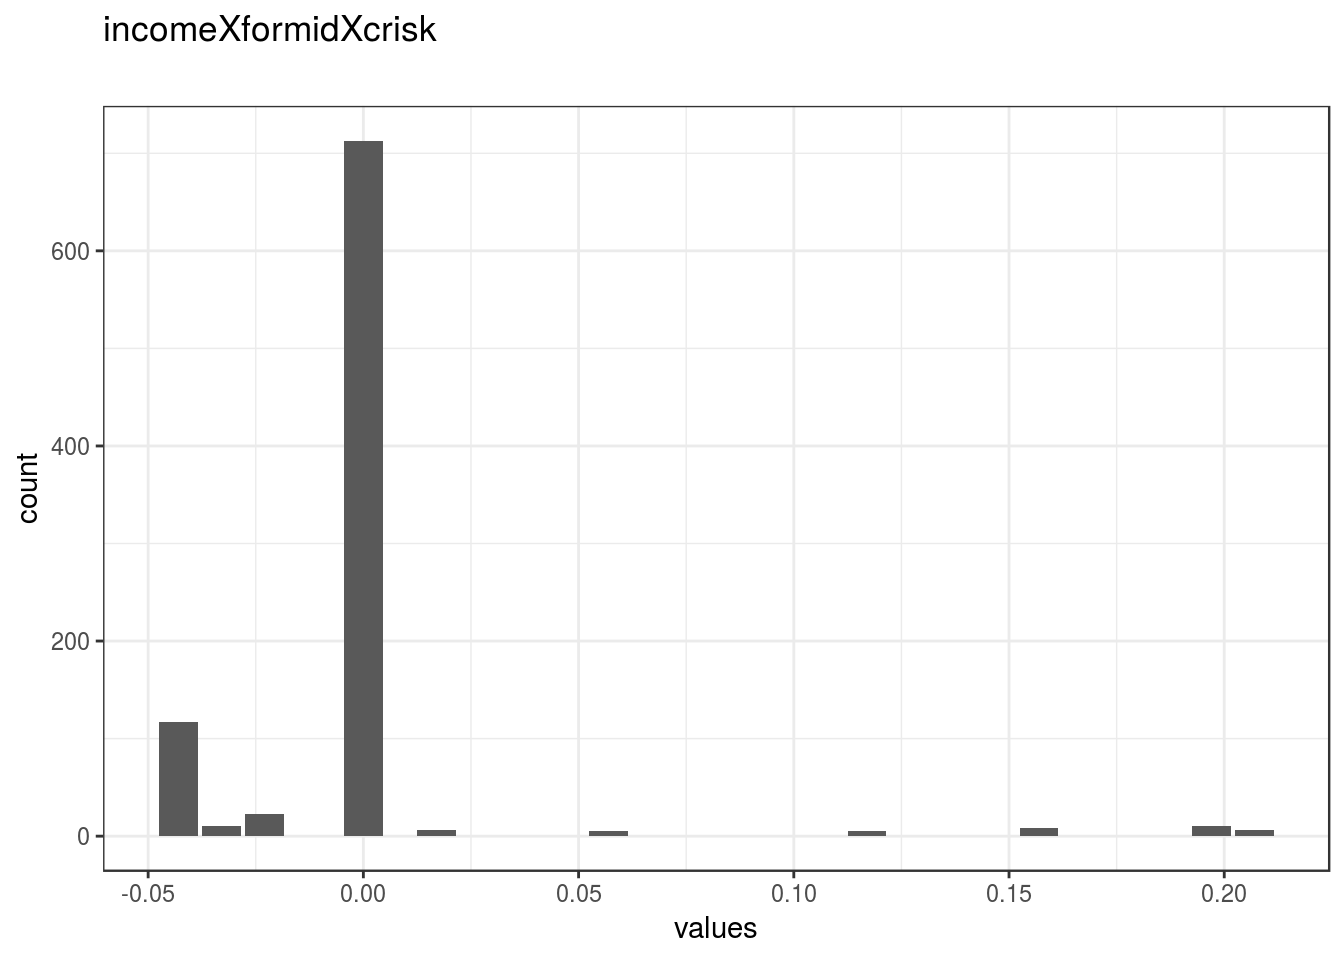
knitr::opts_chunk$set(fig.height = old_height)1103 missing values.
Summary statistics
attributes(item) <- item_attributes
df = data.frame(item, stringsAsFactors = FALSE)
names(df) = html_item_name
escaped_table(codebook_table(df))| name | data_type | missing | complete | n | mean | sd | p0 | p25 | p50 | p75 | p100 | hist | format.spss | display_width |
|---|---|---|---|---|---|---|---|---|---|---|---|---|---|---|
| incomeXformidXcrisk | numeric | 1103 | 903 | 2006 | -5e-04 | 0.036 | -0.043 | 0 | 0 | 0 | 0.21 | ▂▇▁▁▁▁▁▁ | F8.2 | 21 |
if (show_missing_values) {
plot_labelled(missing_values, item_name, wrap_at)
}if (!is.null(item_info)) {
# don't show choices again, if they're basically same thing as value labels
if (!is.null(choices) && !is.null(item_info$choices) &&
all(names(na.omit(choices)) == item_info$choices) &&
all(na.omit(choices) == names(item_info$choices))) {
item_info$choices <- NULL
}
item_info$label_parsed <-
item_info$choice_list <- item_info$study_id <- item_info$id <- NULL
pander::pander(item_info)
}if (!is.null(choices) && length(choices) && length(choices) < 30) {
pander::pander(as.list(choices))
}incomeXformidXvsc
Distribution
show_missing_values <- FALSE
if (has_labels(item)) {
missing_values <- item[is.na(haven::zap_missing(item))]
attributes(missing_values) <- attributes(item)
if (!is.null(attributes(item)$labels)) {
attributes(missing_values)$labels <- attributes(missing_values)$labels[is.na(attributes(missing_values)$labels)]
attributes(item)$labels <- attributes(item)$labels[!is.na(attributes(item)$labels)]
}
if (is.double(item)) {
show_missing_values <- length(unique(haven::na_tag(missing_values))) > 1
item <- haven::zap_missing(item)
}
if (length(item_attributes$labels) == 0 && is.numeric(item)) {
item <- haven::zap_labels(item)
}
}
item_nomiss <- item[!is.na(item)]
# unnest mc_multiple and so on
if (
is.character(item_nomiss) &&
stringr::str_detect(item_nomiss, stringr::fixed(", ")) &&
(exists("type", item_info) &&
stringr::str_detect(item_info$type, pattern = stringr::fixed("multiple")))
) {
item_nomiss <- unlist(stringr::str_split(item_nomiss, pattern = stringr::fixed(", ")))
}
attributes(item_nomiss) <- attributes(item)
old_height <- knitr::opts_chunk$get("fig.height")
non_missing_choices <- item_attributes[["labels"]]
many_labels <- length(non_missing_choices) > 7
go_vertical <- !is.numeric(item_nomiss) || many_labels
if ( go_vertical ) {
# numeric items are plotted horizontally (because that's what usually expected)
# categorical items are plotted vertically because we can use the screen real estate better this way
if (is.null(choices) ||
dplyr::n_distinct(item_nomiss) > length(non_missing_choices)) {
non_missing_choices <- unique(item_nomiss)
names(non_missing_choices) <- non_missing_choices
}
choice_multiplier <- old_height/6.5
new_height <- 2 + choice_multiplier * length(non_missing_choices)
new_height <- ifelse(new_height > 20, 20, new_height)
new_height <- ifelse(new_height < 1, 1, new_height)
knitr::opts_chunk$set(fig.height = new_height)
}
wrap_at <- knitr::opts_chunk$get("fig.width") * 10# todo: if there are free-text choices mingled in with the pre-defined ones, don't show
# todo: show rare items if they are pre-defined
# todo: bin rare responses into "other category"
if (!length(item_nomiss)) {
cat("No non-missing values to show.")
} else if (is.numeric(item_nomiss) || dplyr::n_distinct(item_nomiss) < 20) {
plot_labelled(item_nomiss, item_name, wrap_at, go_vertical)
} else {
cat(dplyr::n_distinct(item_nomiss), " unique, categorical values, so not shown.")
}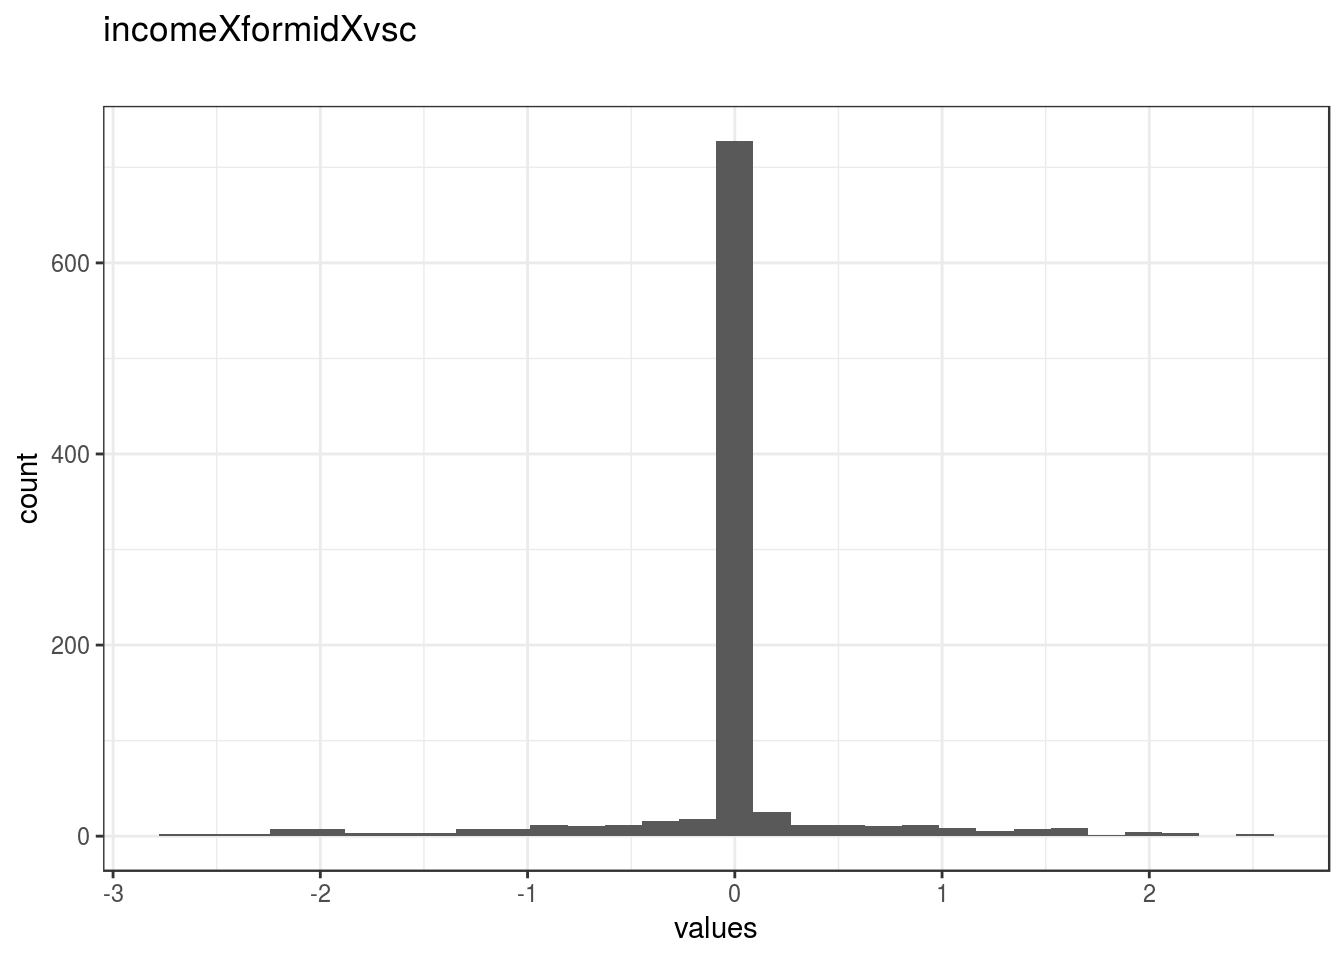
knitr::opts_chunk$set(fig.height = old_height)1053 missing values.
Summary statistics
attributes(item) <- item_attributes
df = data.frame(item, stringsAsFactors = FALSE)
names(df) = html_item_name
escaped_table(codebook_table(df))| name | data_type | missing | complete | n | mean | sd | p0 | p25 | p50 | p75 | p100 | hist | format.spss | display_width |
|---|---|---|---|---|---|---|---|---|---|---|---|---|---|---|
| incomeXformidXvsc | numeric | 1053 | 953 | 2006 | -0.013 | 0.55 | -2.7 | 0 | 0 | 0 | 2.5 | ▁▁▁▁▇▁▁▁ | F8.2 | 19 |
if (show_missing_values) {
plot_labelled(missing_values, item_name, wrap_at)
}if (!is.null(item_info)) {
# don't show choices again, if they're basically same thing as value labels
if (!is.null(choices) && !is.null(item_info$choices) &&
all(names(na.omit(choices)) == item_info$choices) &&
all(na.omit(choices) == names(item_info$choices))) {
item_info$choices <- NULL
}
item_info$label_parsed <-
item_info$choice_list <- item_info$study_id <- item_info$id <- NULL
pander::pander(item_info)
}if (!is.null(choices) && length(choices) && length(choices) < 30) {
pander::pander(as.list(choices))
}incomeXcriskXvsc
Distribution
show_missing_values <- FALSE
if (has_labels(item)) {
missing_values <- item[is.na(haven::zap_missing(item))]
attributes(missing_values) <- attributes(item)
if (!is.null(attributes(item)$labels)) {
attributes(missing_values)$labels <- attributes(missing_values)$labels[is.na(attributes(missing_values)$labels)]
attributes(item)$labels <- attributes(item)$labels[!is.na(attributes(item)$labels)]
}
if (is.double(item)) {
show_missing_values <- length(unique(haven::na_tag(missing_values))) > 1
item <- haven::zap_missing(item)
}
if (length(item_attributes$labels) == 0 && is.numeric(item)) {
item <- haven::zap_labels(item)
}
}
item_nomiss <- item[!is.na(item)]
# unnest mc_multiple and so on
if (
is.character(item_nomiss) &&
stringr::str_detect(item_nomiss, stringr::fixed(", ")) &&
(exists("type", item_info) &&
stringr::str_detect(item_info$type, pattern = stringr::fixed("multiple")))
) {
item_nomiss <- unlist(stringr::str_split(item_nomiss, pattern = stringr::fixed(", ")))
}
attributes(item_nomiss) <- attributes(item)
old_height <- knitr::opts_chunk$get("fig.height")
non_missing_choices <- item_attributes[["labels"]]
many_labels <- length(non_missing_choices) > 7
go_vertical <- !is.numeric(item_nomiss) || many_labels
if ( go_vertical ) {
# numeric items are plotted horizontally (because that's what usually expected)
# categorical items are plotted vertically because we can use the screen real estate better this way
if (is.null(choices) ||
dplyr::n_distinct(item_nomiss) > length(non_missing_choices)) {
non_missing_choices <- unique(item_nomiss)
names(non_missing_choices) <- non_missing_choices
}
choice_multiplier <- old_height/6.5
new_height <- 2 + choice_multiplier * length(non_missing_choices)
new_height <- ifelse(new_height > 20, 20, new_height)
new_height <- ifelse(new_height < 1, 1, new_height)
knitr::opts_chunk$set(fig.height = new_height)
}
wrap_at <- knitr::opts_chunk$get("fig.width") * 10# todo: if there are free-text choices mingled in with the pre-defined ones, don't show
# todo: show rare items if they are pre-defined
# todo: bin rare responses into "other category"
if (!length(item_nomiss)) {
cat("No non-missing values to show.")
} else if (is.numeric(item_nomiss) || dplyr::n_distinct(item_nomiss) < 20) {
plot_labelled(item_nomiss, item_name, wrap_at, go_vertical)
} else {
cat(dplyr::n_distinct(item_nomiss), " unique, categorical values, so not shown.")
}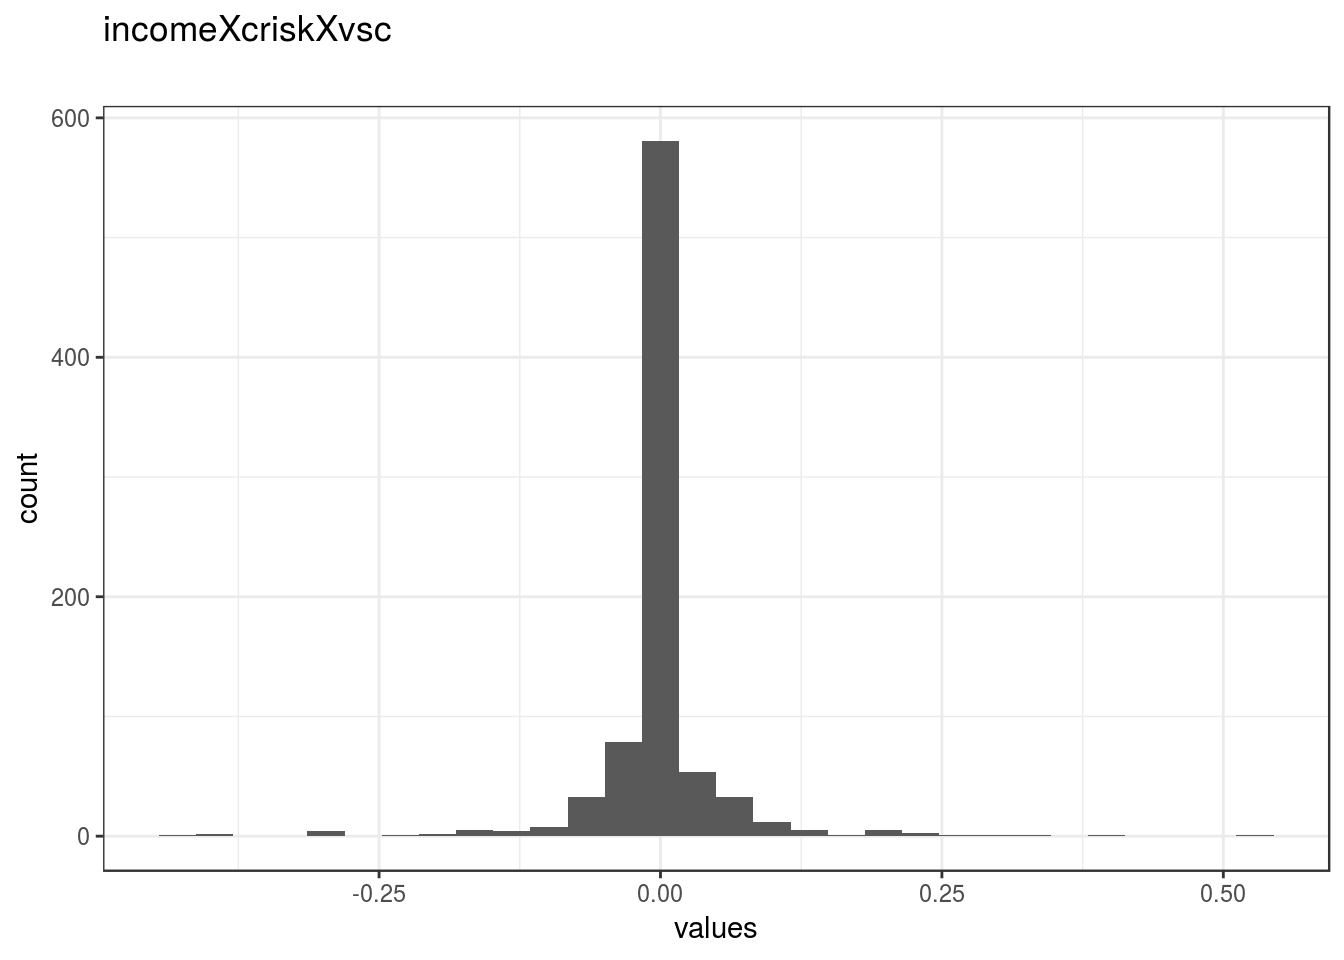
knitr::opts_chunk$set(fig.height = old_height)1168 missing values.
Summary statistics
attributes(item) <- item_attributes
df = data.frame(item, stringsAsFactors = FALSE)
names(df) = html_item_name
escaped_table(codebook_table(df))| name | data_type | missing | complete | n | mean | sd | p0 | p25 | p50 | p75 | p100 | hist | format.spss | display_width |
|---|---|---|---|---|---|---|---|---|---|---|---|---|---|---|
| incomeXcriskXvsc | numeric | 1168 | 838 | 2006 | -0.00056 | 0.059 | -0.44 | 0 | 0 | 0 | 0.52 | ▁▁▁▇▁▁▁▁ | F8.2 | 18 |
if (show_missing_values) {
plot_labelled(missing_values, item_name, wrap_at)
}if (!is.null(item_info)) {
# don't show choices again, if they're basically same thing as value labels
if (!is.null(choices) && !is.null(item_info$choices) &&
all(names(na.omit(choices)) == item_info$choices) &&
all(na.omit(choices) == names(item_info$choices))) {
item_info$choices <- NULL
}
item_info$label_parsed <-
item_info$choice_list <- item_info$study_id <- item_info$id <- NULL
pander::pander(item_info)
}if (!is.null(choices) && length(choices) && length(choices) < 30) {
pander::pander(as.list(choices))
}formidXcriskXvsc
Distribution
show_missing_values <- FALSE
if (has_labels(item)) {
missing_values <- item[is.na(haven::zap_missing(item))]
attributes(missing_values) <- attributes(item)
if (!is.null(attributes(item)$labels)) {
attributes(missing_values)$labels <- attributes(missing_values)$labels[is.na(attributes(missing_values)$labels)]
attributes(item)$labels <- attributes(item)$labels[!is.na(attributes(item)$labels)]
}
if (is.double(item)) {
show_missing_values <- length(unique(haven::na_tag(missing_values))) > 1
item <- haven::zap_missing(item)
}
if (length(item_attributes$labels) == 0 && is.numeric(item)) {
item <- haven::zap_labels(item)
}
}
item_nomiss <- item[!is.na(item)]
# unnest mc_multiple and so on
if (
is.character(item_nomiss) &&
stringr::str_detect(item_nomiss, stringr::fixed(", ")) &&
(exists("type", item_info) &&
stringr::str_detect(item_info$type, pattern = stringr::fixed("multiple")))
) {
item_nomiss <- unlist(stringr::str_split(item_nomiss, pattern = stringr::fixed(", ")))
}
attributes(item_nomiss) <- attributes(item)
old_height <- knitr::opts_chunk$get("fig.height")
non_missing_choices <- item_attributes[["labels"]]
many_labels <- length(non_missing_choices) > 7
go_vertical <- !is.numeric(item_nomiss) || many_labels
if ( go_vertical ) {
# numeric items are plotted horizontally (because that's what usually expected)
# categorical items are plotted vertically because we can use the screen real estate better this way
if (is.null(choices) ||
dplyr::n_distinct(item_nomiss) > length(non_missing_choices)) {
non_missing_choices <- unique(item_nomiss)
names(non_missing_choices) <- non_missing_choices
}
choice_multiplier <- old_height/6.5
new_height <- 2 + choice_multiplier * length(non_missing_choices)
new_height <- ifelse(new_height > 20, 20, new_height)
new_height <- ifelse(new_height < 1, 1, new_height)
knitr::opts_chunk$set(fig.height = new_height)
}
wrap_at <- knitr::opts_chunk$get("fig.width") * 10# todo: if there are free-text choices mingled in with the pre-defined ones, don't show
# todo: show rare items if they are pre-defined
# todo: bin rare responses into "other category"
if (!length(item_nomiss)) {
cat("No non-missing values to show.")
} else if (is.numeric(item_nomiss) || dplyr::n_distinct(item_nomiss) < 20) {
plot_labelled(item_nomiss, item_name, wrap_at, go_vertical)
} else {
cat(dplyr::n_distinct(item_nomiss), " unique, categorical values, so not shown.")
}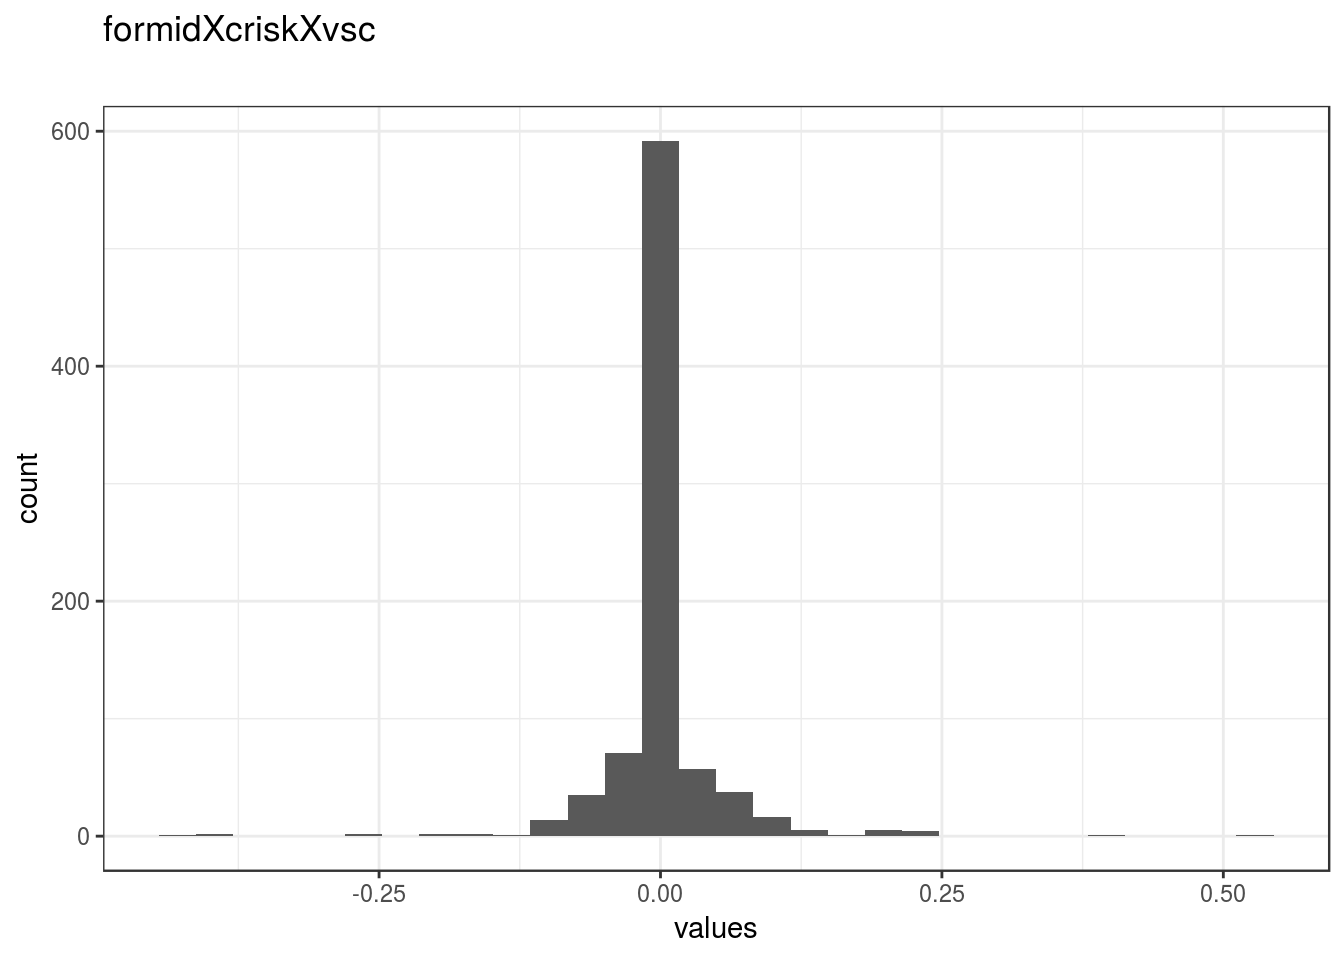
knitr::opts_chunk$set(fig.height = old_height)1156 missing values.
Summary statistics
attributes(item) <- item_attributes
df = data.frame(item, stringsAsFactors = FALSE)
names(df) = html_item_name
escaped_table(codebook_table(df))| name | data_type | missing | complete | n | mean | sd | p0 | p25 | p50 | p75 | p100 | hist | format.spss | display_width |
|---|---|---|---|---|---|---|---|---|---|---|---|---|---|---|
| formidXcriskXvsc | numeric | 1156 | 850 | 2006 | 0.0011 | 0.053 | -0.44 | 0 | 0 | 0 | 0.52 | ▁▁▁▇▁▁▁▁ | F8.2 | 18 |
if (show_missing_values) {
plot_labelled(missing_values, item_name, wrap_at)
}if (!is.null(item_info)) {
# don't show choices again, if they're basically same thing as value labels
if (!is.null(choices) && !is.null(item_info$choices) &&
all(names(na.omit(choices)) == item_info$choices) &&
all(na.omit(choices) == names(item_info$choices))) {
item_info$choices <- NULL
}
item_info$label_parsed <-
item_info$choice_list <- item_info$study_id <- item_info$id <- NULL
pander::pander(item_info)
}if (!is.null(choices) && length(choices) && length(choices) < 30) {
pander::pander(as.list(choices))
}groupXincomeXformidXcrisk
Distribution
show_missing_values <- FALSE
if (has_labels(item)) {
missing_values <- item[is.na(haven::zap_missing(item))]
attributes(missing_values) <- attributes(item)
if (!is.null(attributes(item)$labels)) {
attributes(missing_values)$labels <- attributes(missing_values)$labels[is.na(attributes(missing_values)$labels)]
attributes(item)$labels <- attributes(item)$labels[!is.na(attributes(item)$labels)]
}
if (is.double(item)) {
show_missing_values <- length(unique(haven::na_tag(missing_values))) > 1
item <- haven::zap_missing(item)
}
if (length(item_attributes$labels) == 0 && is.numeric(item)) {
item <- haven::zap_labels(item)
}
}
item_nomiss <- item[!is.na(item)]
# unnest mc_multiple and so on
if (
is.character(item_nomiss) &&
stringr::str_detect(item_nomiss, stringr::fixed(", ")) &&
(exists("type", item_info) &&
stringr::str_detect(item_info$type, pattern = stringr::fixed("multiple")))
) {
item_nomiss <- unlist(stringr::str_split(item_nomiss, pattern = stringr::fixed(", ")))
}
attributes(item_nomiss) <- attributes(item)
old_height <- knitr::opts_chunk$get("fig.height")
non_missing_choices <- item_attributes[["labels"]]
many_labels <- length(non_missing_choices) > 7
go_vertical <- !is.numeric(item_nomiss) || many_labels
if ( go_vertical ) {
# numeric items are plotted horizontally (because that's what usually expected)
# categorical items are plotted vertically because we can use the screen real estate better this way
if (is.null(choices) ||
dplyr::n_distinct(item_nomiss) > length(non_missing_choices)) {
non_missing_choices <- unique(item_nomiss)
names(non_missing_choices) <- non_missing_choices
}
choice_multiplier <- old_height/6.5
new_height <- 2 + choice_multiplier * length(non_missing_choices)
new_height <- ifelse(new_height > 20, 20, new_height)
new_height <- ifelse(new_height < 1, 1, new_height)
knitr::opts_chunk$set(fig.height = new_height)
}
wrap_at <- knitr::opts_chunk$get("fig.width") * 10# todo: if there are free-text choices mingled in with the pre-defined ones, don't show
# todo: show rare items if they are pre-defined
# todo: bin rare responses into "other category"
if (!length(item_nomiss)) {
cat("No non-missing values to show.")
} else if (is.numeric(item_nomiss) || dplyr::n_distinct(item_nomiss) < 20) {
plot_labelled(item_nomiss, item_name, wrap_at, go_vertical)
} else {
cat(dplyr::n_distinct(item_nomiss), " unique, categorical values, so not shown.")
}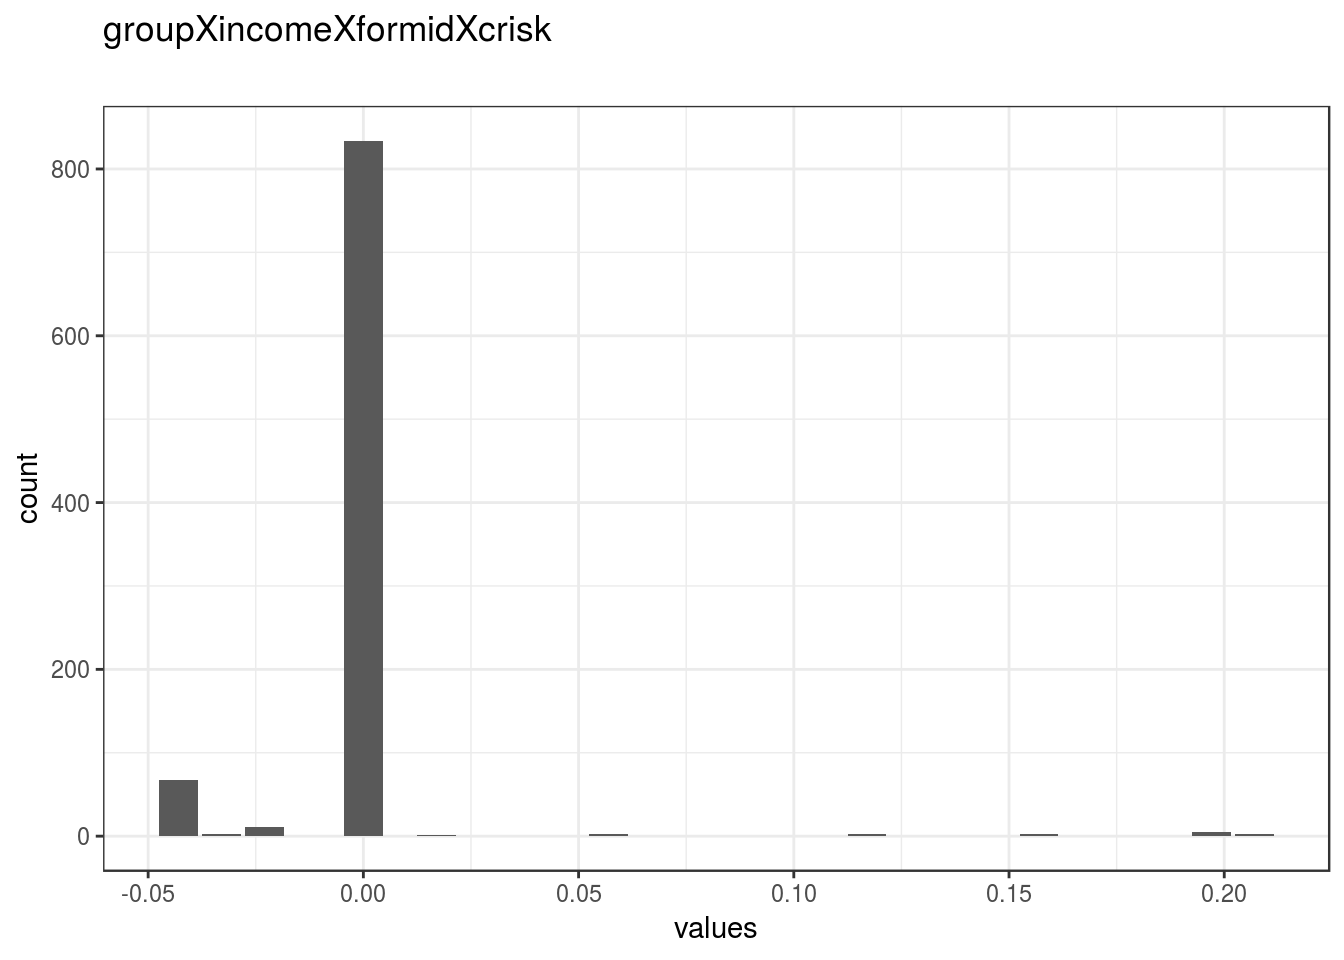
knitr::opts_chunk$set(fig.height = old_height)1077 missing values.
Summary statistics
attributes(item) <- item_attributes
df = data.frame(item, stringsAsFactors = FALSE)
names(df) = html_item_name
escaped_table(codebook_table(df))| name | data_type | missing | complete | n | mean | sd | p0 | p25 | p50 | p75 | p100 | hist | format.spss | display_width |
|---|---|---|---|---|---|---|---|---|---|---|---|---|---|---|
| groupXincomeXformidXcrisk | numeric | 1077 | 929 | 2006 | -0.0011 | 0.023 | -0.043 | 0 | 0 | 0 | 0.21 | ▁▇▁▁▁▁▁▁ | F8.2 | 27 |
if (show_missing_values) {
plot_labelled(missing_values, item_name, wrap_at)
}if (!is.null(item_info)) {
# don't show choices again, if they're basically same thing as value labels
if (!is.null(choices) && !is.null(item_info$choices) &&
all(names(na.omit(choices)) == item_info$choices) &&
all(na.omit(choices) == names(item_info$choices))) {
item_info$choices <- NULL
}
item_info$label_parsed <-
item_info$choice_list <- item_info$study_id <- item_info$id <- NULL
pander::pander(item_info)
}if (!is.null(choices) && length(choices) && length(choices) < 30) {
pander::pander(as.list(choices))
}groupXincomeXcriskXvsc
Distribution
show_missing_values <- FALSE
if (has_labels(item)) {
missing_values <- item[is.na(haven::zap_missing(item))]
attributes(missing_values) <- attributes(item)
if (!is.null(attributes(item)$labels)) {
attributes(missing_values)$labels <- attributes(missing_values)$labels[is.na(attributes(missing_values)$labels)]
attributes(item)$labels <- attributes(item)$labels[!is.na(attributes(item)$labels)]
}
if (is.double(item)) {
show_missing_values <- length(unique(haven::na_tag(missing_values))) > 1
item <- haven::zap_missing(item)
}
if (length(item_attributes$labels) == 0 && is.numeric(item)) {
item <- haven::zap_labels(item)
}
}
item_nomiss <- item[!is.na(item)]
# unnest mc_multiple and so on
if (
is.character(item_nomiss) &&
stringr::str_detect(item_nomiss, stringr::fixed(", ")) &&
(exists("type", item_info) &&
stringr::str_detect(item_info$type, pattern = stringr::fixed("multiple")))
) {
item_nomiss <- unlist(stringr::str_split(item_nomiss, pattern = stringr::fixed(", ")))
}
attributes(item_nomiss) <- attributes(item)
old_height <- knitr::opts_chunk$get("fig.height")
non_missing_choices <- item_attributes[["labels"]]
many_labels <- length(non_missing_choices) > 7
go_vertical <- !is.numeric(item_nomiss) || many_labels
if ( go_vertical ) {
# numeric items are plotted horizontally (because that's what usually expected)
# categorical items are plotted vertically because we can use the screen real estate better this way
if (is.null(choices) ||
dplyr::n_distinct(item_nomiss) > length(non_missing_choices)) {
non_missing_choices <- unique(item_nomiss)
names(non_missing_choices) <- non_missing_choices
}
choice_multiplier <- old_height/6.5
new_height <- 2 + choice_multiplier * length(non_missing_choices)
new_height <- ifelse(new_height > 20, 20, new_height)
new_height <- ifelse(new_height < 1, 1, new_height)
knitr::opts_chunk$set(fig.height = new_height)
}
wrap_at <- knitr::opts_chunk$get("fig.width") * 10# todo: if there are free-text choices mingled in with the pre-defined ones, don't show
# todo: show rare items if they are pre-defined
# todo: bin rare responses into "other category"
if (!length(item_nomiss)) {
cat("No non-missing values to show.")
} else if (is.numeric(item_nomiss) || dplyr::n_distinct(item_nomiss) < 20) {
plot_labelled(item_nomiss, item_name, wrap_at, go_vertical)
} else {
cat(dplyr::n_distinct(item_nomiss), " unique, categorical values, so not shown.")
}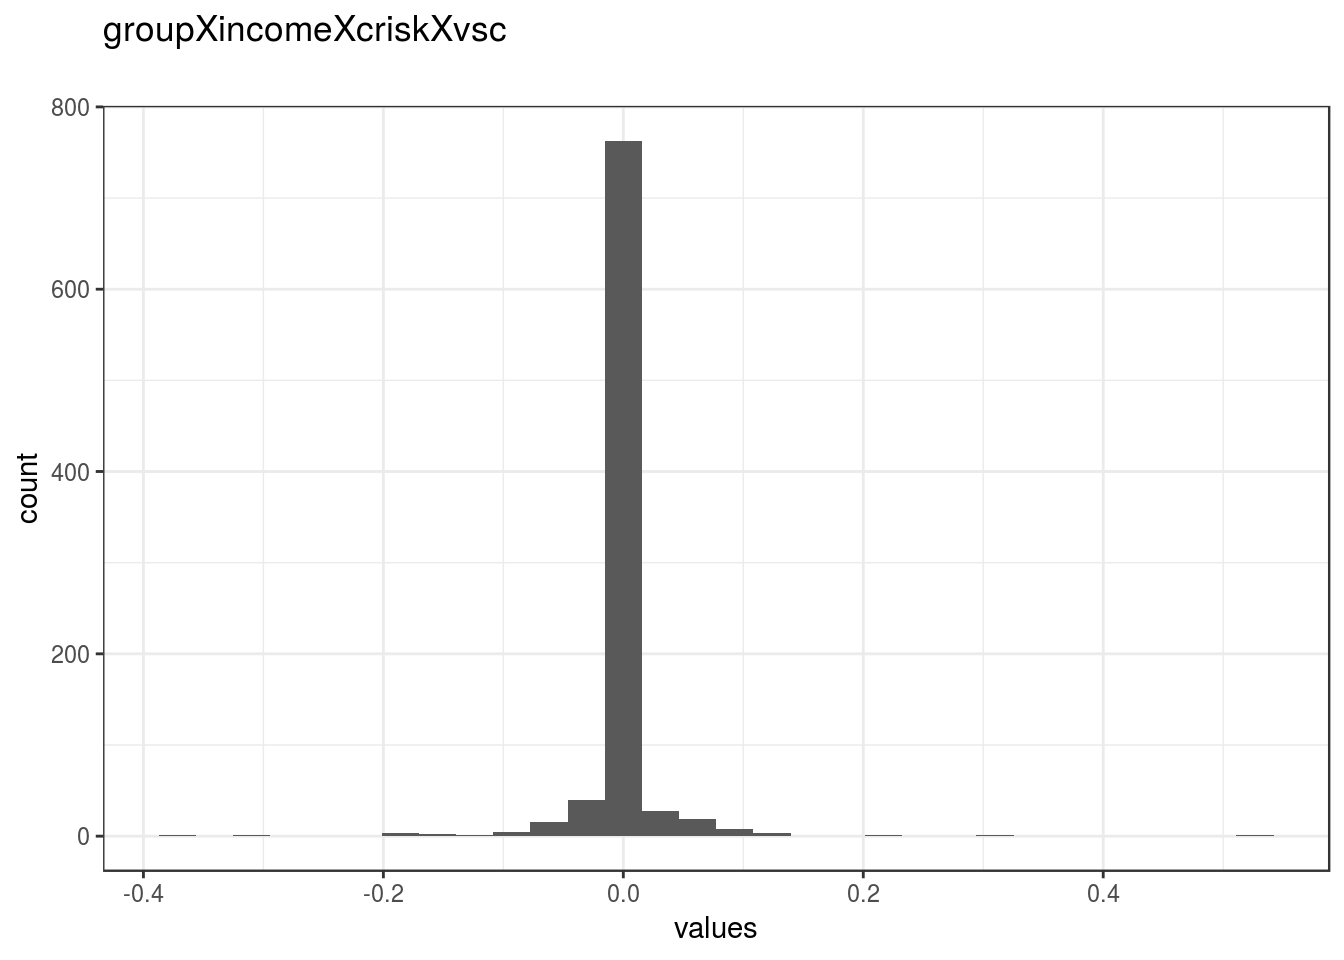
knitr::opts_chunk$set(fig.height = old_height)1111 missing values.
Summary statistics
attributes(item) <- item_attributes
df = data.frame(item, stringsAsFactors = FALSE)
names(df) = html_item_name
escaped_table(codebook_table(df))| name | data_type | missing | complete | n | mean | sd | p0 | p25 | p50 | p75 | p100 | hist | format.spss | display_width |
|---|---|---|---|---|---|---|---|---|---|---|---|---|---|---|
| groupXincomeXcriskXvsc | numeric | 1111 | 895 | 2006 | -0.00022 | 0.037 | -0.38 | 0 | 0 | 0 | 0.52 | ▁▁▁▇▁▁▁▁ | F8.2 | 24 |
if (show_missing_values) {
plot_labelled(missing_values, item_name, wrap_at)
}if (!is.null(item_info)) {
# don't show choices again, if they're basically same thing as value labels
if (!is.null(choices) && !is.null(item_info$choices) &&
all(names(na.omit(choices)) == item_info$choices) &&
all(na.omit(choices) == names(item_info$choices))) {
item_info$choices <- NULL
}
item_info$label_parsed <-
item_info$choice_list <- item_info$study_id <- item_info$id <- NULL
pander::pander(item_info)
}if (!is.null(choices) && length(choices) && length(choices) < 30) {
pander::pander(as.list(choices))
}groupXformidXcriskXvsc
Distribution
show_missing_values <- FALSE
if (has_labels(item)) {
missing_values <- item[is.na(haven::zap_missing(item))]
attributes(missing_values) <- attributes(item)
if (!is.null(attributes(item)$labels)) {
attributes(missing_values)$labels <- attributes(missing_values)$labels[is.na(attributes(missing_values)$labels)]
attributes(item)$labels <- attributes(item)$labels[!is.na(attributes(item)$labels)]
}
if (is.double(item)) {
show_missing_values <- length(unique(haven::na_tag(missing_values))) > 1
item <- haven::zap_missing(item)
}
if (length(item_attributes$labels) == 0 && is.numeric(item)) {
item <- haven::zap_labels(item)
}
}
item_nomiss <- item[!is.na(item)]
# unnest mc_multiple and so on
if (
is.character(item_nomiss) &&
stringr::str_detect(item_nomiss, stringr::fixed(", ")) &&
(exists("type", item_info) &&
stringr::str_detect(item_info$type, pattern = stringr::fixed("multiple")))
) {
item_nomiss <- unlist(stringr::str_split(item_nomiss, pattern = stringr::fixed(", ")))
}
attributes(item_nomiss) <- attributes(item)
old_height <- knitr::opts_chunk$get("fig.height")
non_missing_choices <- item_attributes[["labels"]]
many_labels <- length(non_missing_choices) > 7
go_vertical <- !is.numeric(item_nomiss) || many_labels
if ( go_vertical ) {
# numeric items are plotted horizontally (because that's what usually expected)
# categorical items are plotted vertically because we can use the screen real estate better this way
if (is.null(choices) ||
dplyr::n_distinct(item_nomiss) > length(non_missing_choices)) {
non_missing_choices <- unique(item_nomiss)
names(non_missing_choices) <- non_missing_choices
}
choice_multiplier <- old_height/6.5
new_height <- 2 + choice_multiplier * length(non_missing_choices)
new_height <- ifelse(new_height > 20, 20, new_height)
new_height <- ifelse(new_height < 1, 1, new_height)
knitr::opts_chunk$set(fig.height = new_height)
}
wrap_at <- knitr::opts_chunk$get("fig.width") * 10# todo: if there are free-text choices mingled in with the pre-defined ones, don't show
# todo: show rare items if they are pre-defined
# todo: bin rare responses into "other category"
if (!length(item_nomiss)) {
cat("No non-missing values to show.")
} else if (is.numeric(item_nomiss) || dplyr::n_distinct(item_nomiss) < 20) {
plot_labelled(item_nomiss, item_name, wrap_at, go_vertical)
} else {
cat(dplyr::n_distinct(item_nomiss), " unique, categorical values, so not shown.")
}
knitr::opts_chunk$set(fig.height = old_height)1106 missing values.
Summary statistics
attributes(item) <- item_attributes
df = data.frame(item, stringsAsFactors = FALSE)
names(df) = html_item_name
escaped_table(codebook_table(df))| name | data_type | missing | complete | n | mean | sd | p0 | p25 | p50 | p75 | p100 | hist | format.spss | display_width |
|---|---|---|---|---|---|---|---|---|---|---|---|---|---|---|
| groupXformidXcriskXvsc | numeric | 1106 | 900 | 2006 | 0.00027 | 0.035 | -0.38 | 0 | 0 | 0 | 0.52 | ▁▁▁▇▁▁▁▁ | F8.2 | 24 |
if (show_missing_values) {
plot_labelled(missing_values, item_name, wrap_at)
}if (!is.null(item_info)) {
# don't show choices again, if they're basically same thing as value labels
if (!is.null(choices) && !is.null(item_info$choices) &&
all(names(na.omit(choices)) == item_info$choices) &&
all(na.omit(choices) == names(item_info$choices))) {
item_info$choices <- NULL
}
item_info$label_parsed <-
item_info$choice_list <- item_info$study_id <- item_info$id <- NULL
pander::pander(item_info)
}if (!is.null(choices) && length(choices) && length(choices) < 30) {
pander::pander(as.list(choices))
}incomeXformidXcriskXvsc
Distribution
show_missing_values <- FALSE
if (has_labels(item)) {
missing_values <- item[is.na(haven::zap_missing(item))]
attributes(missing_values) <- attributes(item)
if (!is.null(attributes(item)$labels)) {
attributes(missing_values)$labels <- attributes(missing_values)$labels[is.na(attributes(missing_values)$labels)]
attributes(item)$labels <- attributes(item)$labels[!is.na(attributes(item)$labels)]
}
if (is.double(item)) {
show_missing_values <- length(unique(haven::na_tag(missing_values))) > 1
item <- haven::zap_missing(item)
}
if (length(item_attributes$labels) == 0 && is.numeric(item)) {
item <- haven::zap_labels(item)
}
}
item_nomiss <- item[!is.na(item)]
# unnest mc_multiple and so on
if (
is.character(item_nomiss) &&
stringr::str_detect(item_nomiss, stringr::fixed(", ")) &&
(exists("type", item_info) &&
stringr::str_detect(item_info$type, pattern = stringr::fixed("multiple")))
) {
item_nomiss <- unlist(stringr::str_split(item_nomiss, pattern = stringr::fixed(", ")))
}
attributes(item_nomiss) <- attributes(item)
old_height <- knitr::opts_chunk$get("fig.height")
non_missing_choices <- item_attributes[["labels"]]
many_labels <- length(non_missing_choices) > 7
go_vertical <- !is.numeric(item_nomiss) || many_labels
if ( go_vertical ) {
# numeric items are plotted horizontally (because that's what usually expected)
# categorical items are plotted vertically because we can use the screen real estate better this way
if (is.null(choices) ||
dplyr::n_distinct(item_nomiss) > length(non_missing_choices)) {
non_missing_choices <- unique(item_nomiss)
names(non_missing_choices) <- non_missing_choices
}
choice_multiplier <- old_height/6.5
new_height <- 2 + choice_multiplier * length(non_missing_choices)
new_height <- ifelse(new_height > 20, 20, new_height)
new_height <- ifelse(new_height < 1, 1, new_height)
knitr::opts_chunk$set(fig.height = new_height)
}
wrap_at <- knitr::opts_chunk$get("fig.width") * 10# todo: if there are free-text choices mingled in with the pre-defined ones, don't show
# todo: show rare items if they are pre-defined
# todo: bin rare responses into "other category"
if (!length(item_nomiss)) {
cat("No non-missing values to show.")
} else if (is.numeric(item_nomiss) || dplyr::n_distinct(item_nomiss) < 20) {
plot_labelled(item_nomiss, item_name, wrap_at, go_vertical)
} else {
cat(dplyr::n_distinct(item_nomiss), " unique, categorical values, so not shown.")
}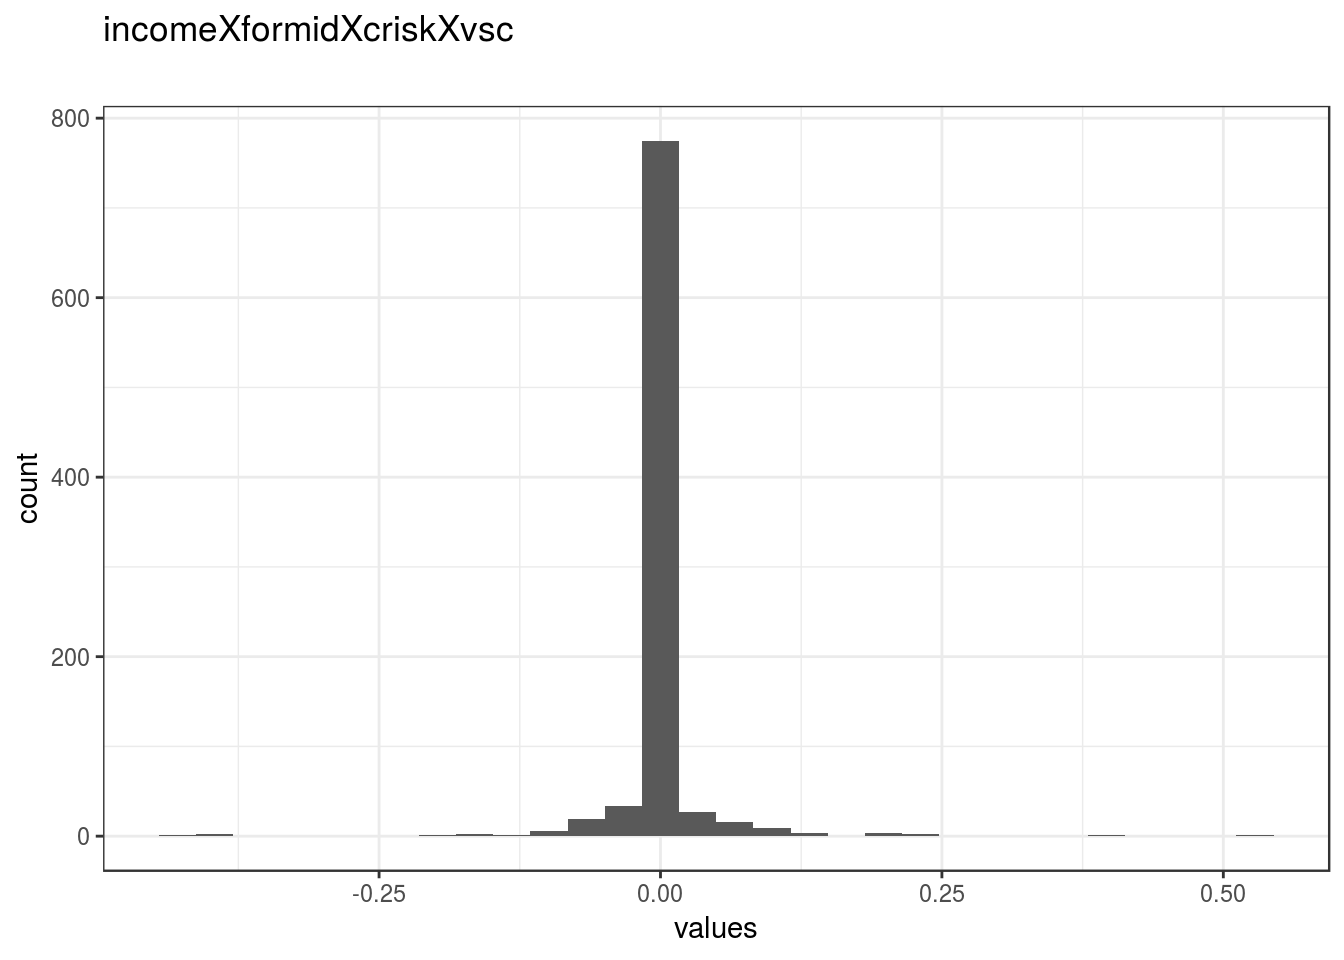
knitr::opts_chunk$set(fig.height = old_height)1103 missing values.
Summary statistics
attributes(item) <- item_attributes
df = data.frame(item, stringsAsFactors = FALSE)
names(df) = html_item_name
escaped_table(codebook_table(df))| name | data_type | missing | complete | n | mean | sd | p0 | p25 | p50 | p75 | p100 | hist | format.spss | display_width |
|---|---|---|---|---|---|---|---|---|---|---|---|---|---|---|
| incomeXformidXcriskXvsc | numeric | 1103 | 903 | 2006 | 0.00038 | 0.042 | -0.44 | 0 | 0 | 0 | 0.52 | ▁▁▁▇▁▁▁▁ | F8.2 | 25 |
if (show_missing_values) {
plot_labelled(missing_values, item_name, wrap_at)
}if (!is.null(item_info)) {
# don't show choices again, if they're basically same thing as value labels
if (!is.null(choices) && !is.null(item_info$choices) &&
all(names(na.omit(choices)) == item_info$choices) &&
all(na.omit(choices) == names(item_info$choices))) {
item_info$choices <- NULL
}
item_info$label_parsed <-
item_info$choice_list <- item_info$study_id <- item_info$id <- NULL
pander::pander(item_info)
}if (!is.null(choices) && length(choices) && length(choices) < 30) {
pander::pander(as.list(choices))
}groupXincomeXformidXvsc
Distribution
show_missing_values <- FALSE
if (has_labels(item)) {
missing_values <- item[is.na(haven::zap_missing(item))]
attributes(missing_values) <- attributes(item)
if (!is.null(attributes(item)$labels)) {
attributes(missing_values)$labels <- attributes(missing_values)$labels[is.na(attributes(missing_values)$labels)]
attributes(item)$labels <- attributes(item)$labels[!is.na(attributes(item)$labels)]
}
if (is.double(item)) {
show_missing_values <- length(unique(haven::na_tag(missing_values))) > 1
item <- haven::zap_missing(item)
}
if (length(item_attributes$labels) == 0 && is.numeric(item)) {
item <- haven::zap_labels(item)
}
}
item_nomiss <- item[!is.na(item)]
# unnest mc_multiple and so on
if (
is.character(item_nomiss) &&
stringr::str_detect(item_nomiss, stringr::fixed(", ")) &&
(exists("type", item_info) &&
stringr::str_detect(item_info$type, pattern = stringr::fixed("multiple")))
) {
item_nomiss <- unlist(stringr::str_split(item_nomiss, pattern = stringr::fixed(", ")))
}
attributes(item_nomiss) <- attributes(item)
old_height <- knitr::opts_chunk$get("fig.height")
non_missing_choices <- item_attributes[["labels"]]
many_labels <- length(non_missing_choices) > 7
go_vertical <- !is.numeric(item_nomiss) || many_labels
if ( go_vertical ) {
# numeric items are plotted horizontally (because that's what usually expected)
# categorical items are plotted vertically because we can use the screen real estate better this way
if (is.null(choices) ||
dplyr::n_distinct(item_nomiss) > length(non_missing_choices)) {
non_missing_choices <- unique(item_nomiss)
names(non_missing_choices) <- non_missing_choices
}
choice_multiplier <- old_height/6.5
new_height <- 2 + choice_multiplier * length(non_missing_choices)
new_height <- ifelse(new_height > 20, 20, new_height)
new_height <- ifelse(new_height < 1, 1, new_height)
knitr::opts_chunk$set(fig.height = new_height)
}
wrap_at <- knitr::opts_chunk$get("fig.width") * 10# todo: if there are free-text choices mingled in with the pre-defined ones, don't show
# todo: show rare items if they are pre-defined
# todo: bin rare responses into "other category"
if (!length(item_nomiss)) {
cat("No non-missing values to show.")
} else if (is.numeric(item_nomiss) || dplyr::n_distinct(item_nomiss) < 20) {
plot_labelled(item_nomiss, item_name, wrap_at, go_vertical)
} else {
cat(dplyr::n_distinct(item_nomiss), " unique, categorical values, so not shown.")
}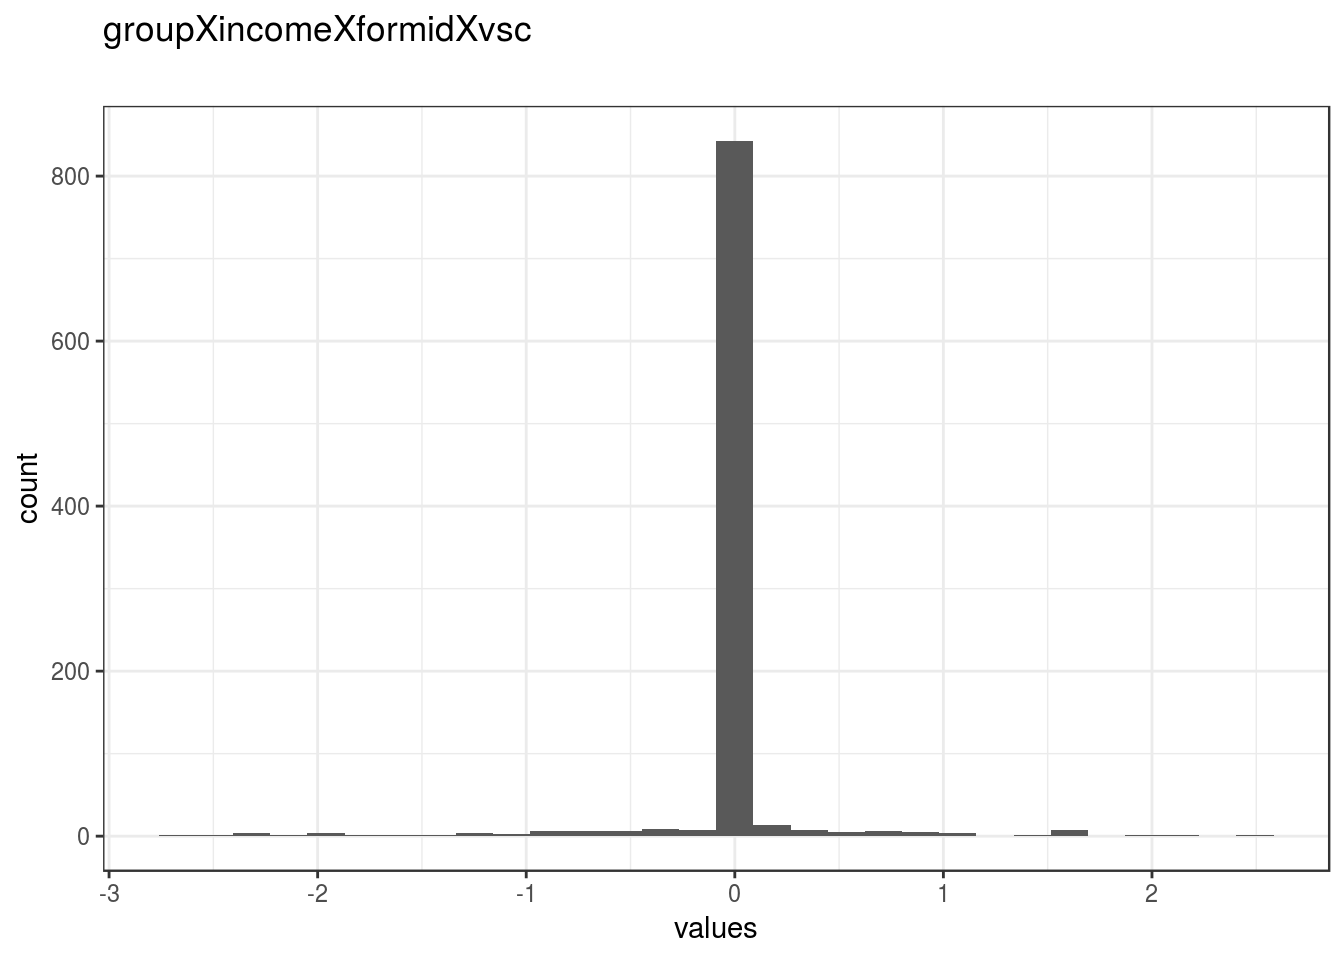
knitr::opts_chunk$set(fig.height = old_height)1053 missing values.
Summary statistics
attributes(item) <- item_attributes
df = data.frame(item, stringsAsFactors = FALSE)
names(df) = html_item_name
escaped_table(codebook_table(df))| name | data_type | missing | complete | n | mean | sd | p0 | p25 | p50 | p75 | p100 | hist | format.spss | display_width |
|---|---|---|---|---|---|---|---|---|---|---|---|---|---|---|
| groupXincomeXformidXvsc | numeric | 1053 | 953 | 2006 | -0.018 | 0.38 | -2.67 | 0 | 0 | 0 | 2.5 | ▁▁▁▁▇▁▁▁ | F8.2 | 25 |
if (show_missing_values) {
plot_labelled(missing_values, item_name, wrap_at)
}if (!is.null(item_info)) {
# don't show choices again, if they're basically same thing as value labels
if (!is.null(choices) && !is.null(item_info$choices) &&
all(names(na.omit(choices)) == item_info$choices) &&
all(na.omit(choices) == names(item_info$choices))) {
item_info$choices <- NULL
}
item_info$label_parsed <-
item_info$choice_list <- item_info$study_id <- item_info$id <- NULL
pander::pander(item_info)
}if (!is.null(choices) && length(choices) && length(choices) < 30) {
pander::pander(as.list(choices))
}groupXincomeXformidXcriskXvsc
Distribution
show_missing_values <- FALSE
if (has_labels(item)) {
missing_values <- item[is.na(haven::zap_missing(item))]
attributes(missing_values) <- attributes(item)
if (!is.null(attributes(item)$labels)) {
attributes(missing_values)$labels <- attributes(missing_values)$labels[is.na(attributes(missing_values)$labels)]
attributes(item)$labels <- attributes(item)$labels[!is.na(attributes(item)$labels)]
}
if (is.double(item)) {
show_missing_values <- length(unique(haven::na_tag(missing_values))) > 1
item <- haven::zap_missing(item)
}
if (length(item_attributes$labels) == 0 && is.numeric(item)) {
item <- haven::zap_labels(item)
}
}
item_nomiss <- item[!is.na(item)]
# unnest mc_multiple and so on
if (
is.character(item_nomiss) &&
stringr::str_detect(item_nomiss, stringr::fixed(", ")) &&
(exists("type", item_info) &&
stringr::str_detect(item_info$type, pattern = stringr::fixed("multiple")))
) {
item_nomiss <- unlist(stringr::str_split(item_nomiss, pattern = stringr::fixed(", ")))
}
attributes(item_nomiss) <- attributes(item)
old_height <- knitr::opts_chunk$get("fig.height")
non_missing_choices <- item_attributes[["labels"]]
many_labels <- length(non_missing_choices) > 7
go_vertical <- !is.numeric(item_nomiss) || many_labels
if ( go_vertical ) {
# numeric items are plotted horizontally (because that's what usually expected)
# categorical items are plotted vertically because we can use the screen real estate better this way
if (is.null(choices) ||
dplyr::n_distinct(item_nomiss) > length(non_missing_choices)) {
non_missing_choices <- unique(item_nomiss)
names(non_missing_choices) <- non_missing_choices
}
choice_multiplier <- old_height/6.5
new_height <- 2 + choice_multiplier * length(non_missing_choices)
new_height <- ifelse(new_height > 20, 20, new_height)
new_height <- ifelse(new_height < 1, 1, new_height)
knitr::opts_chunk$set(fig.height = new_height)
}
wrap_at <- knitr::opts_chunk$get("fig.width") * 10# todo: if there are free-text choices mingled in with the pre-defined ones, don't show
# todo: show rare items if they are pre-defined
# todo: bin rare responses into "other category"
if (!length(item_nomiss)) {
cat("No non-missing values to show.")
} else if (is.numeric(item_nomiss) || dplyr::n_distinct(item_nomiss) < 20) {
plot_labelled(item_nomiss, item_name, wrap_at, go_vertical)
} else {
cat(dplyr::n_distinct(item_nomiss), " unique, categorical values, so not shown.")
}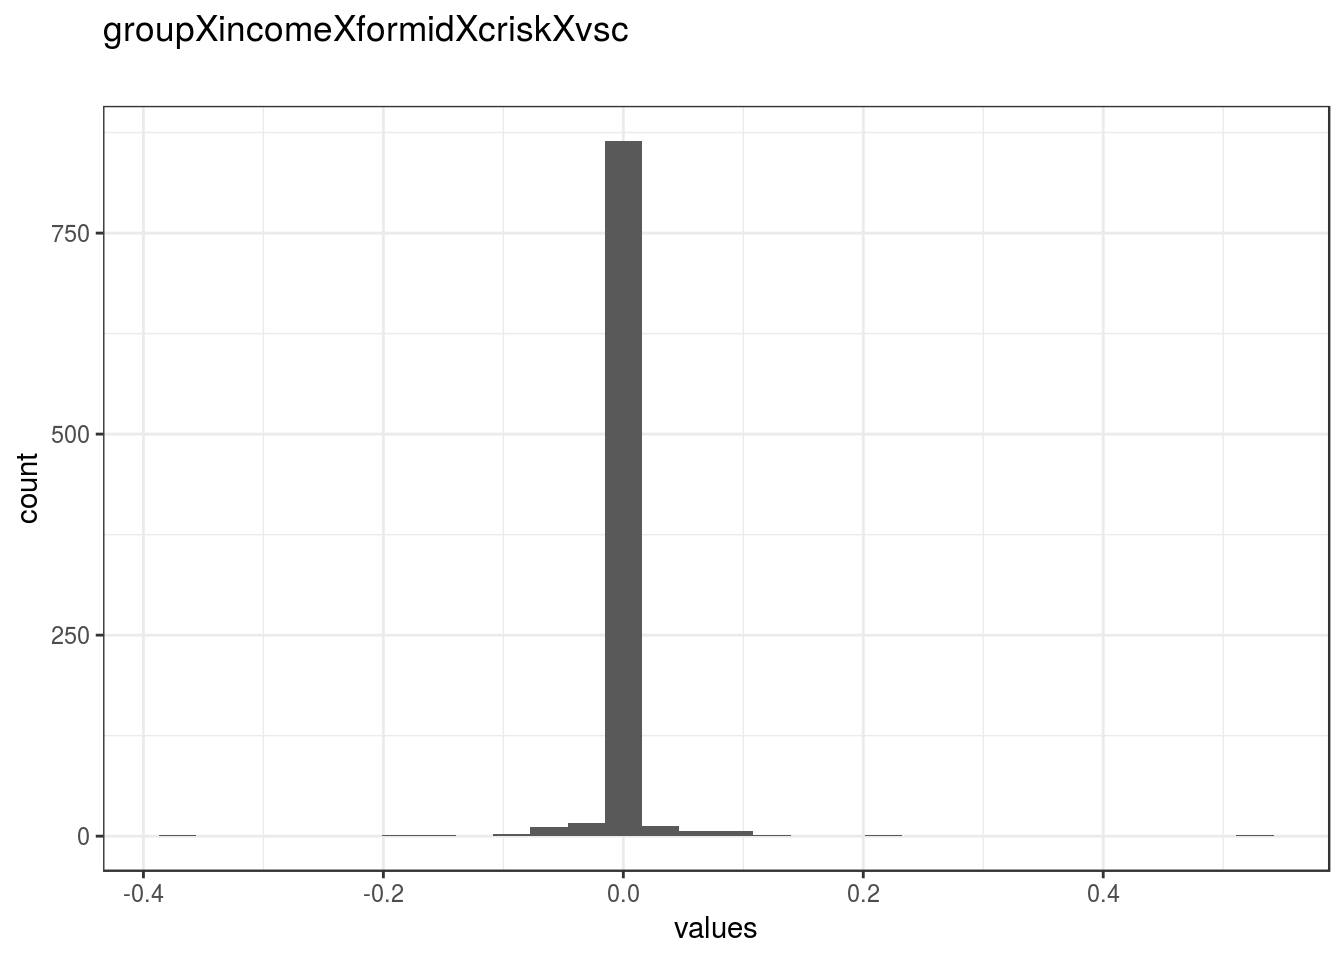
knitr::opts_chunk$set(fig.height = old_height)1077 missing values.
Summary statistics
attributes(item) <- item_attributes
df = data.frame(item, stringsAsFactors = FALSE)
names(df) = html_item_name
escaped_table(codebook_table(df))| name | data_type | missing | complete | n | mean | sd | p0 | p25 | p50 | p75 | p100 | hist | format.spss | display_width |
|---|---|---|---|---|---|---|---|---|---|---|---|---|---|---|
| groupXincomeXformidXcriskXvsc | numeric | 1077 | 929 | 2006 | 0.00025 | 0.028 | -0.38 | 0 | 0 | 0 | 0.52 | ▁▁▁▇▁▁▁▁ | F8.2 | 31 |
if (show_missing_values) {
plot_labelled(missing_values, item_name, wrap_at)
}if (!is.null(item_info)) {
# don't show choices again, if they're basically same thing as value labels
if (!is.null(choices) && !is.null(item_info$choices) &&
all(names(na.omit(choices)) == item_info$choices) &&
all(na.omit(choices) == names(item_info$choices))) {
item_info$choices <- NULL
}
item_info$label_parsed <-
item_info$choice_list <- item_info$study_id <- item_info$id <- NULL
pander::pander(item_info)
}if (!is.null(choices) && length(choices) && length(choices) < 30) {
pander::pander(as.list(choices))
}filter_$
keepdrop = 0 and conriskkeepdrop = 0 and MC1nationalitycorrect = 1 and MC2incomecorrect = 1 and MC3hobbiescorrect = 1 (FILTER)
Distribution
show_missing_values <- FALSE
if (has_labels(item)) {
missing_values <- item[is.na(haven::zap_missing(item))]
attributes(missing_values) <- attributes(item)
if (!is.null(attributes(item)$labels)) {
attributes(missing_values)$labels <- attributes(missing_values)$labels[is.na(attributes(missing_values)$labels)]
attributes(item)$labels <- attributes(item)$labels[!is.na(attributes(item)$labels)]
}
if (is.double(item)) {
show_missing_values <- length(unique(haven::na_tag(missing_values))) > 1
item <- haven::zap_missing(item)
}
if (length(item_attributes$labels) == 0 && is.numeric(item)) {
item <- haven::zap_labels(item)
}
}
item_nomiss <- item[!is.na(item)]
# unnest mc_multiple and so on
if (
is.character(item_nomiss) &&
stringr::str_detect(item_nomiss, stringr::fixed(", ")) &&
(exists("type", item_info) &&
stringr::str_detect(item_info$type, pattern = stringr::fixed("multiple")))
) {
item_nomiss <- unlist(stringr::str_split(item_nomiss, pattern = stringr::fixed(", ")))
}
attributes(item_nomiss) <- attributes(item)
old_height <- knitr::opts_chunk$get("fig.height")
non_missing_choices <- item_attributes[["labels"]]
many_labels <- length(non_missing_choices) > 7
go_vertical <- !is.numeric(item_nomiss) || many_labels
if ( go_vertical ) {
# numeric items are plotted horizontally (because that's what usually expected)
# categorical items are plotted vertically because we can use the screen real estate better this way
if (is.null(choices) ||
dplyr::n_distinct(item_nomiss) > length(non_missing_choices)) {
non_missing_choices <- unique(item_nomiss)
names(non_missing_choices) <- non_missing_choices
}
choice_multiplier <- old_height/6.5
new_height <- 2 + choice_multiplier * length(non_missing_choices)
new_height <- ifelse(new_height > 20, 20, new_height)
new_height <- ifelse(new_height < 1, 1, new_height)
knitr::opts_chunk$set(fig.height = new_height)
}
wrap_at <- knitr::opts_chunk$get("fig.width") * 10# todo: if there are free-text choices mingled in with the pre-defined ones, don't show
# todo: show rare items if they are pre-defined
# todo: bin rare responses into "other category"
if (!length(item_nomiss)) {
cat("No non-missing values to show.")
} else if (is.numeric(item_nomiss) || dplyr::n_distinct(item_nomiss) < 20) {
plot_labelled(item_nomiss, item_name, wrap_at, go_vertical)
} else {
cat(dplyr::n_distinct(item_nomiss), " unique, categorical values, so not shown.")
}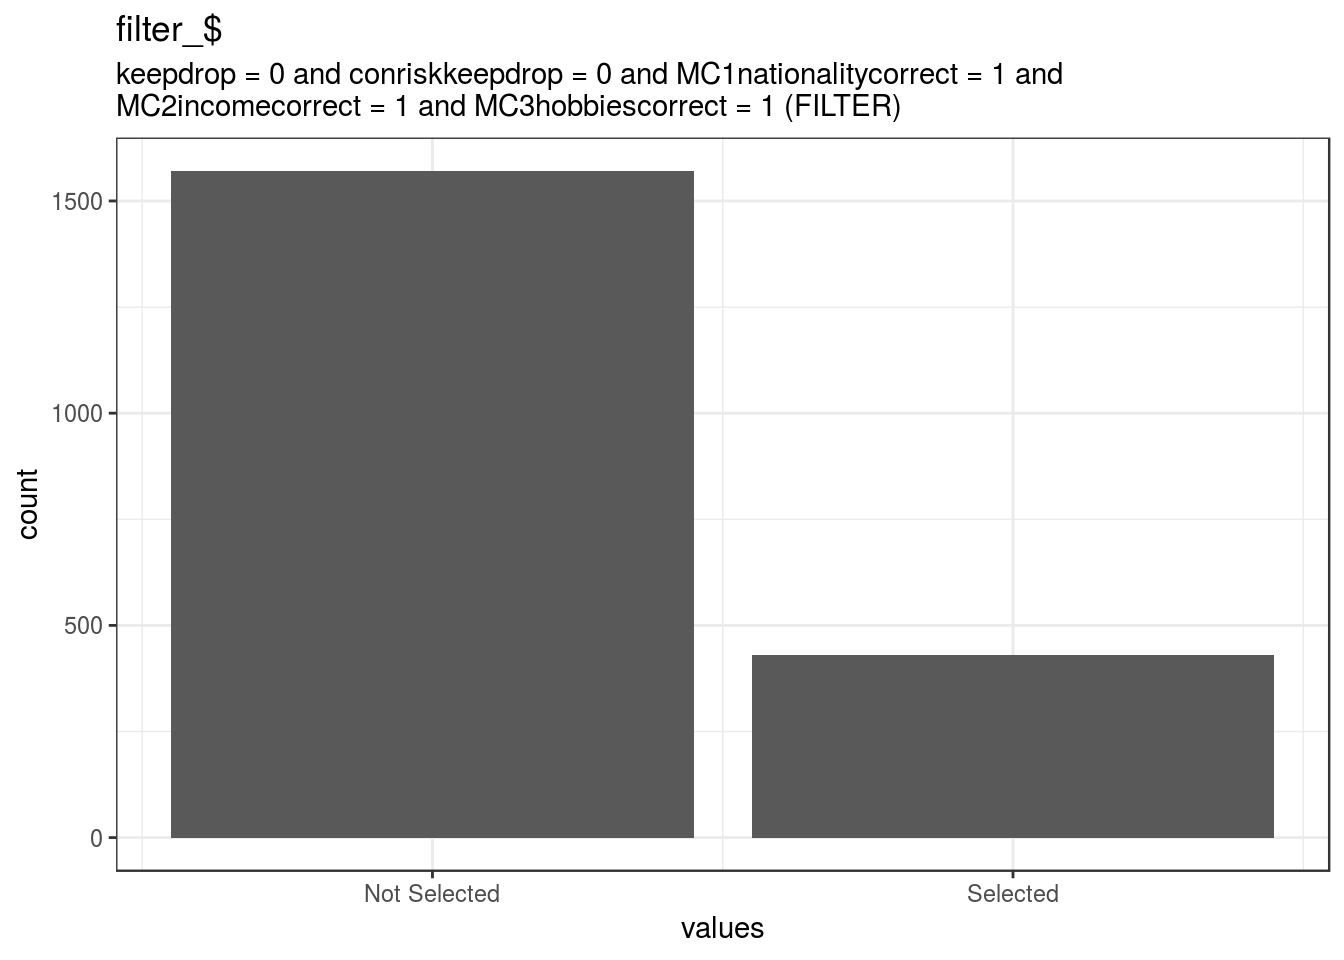
knitr::opts_chunk$set(fig.height = old_height)5 missing values.
Summary statistics
attributes(item) <- item_attributes
df = data.frame(item, stringsAsFactors = FALSE)
names(df) = html_item_name
escaped_table(codebook_table(df))| name | label | data_type | value_labels | missing | complete | n | mean | sd | p0 | p25 | p50 | p75 | p100 | hist | format.spss | display_width |
|---|---|---|---|---|---|---|---|---|---|---|---|---|---|---|---|---|
| filter_$ | keepdrop = 0 and conriskkeepdrop = 0 and MC1nationalitycorrect = 1 and MC2incomecorrect = 1 and MC3hobbiescorrect = 1 (FILTER) | numeric | 0. Not Selected, 1. Selected |
5 | 2001 | 2006 | 0.21 | 0.41 | 0 | 0 | 0 | 0 | 1 | ▇▁▁▁▁▁▁▂ | F1.0 | 10 |
if (show_missing_values) {
plot_labelled(missing_values, item_name, wrap_at)
}if (!is.null(item_info)) {
# don't show choices again, if they're basically same thing as value labels
if (!is.null(choices) && !is.null(item_info$choices) &&
all(names(na.omit(choices)) == item_info$choices) &&
all(na.omit(choices) == names(item_info$choices))) {
item_info$choices <- NULL
}
item_info$label_parsed <-
item_info$choice_list <- item_info$study_id <- item_info$id <- NULL
pander::pander(item_info)
}Value labels
if (!is.null(choices) && length(choices) && length(choices) < 30) {
pander::pander(as.list(choices))
}- Not Selected: 0
- Selected: 1
Scale: BehVig
Overview
Reliability: Cronbach’s α [95% CI] = 0.95 [0.95;0.96].
Missing: 1022.
old_height <- knitr::opts_chunk$get("fig.height")
new_height <- length(scale_info$scale_item_names)
new_height <- ifelse(new_height > 20, 20, new_height)
new_height <- ifelse(new_height < 1, 1, new_height)
new_height <- ifelse(is.na(new_height) | is.nan(new_height),
                     old_height, new_height)
knitr::opts_chunk$set(fig.height = new_height)
likert_plot <- likert_from_items(items)
if (!is.null(likert_plot)) {
graphics::plot(likert_plot)
}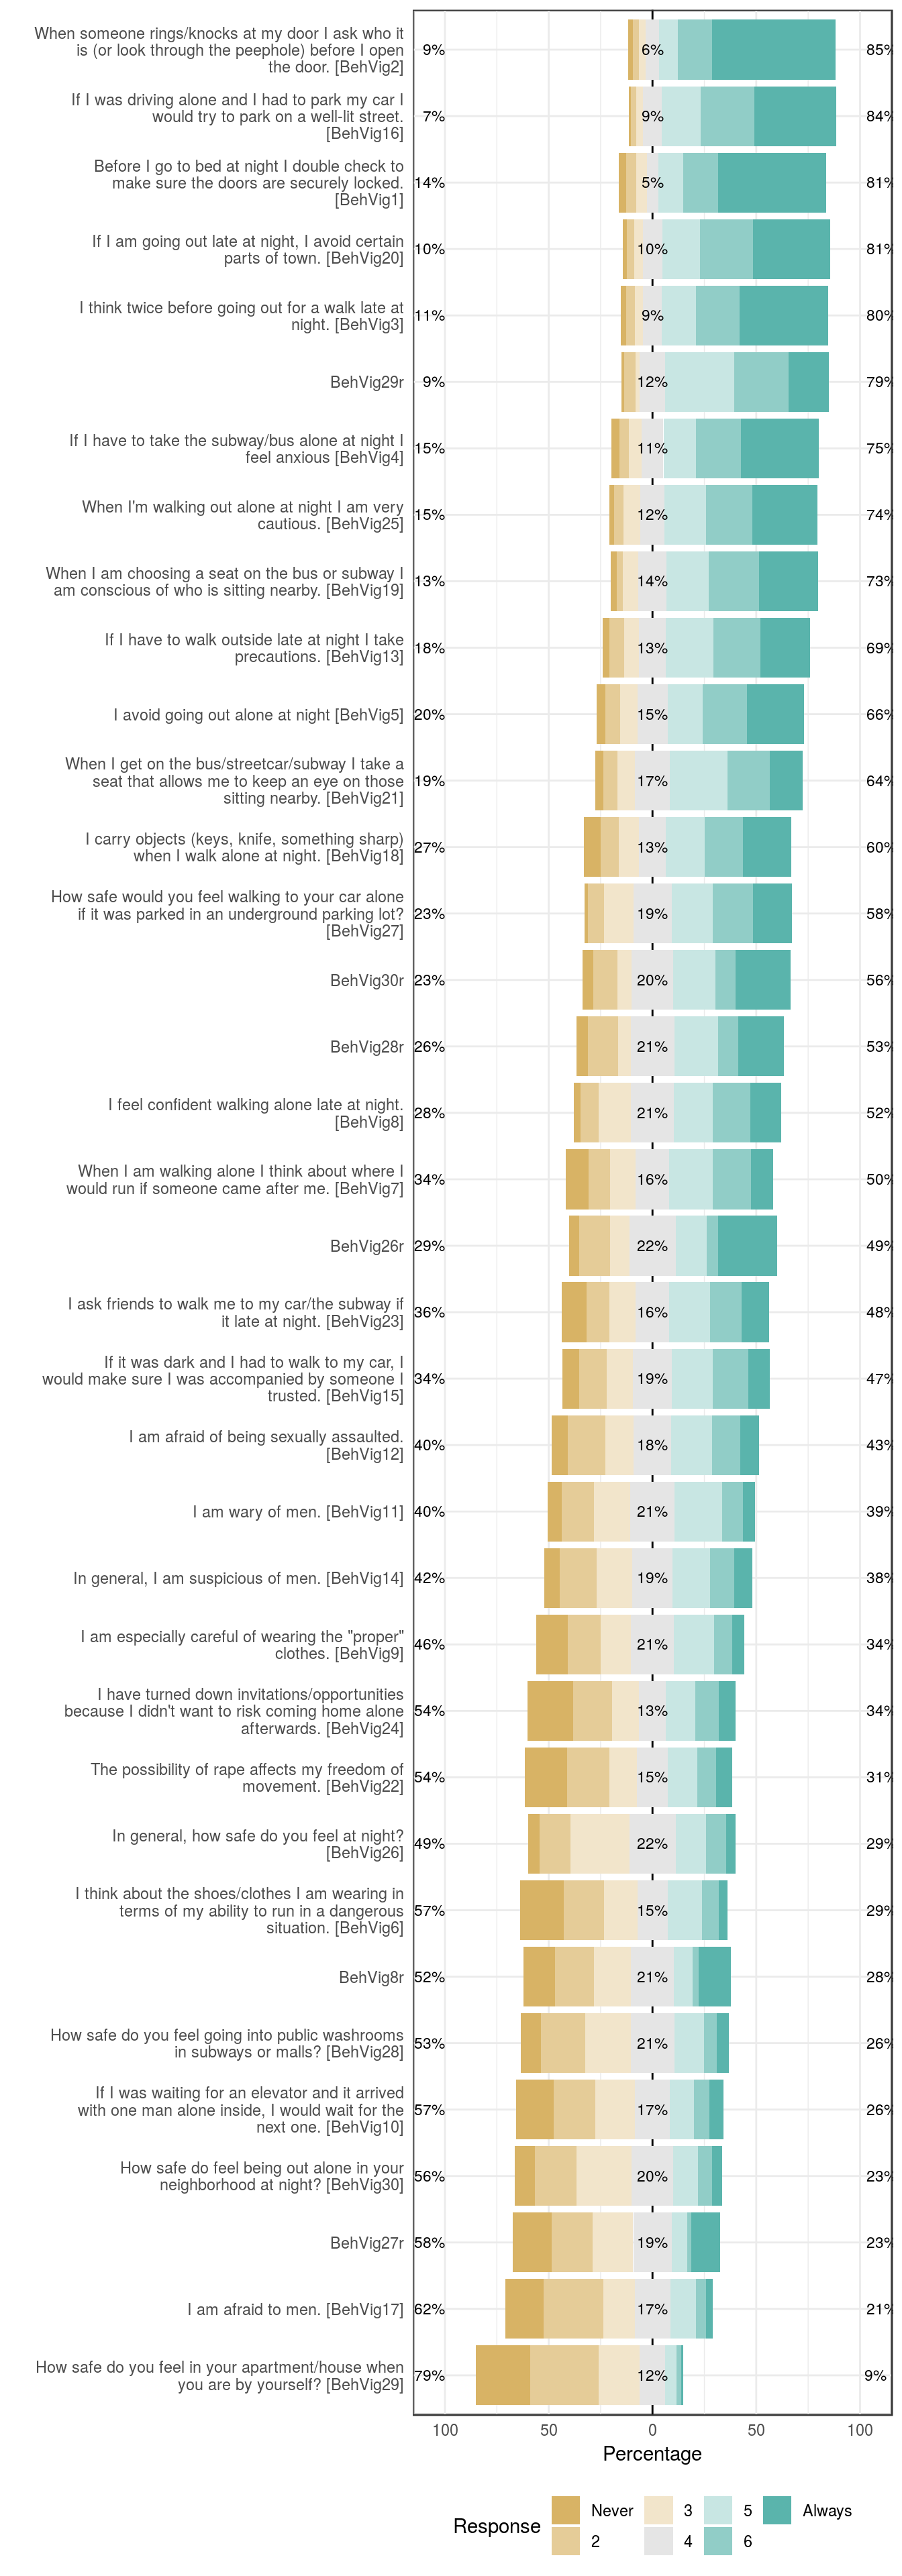
knitr::opts_chunk$set(fig.height = old_height)binwidth <- mean(diff(sort(unique(scale))))
wrap_at <- knitr::opts_chunk$get("fig.width") * 10dist_plot <- plot_labelled(scale, scale_name, wrap_at)
choices <- attributes(items[[1]])$item$choices
breaks <- as.numeric(names(choices))
if (length(breaks)) {
suppressMessages( # ignore message about overwriting x axis
dist_plot <- dist_plot +
ggplot2::scale_x_continuous("values",
breaks = breaks,
labels = stringr::str_wrap(unlist(choices), ceiling(wrap_at * 0.21))) +
ggplot2::expand_limits(x = range(breaks)))
}
dist_plot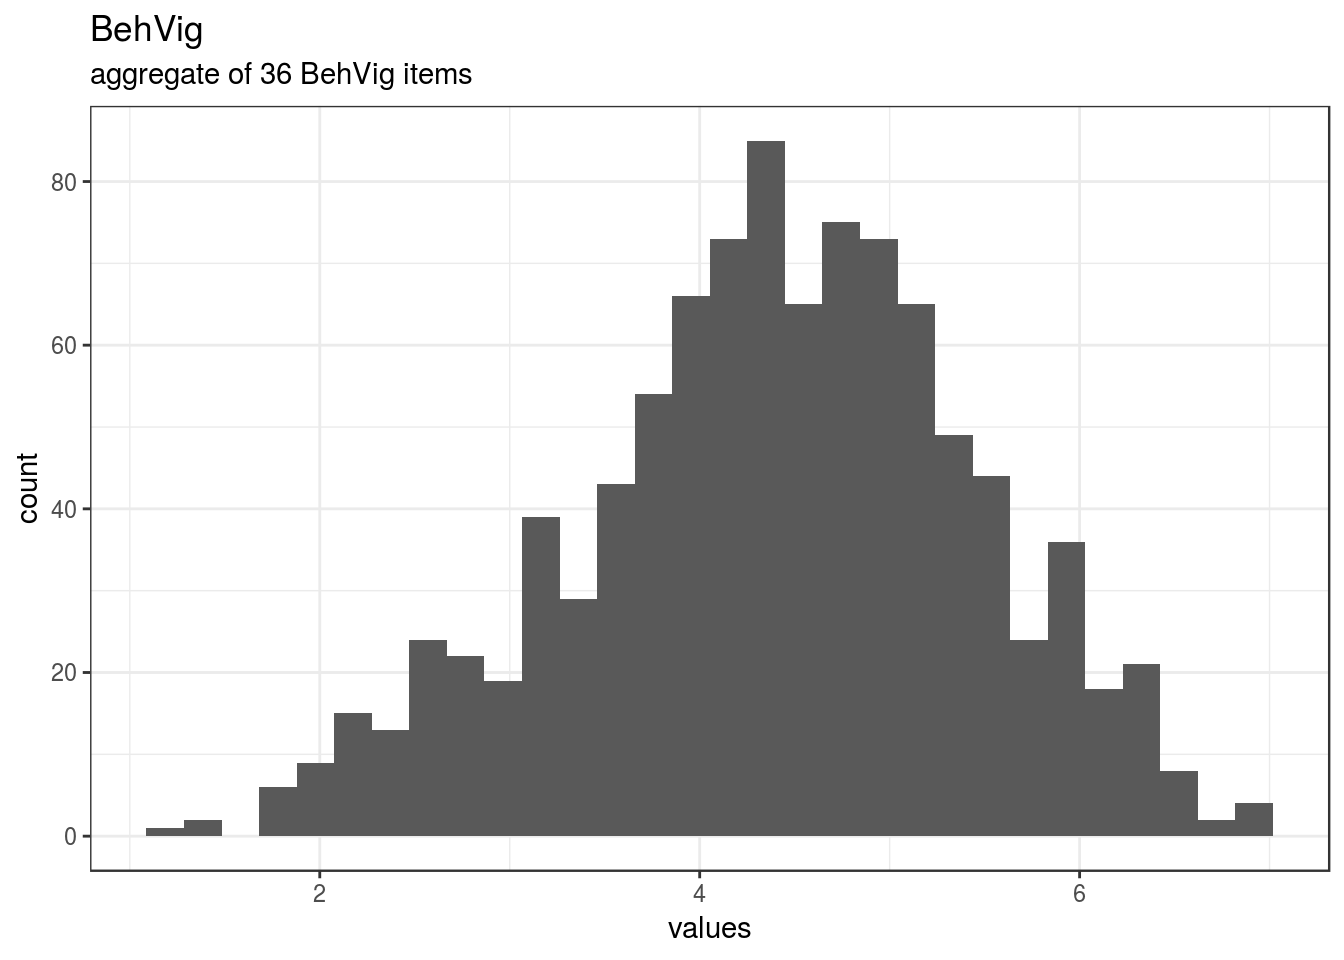
Reliability details
for (i in seq_along(reliabilities)) {
  rel <- reliabilities[[i]]
  cat(knitr::knit_print(rel, indent = paste0(indent, "####")))
}
Reliability
95% Confidence Interval
if (!is.null(x$total$ase)) {
  pander::pander(data.frame(lower = x$total$raw_alpha - 1.96 * x$total$ase,
             estimate = x$total$raw_alpha,
             upper = x$total$raw_alpha + 1.96 *
  x$total$ase))
}| lower | estimate | upper |
|---|---|---|
| 0.9514 | 0.9542 | 0.9571 |
pander::pander(x$total)| raw_alpha | std.alpha | G6(smc) | average_r | S/N | ase | mean | sd | median_r |
|---|---|---|---|---|---|---|---|---|
| 0.9542 | 0.9542 | 0.979 | 0.3667 | 20.85 | 0.001458 | 4.308 | 1.038 | 0.3598 |
Reliability if an item is dropped:
rownames(x$alpha.drop) <- recursive_escape(rownames(x$alpha.drop))
pander::pander(x$alpha.drop)| raw_alpha | std.alpha | G6(smc) | average_r | S/N | alpha se | var.r | med.r | |
|---|---|---|---|---|---|---|---|---|
| BehVig1 | 0.9544 | 0.9543 | 0.9794 | 0.3739 | 20.9 | 0.001455 | 0.0202 | 0.3661 |
| BehVig2 | 0.9548 | 0.9549 | 0.9798 | 0.3772 | 21.19 | 0.001448 | 0.01925 | 0.3671 |
| BehVig3 | 0.9528 | 0.9528 | 0.9784 | 0.3656 | 20.17 | 0.001504 | 0.02081 | 0.3596 |
| BehVig4 | 0.9527 | 0.9527 | 0.9784 | 0.3654 | 20.15 | 0.001506 | 0.02098 | 0.3596 |
| BehVig5 | 0.9526 | 0.9526 | 0.9782 | 0.3646 | 20.09 | 0.001512 | 0.02089 | 0.3596 |
| BehVig6 | 0.9536 | 0.9536 | 0.9786 | 0.3701 | 20.57 | 0.001477 | 0.02049 | 0.3631 |
| BehVig7 | 0.953 | 0.953 | 0.9785 | 0.3667 | 20.26 | 0.001499 | 0.02101 | 0.3613 |
| BehVig8 | 0.9532 | 0.9532 | 0.9769 | 0.3677 | 20.36 | 0.001488 | 0.01977 | 0.3613 |
| BehVig9 | 0.9541 | 0.9541 | 0.9792 | 0.3727 | 20.79 | 0.001463 | 0.02022 | 0.3645 |
| BehVig10 | 0.9533 | 0.9533 | 0.979 | 0.3684 | 20.41 | 0.001488 | 0.02117 | 0.3629 |
| BehVig11 | 0.9529 | 0.9529 | 0.9782 | 0.3662 | 20.22 | 0.001503 | 0.0206 | 0.36 |
| BehVig12 | 0.9525 | 0.9525 | 0.9783 | 0.3644 | 20.06 | 0.001516 | 0.02067 | 0.3592 |
| BehVig13 | 0.9521 | 0.9522 | 0.9781 | 0.3625 | 19.9 | 0.001527 | 0.02054 | 0.3553 |
| BehVig14 | 0.9526 | 0.9526 | 0.978 | 0.3649 | 20.11 | 0.001511 | 0.02049 | 0.36 |
| BehVig15 | 0.9521 | 0.9522 | 0.978 | 0.3627 | 19.92 | 0.001528 | 0.02078 | 0.3546 |
| BehVig16 | 0.9533 | 0.9534 | 0.9789 | 0.3687 | 20.44 | 0.001488 | 0.02069 | 0.3629 |
| BehVig17 | 0.9529 | 0.9529 | 0.9784 | 0.3664 | 20.24 | 0.001501 | 0.02055 | 0.3596 |
| BehVig18 | 0.9532 | 0.9531 | 0.979 | 0.3676 | 20.34 | 0.001492 | 0.02118 | 0.3613 |
| BehVig19 | 0.9532 | 0.9533 | 0.9787 | 0.3682 | 20.39 | 0.001491 | 0.02079 | 0.3629 |
| BehVig20 | 0.9531 | 0.9531 | 0.9788 | 0.3672 | 20.31 | 0.001496 | 0.02082 | 0.3596 |
| BehVig21 | 0.9529 | 0.9529 | 0.9785 | 0.3663 | 20.23 | 0.001502 | 0.02086 | 0.3596 |
| BehVig22 | 0.9525 | 0.9526 | 0.9782 | 0.3647 | 20.1 | 0.001514 | 0.02058 | 0.3596 |
| BehVig23 | 0.952 | 0.9522 | 0.9779 | 0.3625 | 19.9 | 0.001533 | 0.02065 | 0.3552 |
| BehVig24 | 0.9523 | 0.9524 | 0.9784 | 0.3638 | 20.01 | 0.001523 | 0.02089 | 0.3559 |
| BehVig25 | 0.9521 | 0.9521 | 0.9781 | 0.362 | 19.86 | 0.001527 | 0.02042 | 0.357 |
| BehVig26 | 0.9526 | 0.9525 | 0.9768 | 0.3645 | 20.07 | 0.001507 | 0.01993 | 0.3592 |
| BehVig27 | 0.9526 | 0.9525 | 0.9768 | 0.3644 | 20.06 | 0.001509 | 0.01996 | 0.3596 |
| BehVig28 | 0.9531 | 0.9531 | 0.9767 | 0.3674 | 20.32 | 0.001492 | 0.02035 | 0.3631 |
| BehVig29 | 0.9537 | 0.9538 | 0.9769 | 0.3708 | 20.63 | 0.001475 | 0.01953 | 0.3637 |
| BehVig30 | 0.9528 | 0.9527 | 0.9768 | 0.3653 | 20.15 | 0.001502 | 0.02007 | 0.3596 |
| BehVig8r | 0.9532 | 0.9532 | 0.9769 | 0.3677 | 20.36 | 0.001488 | 0.01977 | 0.3613 |
| BehVig26r | 0.9526 | 0.9525 | 0.9768 | 0.3645 | 20.07 | 0.001507 | 0.01993 | 0.3592 |
| BehVig27r | 0.9526 | 0.9525 | 0.9768 | 0.3644 | 20.06 | 0.001509 | 0.01996 | 0.3596 |
| BehVig28r | 0.9531 | 0.9531 | 0.9767 | 0.3674 | 20.32 | 0.001492 | 0.02035 | 0.3631 |
| BehVig29r | 0.9537 | 0.9538 | 0.9769 | 0.3708 | 20.63 | 0.001475 | 0.01953 | 0.3637 |
| BehVig30r | 0.9528 | 0.9527 | 0.9768 | 0.3653 | 20.15 | 0.001502 | 0.02007 | 0.3596 |
Item statistics
rownames(x$item.stats) <- recursive_escape(rownames(x$item.stats))
pander::pander(x$item.stats)| n | raw.r | std.r | r.cor | r.drop | mean | sd | |
|---|---|---|---|---|---|---|---|
| BehVig1 | 1026 | 0.4325 | 0.4291 | 0.4039 | 0.3918 | 5.769 | 1.708 |
| BehVig2 | 1026 | 0.3489 | 0.3426 | 0.3121 | 0.3034 | 6.044 | 1.511 |
| BehVig3 | 1026 | 0.6531 | 0.6507 | 0.6399 | 0.6238 | 5.659 | 1.6 |
| BehVig4 | 1026 | 0.6566 | 0.6563 | 0.6444 | 0.6282 | 5.443 | 1.705 |
| BehVig5 | 1026 | 0.6766 | 0.676 | 0.6669 | 0.6508 | 5.064 | 1.768 |
| BehVig6 | 1018 | 0.5415 | 0.5298 | 0.5158 | 0.504 | 3.271 | 1.78 |
| BehVig7 | 1018 | 0.6335 | 0.6217 | 0.6087 | 0.5987 | 4.234 | 1.839 |
| BehVig8 | 1018 | 0.5844 | 0.5934 | 0.5997 | 0.5567 | 4.572 | 1.654 |
| BehVig9 | 1018 | 0.4759 | 0.4622 | 0.4412 | 0.4333 | 3.626 | 1.746 |
| BehVig10 | 1018 | 0.5825 | 0.577 | 0.5578 | 0.5508 | 3.328 | 1.794 |
| BehVig11 | 1007 | 0.6368 | 0.6347 | 0.6269 | 0.6117 | 3.916 | 1.6 |
| BehVig12 | 1007 | 0.6838 | 0.6829 | 0.6738 | 0.6623 | 4.017 | 1.768 |
| BehVig13 | 1007 | 0.7394 | 0.733 | 0.7253 | 0.7152 | 5.083 | 1.662 |
| BehVig14 | 1007 | 0.6728 | 0.6679 | 0.6627 | 0.6462 | 3.925 | 1.718 |
| BehVig15 | 1007 | 0.7318 | 0.7268 | 0.7197 | 0.7098 | 4.21 | 1.782 |
| BehVig16 | 1000 | 0.5648 | 0.5689 | 0.5514 | 0.5396 | 5.77 | 1.369 |
| BehVig17 | 1000 | 0.6317 | 0.6298 | 0.621 | 0.606 | 3.042 | 1.636 |
| BehVig18 | 1000 | 0.5993 | 0.5972 | 0.5775 | 0.5688 | 4.73 | 1.918 |
| BehVig19 | 1000 | 0.5839 | 0.582 | 0.5668 | 0.5548 | 5.319 | 1.567 |
| BehVig20 | 1000 | 0.6074 | 0.6087 | 0.5923 | 0.5812 | 5.636 | 1.499 |
| BehVig21 | 987 | 0.6372 | 0.6325 | 0.6194 | 0.6098 | 4.823 | 1.602 |
| BehVig22 | 987 | 0.6821 | 0.6735 | 0.6647 | 0.6523 | 3.399 | 1.904 |
| BehVig23 | 987 | 0.7432 | 0.734 | 0.7281 | 0.718 | 4.197 | 1.902 |
| BehVig24 | 987 | 0.708 | 0.6986 | 0.6878 | 0.6792 | 3.448 | 1.963 |
| BehVig25 | 987 | 0.7468 | 0.7452 | 0.7381 | 0.7258 | 5.347 | 1.595 |
| BehVig26 | 985 | 0.6719 | 0.6805 | 0.6878 | 0.6484 | 3.729 | 1.501 |
| BehVig27 | 985 | 0.6758 | 0.6831 | 0.6903 | 0.6505 | 4.806 | 1.617 |
| BehVig28 | 985 | 0.5984 | 0.6035 | 0.6099 | 0.5689 | 3.501 | 1.607 |
| BehVig29 | 985 | 0.4989 | 0.5109 | 0.5164 | 0.4702 | 2.488 | 1.356 |
| BehVig30 | 984 | 0.6469 | 0.6572 | 0.6642 | 0.621 | 3.444 | 1.573 |
| BehVig8r | 1018 | 0.5844 | 0.5934 | 0.5997 | 0.5567 | 4.572 | 1.654 |
| BehVig26r | 985 | 0.6719 | 0.6805 | 0.6878 | 0.6484 | 3.729 | 1.501 |
| BehVig27r | 985 | 0.6758 | 0.6831 | 0.6903 | 0.6505 | 4.806 | 1.617 |
| BehVig28r | 985 | 0.5984 | 0.6035 | 0.6099 | 0.5689 | 3.501 | 1.607 |
| BehVig29r | 985 | 0.4989 | 0.5109 | 0.5164 | 0.4702 | 2.488 | 1.356 |
| BehVig30r | 984 | 0.6469 | 0.6572 | 0.6642 | 0.621 | 3.444 | 1.573 |
Non missing response frequency for each item
rownames(x$response.freq) <- recursive_escape(rownames(x$response.freq))
pander::pander(x$response.freq)| 1 | 2 | 3 | 4 | 5 | 6 | 7 | miss | |
|---|---|---|---|---|---|---|---|---|
| BehVig1 | 0.03411 | 0.04971 | 0.05166 | 0.05361 | 0.1199 | 0.1706 | 0.5205 | 0.4885 |
| BehVig2 | 0.02242 | 0.02924 | 0.03509 | 0.06335 | 0.09064 | 0.1637 | 0.5955 | 0.4885 |
| BehVig3 | 0.02827 | 0.04094 | 0.03996 | 0.08967 | 0.1647 | 0.2086 | 0.4279 | 0.4885 |
| BehVig4 | 0.03996 | 0.04386 | 0.06238 | 0.1053 | 0.1579 | 0.2164 | 0.3743 | 0.4885 |
| BehVig5 | 0.04386 | 0.07018 | 0.08382 | 0.1452 | 0.1686 | 0.2135 | 0.2749 | 0.4885 |
| BehVig6 | 0.2102 | 0.1955 | 0.1601 | 0.1454 | 0.166 | 0.08153 | 0.04126 | 0.4925 |
| BehVig7 | 0.11 | 0.1041 | 0.1238 | 0.1631 | 0.2092 | 0.1827 | 0.1071 | 0.4925 |
| BehVig8 | 0.03143 | 0.08939 | 0.1552 | 0.2053 | 0.1886 | 0.1788 | 0.1513 | 0.4925 |
| BehVig9 | 0.1493 | 0.1591 | 0.1473 | 0.2063 | 0.1945 | 0.08546 | 0.05796 | 0.4925 |
| BehVig10 | 0.1827 | 0.2014 | 0.1906 | 0.167 | 0.1149 | 0.07564 | 0.06778 | 0.4925 |
| BehVig11 | 0.06852 | 0.1539 | 0.1758 | 0.2145 | 0.2284 | 0.1003 | 0.05859 | 0.498 |
| BehVig12 | 0.07646 | 0.1807 | 0.138 | 0.1797 | 0.1976 | 0.1341 | 0.09335 | 0.498 |
| BehVig13 | 0.03376 | 0.06951 | 0.07349 | 0.1291 | 0.2284 | 0.2284 | 0.2373 | 0.498 |
| BehVig14 | 0.07349 | 0.1758 | 0.1738 | 0.1936 | 0.1817 | 0.1162 | 0.0854 | 0.498 |
| BehVig15 | 0.08342 | 0.1311 | 0.1271 | 0.1877 | 0.1966 | 0.1698 | 0.1043 | 0.498 |
| BehVig16 | 0.011 | 0.025 | 0.034 | 0.091 | 0.185 | 0.26 | 0.394 | 0.5015 |
| BehVig17 | 0.186 | 0.285 | 0.153 | 0.17 | 0.123 | 0.049 | 0.034 | 0.5015 |
| BehVig18 | 0.083 | 0.088 | 0.097 | 0.128 | 0.188 | 0.184 | 0.232 | 0.5015 |
| BehVig19 | 0.03 | 0.029 | 0.074 | 0.137 | 0.204 | 0.241 | 0.285 | 0.5015 |
| BehVig20 | 0.021 | 0.035 | 0.04 | 0.095 | 0.181 | 0.256 | 0.372 | 0.5015 |
| BehVig21 | 0.04053 | 0.06687 | 0.08409 | 0.1692 | 0.2756 | 0.2047 | 0.1591 | 0.508 |
| BehVig22 | 0.2036 | 0.2057 | 0.1317 | 0.1499 | 0.1408 | 0.0922 | 0.07599 | 0.508 |
| BehVig23 | 0.1185 | 0.1125 | 0.1246 | 0.1631 | 0.1945 | 0.153 | 0.1337 | 0.508 |
| BehVig24 | 0.2178 | 0.1874 | 0.1317 | 0.1277 | 0.1429 | 0.1125 | 0.08004 | 0.508 |
| BehVig25 | 0.02026 | 0.04661 | 0.08207 | 0.1155 | 0.2016 | 0.2209 | 0.3131 | 0.508 |
| BehVig26 | 0.05482 | 0.1503 | 0.2832 | 0.2223 | 0.1482 | 0.09442 | 0.0467 | 0.509 |
| BehVig27 | 0.01726 | 0.07513 | 0.1421 | 0.1858 | 0.1959 | 0.197 | 0.1868 | 0.509 |
| BehVig28 | 0.09645 | 0.2122 | 0.2203 | 0.2091 | 0.1452 | 0.06091 | 0.05584 | 0.509 |
| BehVig29 | 0.2619 | 0.331 | 0.1959 | 0.1239 | 0.05482 | 0.0203 | 0.01218 | 0.509 |
| BehVig30 | 0.09654 | 0.2022 | 0.2642 | 0.2022 | 0.1169 | 0.06809 | 0.0498 | 0.5095 |
| BehVig8r | 0.03143 | 0.08939 | 0.1552 | 0.2053 | 0.1886 | 0.1788 | 0.1513 | 0.4925 |
| BehVig26r | 0.05482 | 0.1503 | 0.2832 | 0.2223 | 0.1482 | 0.09442 | 0.0467 | 0.509 |
| BehVig27r | 0.01726 | 0.07513 | 0.1421 | 0.1858 | 0.1959 | 0.197 | 0.1868 | 0.509 |
| BehVig28r | 0.09645 | 0.2122 | 0.2203 | 0.2091 | 0.1452 | 0.06091 | 0.05584 | 0.509 |
| BehVig29r | 0.2619 | 0.331 | 0.1959 | 0.1239 | 0.05482 | 0.0203 | 0.01218 | 0.509 |
| BehVig30r | 0.09654 | 0.2022 | 0.2642 | 0.2022 | 0.1169 | 0.06809 | 0.0498 | 0.5095 |
Summary statistics
for (i in seq_along(names(items))) {
  attributes(items[[i]]) = recursive_escape(attributes(items[[i]]))
}
escaped_table(codebook_table(items))| name | label | data_type | value_labels | missing | complete | n | mean | sd | p0 | p25 | p50 | p75 | p100 | hist | format.spss | display_width |
|---|---|---|---|---|---|---|---|---|---|---|---|---|---|---|---|---|
| BehVig1 | Before I go to bed at night I double check to make sure the doors are securely locked. | numeric | 1. Never, 7. Always |
980 | 1026 | 2006 | 5.77 | 1.71 | 1 | 5 | 7 | 7 | 7 | ▁▁▁▁▁▂▂▇ | F8.0 | NA |
| BehVig2 | When someone rings/knocks at my door I ask who it is (or look through the peephole) before I open the door. | numeric | 1. Never, 7. Always |
980 | 1026 | 2006 | 6.04 | 1.51 | 1 | 6 | 7 | 7 | 7 | ▁▁▁▁▁▁▂▇ | F8.0 | NA |
| BehVig3 | I think twice before going out for a walk late at night. | numeric | 1. Never, 7. Always |
980 | 1026 | 2006 | 5.66 | 1.6 | 1 | 5 | 6 | 7 | 7 | ▁▁▁▂▁▃▃▇ | F8.0 | NA |
| BehVig4 | If I have to take the subway/bus alone at night I feel anxious | numeric | 1. Never, 7. Always |
980 | 1026 | 2006 | 5.44 | 1.71 | 1 | 4 | 6 | 7 | 7 | ▁▁▁▂▁▃▅▇ | F8.0 | NA |
| BehVig5 | I avoid going out alone at night | numeric | 1. Never, 7. Always |
980 | 1026 | 2006 | 5.06 | 1.77 | 1 | 4 | 5 | 7 | 7 | ▁▂▂▅▁▅▆▇ | F8.0 | NA |
| BehVig6 | I think about the shoes/clothes I am wearing in terms of my ability to run in a dangerous situation. | numeric | 1. Never, 7. Always |
988 | 1018 | 2006 | 3.27 | 1.78 | 1 | 2 | 3 | 5 | 7 | ▇▇▆▆▁▆▃▂ | F8.0 | NA |
| BehVig7 | When I am walking alone I think about where I would run if someone came after me. | numeric | 1. Never, 7. Always |
988 | 1018 | 2006 | 4.23 | 1.84 | 1 | 3 | 4 | 6 | 7 | ▅▃▅▆▁▇▇▅ | F8.0 | NA |
| BehVig8 | I feel confident walking alone late at night. | numeric | 7. Never, 1. Always |
988 | 1018 | 2006 | 4.57 | 1.65 | 1 | 3 | 5 | 6 | 7 | ▁▃▆▇▁▇▇▆ | F8.0 | NA |
| BehVig9 | I am especially careful of wearing the “proper” clothes. | numeric | 1. Never, 7. Always |
988 | 1018 | 2006 | 3.63 | 1.75 | 1 | 2 | 4 | 5 | 7 | ▆▆▆▇▁▇▃▂ | F8.0 | NA |
| BehVig10 | If I was waiting for an elevator and it arrived with one man alone inside, I would wait for the next one. | numeric | 1. Never, 7. Always |
988 | 1018 | 2006 | 3.33 | 1.79 | 1 | 2 | 3 | 5 | 7 | ▇▇▇▆▁▅▃▃ | F8.0 | NA |
| BehVig11 | I am wary of men. | numeric | 1. Never, 7. Always |
999 | 1007 | 2006 | 3.92 | 1.6 | 1 | 3 | 4 | 5 | 7 | ▂▆▆▇▁▇▃▂ | F8.0 | NA |
| BehVig12 | I am afraid of being sexually assaulted. | numeric | 1. Never, 7. Always |
999 | 1007 | 2006 | 4.02 | 1.77 | 1 | 2 | 4 | 5 | 7 | ▃▇▆▇▁▇▆▃ | F8.0 | NA |
| BehVig13 | If I have to walk outside late at night I take precautions. | numeric | 1. Never, 7. Always |
999 | 1007 | 2006 | 5.08 | 1.66 | 1 | 4 | 5 | 6 | 7 | ▁▂▂▅▁▇▇▇ | F8.0 | NA |
| BehVig14 | In general, I am suspicious of men. | numeric | 1. Never, 7. Always |
999 | 1007 | 2006 | 3.92 | 1.72 | 1 | 3 | 4 | 5 | 7 | ▃▇▇▇▁▇▅▃ | F8.0 | NA |
| BehVig15 | If it was dark and I had to walk to my car, I would make sure I was accompanied by someone I trusted. | numeric | 1. Never, 7. Always |
999 | 1007 | 2006 | 4.21 | 1.78 | 1 | 3 | 4 | 6 | 7 | ▃▅▅▇▁▇▇▅ | F8.0 | NA |
| BehVig16 | If I was driving alone and I had to park my car I would try to park on a well-lit street. | numeric | 1. Never, 7. Always |
1006 | 1000 | 2006 | 5.77 | 1.37 | 1 | 5 | 6 | 7 | 7 | ▁▁▁▂▁▃▅▇ | F8.0 | NA |
| BehVig17 | I am afraid to men. | numeric | 1. Never, 7. Always |
1006 | 1000 | 2006 | 3.04 | 1.64 | 1 | 2 | 3 | 4 | 7 | ▅▇▅▅▁▃▂▁ | F8.0 | NA |
| BehVig18 | I carry objects (keys, knife, something sharp) when I walk alone at night. | numeric | 1. Never, 7. Always |
1006 | 1000 | 2006 | 4.73 | 1.92 | 1 | 3 | 5 | 6 | 7 | ▃▃▃▅▁▆▆▇ | F8.0 | NA |
| BehVig19 | When I am choosing a seat on the bus or subway I am conscious of who is sitting nearby. | numeric | 1. Never, 7. Always |
1006 | 1000 | 2006 | 5.32 | 1.57 | 1 | 4 | 6 | 7 | 7 | ▁▁▂▃▁▆▇▇ | F8.0 | NA |
| BehVig20 | If I am going out late at night, I avoid certain parts of town. | numeric | 1. Never, 7. Always |
1006 | 1000 | 2006 | 5.64 | 1.5 | 1 | 5 | 6 | 7 | 7 | ▁▁▁▂▁▃▆▇ | F8.0 | NA |
| BehVig21 | When I get on the bus/streetcar/subway I take a seat that allows me to keep an eye on those sitting nearby. | numeric | 1. Never, 7. Always |
1019 | 987 | 2006 | 4.82 | 1.6 | 1 | 4 | 5 | 6 | 7 | ▁▂▂▅▁▇▆▅ | F8.0 | NA |
| BehVig22 | The possibility of rape affects my freedom of movement. | numeric | 1. Never, 7. Always |
1019 | 987 | 2006 | 3.4 | 1.9 | 1 | 2 | 3 | 5 | 7 | ▇▇▅▆▁▆▃▃ | F8.0 | NA |
| BehVig23 | I ask friends to walk me to my car/the subway if it late at night. | numeric | 1. Never, 7. Always |
1019 | 987 | 2006 | 4.2 | 1.9 | 1 | 3 | 4 | 6 | 7 | ▅▅▅▇▁▇▆▆ | F8.0 | NA |
| BehVig24 | I have turned down invitations/opportunities because I didn’t want to risk coming home alone afterwards. | numeric | 1. Never, 7. Always |
1019 | 987 | 2006 | 3.45 | 1.96 | 1 | 2 | 3 | 5 | 7 | ▇▇▅▅▁▅▅▃ | F8.0 | NA |
| BehVig25 | When I’m walking out alone at night I am very cautious. | numeric | 1. Never, 7. Always |
1019 | 987 | 2006 | 5.35 | 1.59 | 1 | 4 | 6 | 7 | 7 | ▁▁▂▃▁▅▆▇ | F8.0 | NA |
| BehVig26 | In general, how safe do you feel at night? | numeric | 7. Not at all safe, 1. Very safe |
1021 | 985 | 2006 | 3.73 | 1.5 | 1 | 3 | 4 | 5 | 7 | ▂▅▇▆▁▅▂▁ | F8.0 | NA |
| BehVig27 | How safe would you feel walking to your car alone if it was parked in an underground parking lot? | numeric | 7. Not at all safe, 1. Very safe |
1021 | 985 | 2006 | 4.81 | 1.62 | 1 | 4 | 5 | 6 | 7 | ▁▃▆▇▁▇▇▇ | F8.0 | NA |
| BehVig28 | How safe do you feel going into public washrooms in subways or malls? | numeric | 7. Not at all safe, 1. Very safe |
1021 | 985 | 2006 | 3.5 | 1.61 | 1 | 2 | 3 | 5 | 7 | ▃▇▇▇▁▅▂▂ | F8.0 | NA |
| BehVig29 | How safe do you feel in your apartment/house when you are by yourself? | numeric | 7. Not at all safe, 1. Very safe |
1021 | 985 | 2006 | 2.49 | 1.36 | 1 | 1 | 2 | 3 | 7 | ▆▇▅▃▁▁▁▁ | F8.0 | NA |
| BehVig30 | How safe do feel being out alone in your neighborhood at night? | numeric | 7. Not at all safe, 1. Very safe |
1022 | 984 | 2006 | 3.44 | 1.57 | 1 | 2 | 3 | 4 | 7 | ▃▆▇▆▁▃▂▂ | F8.0 | NA |
| BehVig8r | reverse-coded | numeric | NA | 988 | 1018 | 2006 | 4.57 | 1.65 | 1 | 3 | 5 | 6 | 7 | ▁▃▆▇▁▇▇▆ | F8.2 | 10 |
| BehVig26r | reverse-coded | numeric | NA | 1021 | 985 | 2006 | 3.73 | 1.5 | 1 | 3 | 4 | 5 | 7 | ▂▅▇▆▁▅▂▁ | F8.2 | 11 |
| BehVig27r | reverse-coded | numeric | NA | 1021 | 985 | 2006 | 4.81 | 1.62 | 1 | 4 | 5 | 6 | 7 | ▁▃▆▇▁▇▇▇ | F8.2 | 11 |
| BehVig28r | reverse-coded | numeric | NA | 1021 | 985 | 2006 | 3.5 | 1.61 | 1 | 2 | 3 | 5 | 7 | ▃▇▇▇▁▅▂▂ | F8.2 | 11 |
| BehVig29r | reverse-coded | numeric | NA | 1021 | 985 | 2006 | 2.49 | 1.36 | 1 | 1 | 2 | 3 | 7 | ▆▇▅▃▁▁▁▁ | F8.2 | 11 |
| BehVig30r | reverse-coded | numeric | NA | 1022 | 984 | 2006 | 3.44 | 1.57 | 1 | 2 | 3 | 4 | 7 | ▃▆▇▆▁▃▂▂ | F8.2 | 11 |
Scale: Matevalue
Overview
Reliability: Cronbach’s α [95% CI] = 0.91 [0.9;0.91].
Missing: 1049.
old_height <- knitr::opts_chunk$get("fig.height")
new_height <- length(scale_info$scale_item_names)
new_height <- ifelse(new_height > 20, 20, new_height)
new_height <- ifelse(new_height < 1, 1, new_height)
new_height <- ifelse(is.na(new_height) | is.nan(new_height),
old_height, new_height)
knitr::opts_chunk$set(fig.height = new_height)likert_plot <- likert_from_items(items)
if (!is.null(likert_plot)) {
graphics::plot(likert_plot)
}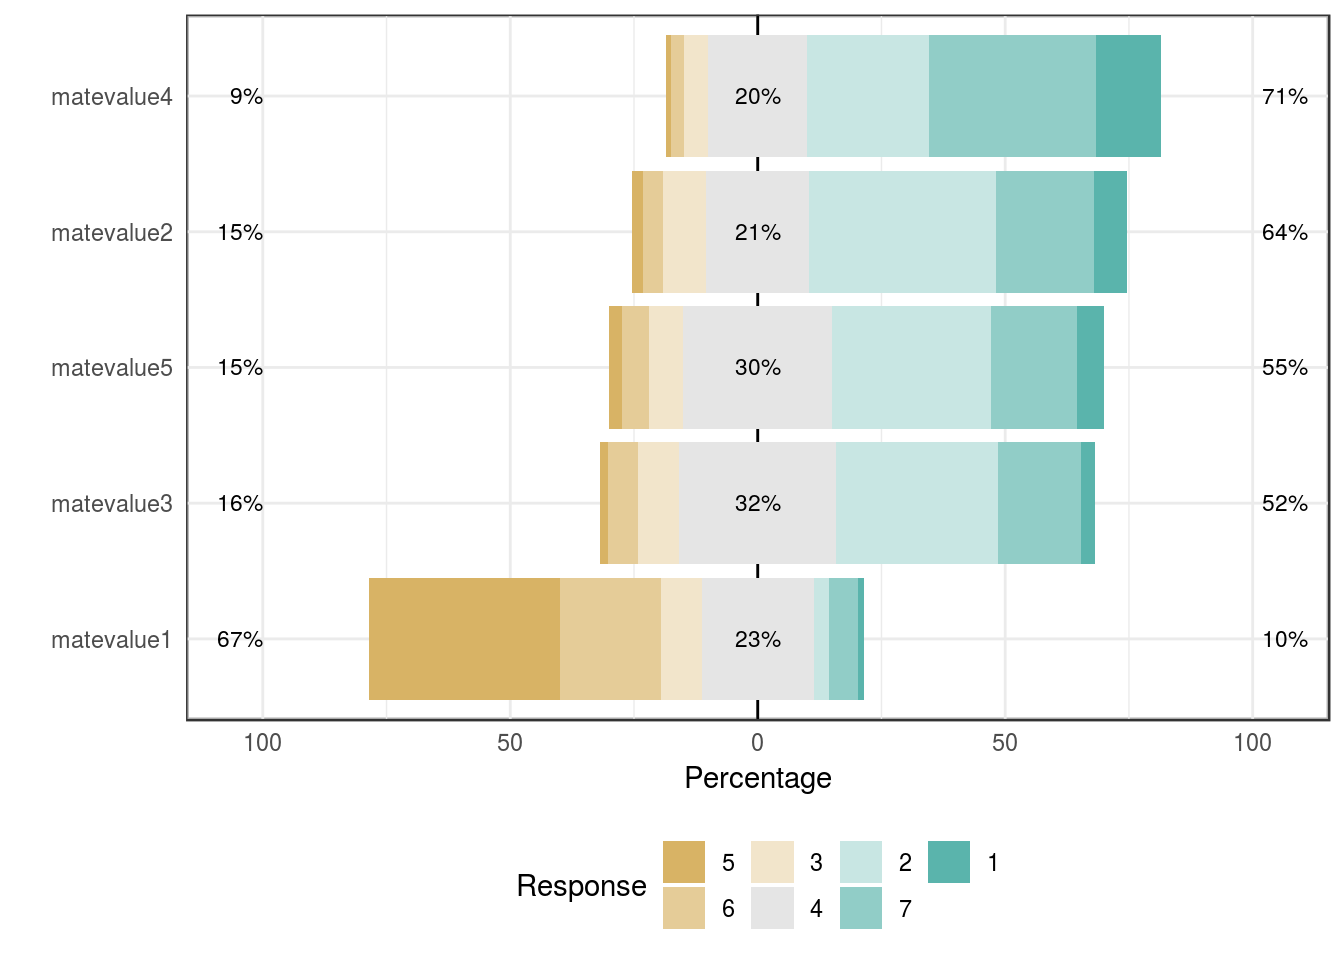
knitr::opts_chunk$set(fig.height = old_height)binwidth <- mean(diff(sort(unique(scale))))
wrap_at <- knitr::opts_chunk$get("fig.width") * 10dist_plot <- plot_labelled(scale, scale_name, wrap_at)
choices <- attributes(items[[1]])$item$choices
breaks <- as.numeric(names(choices))
if (length(breaks)) {
suppressMessages( # ignore message about overwriting x axis
dist_plot <- dist_plot +
ggplot2::scale_x_continuous("values",
breaks = breaks,
labels = stringr::str_wrap(unlist(choices), ceiling(wrap_at * 0.21))) +
ggplot2::expand_limits(x = range(breaks)))
}
dist_plot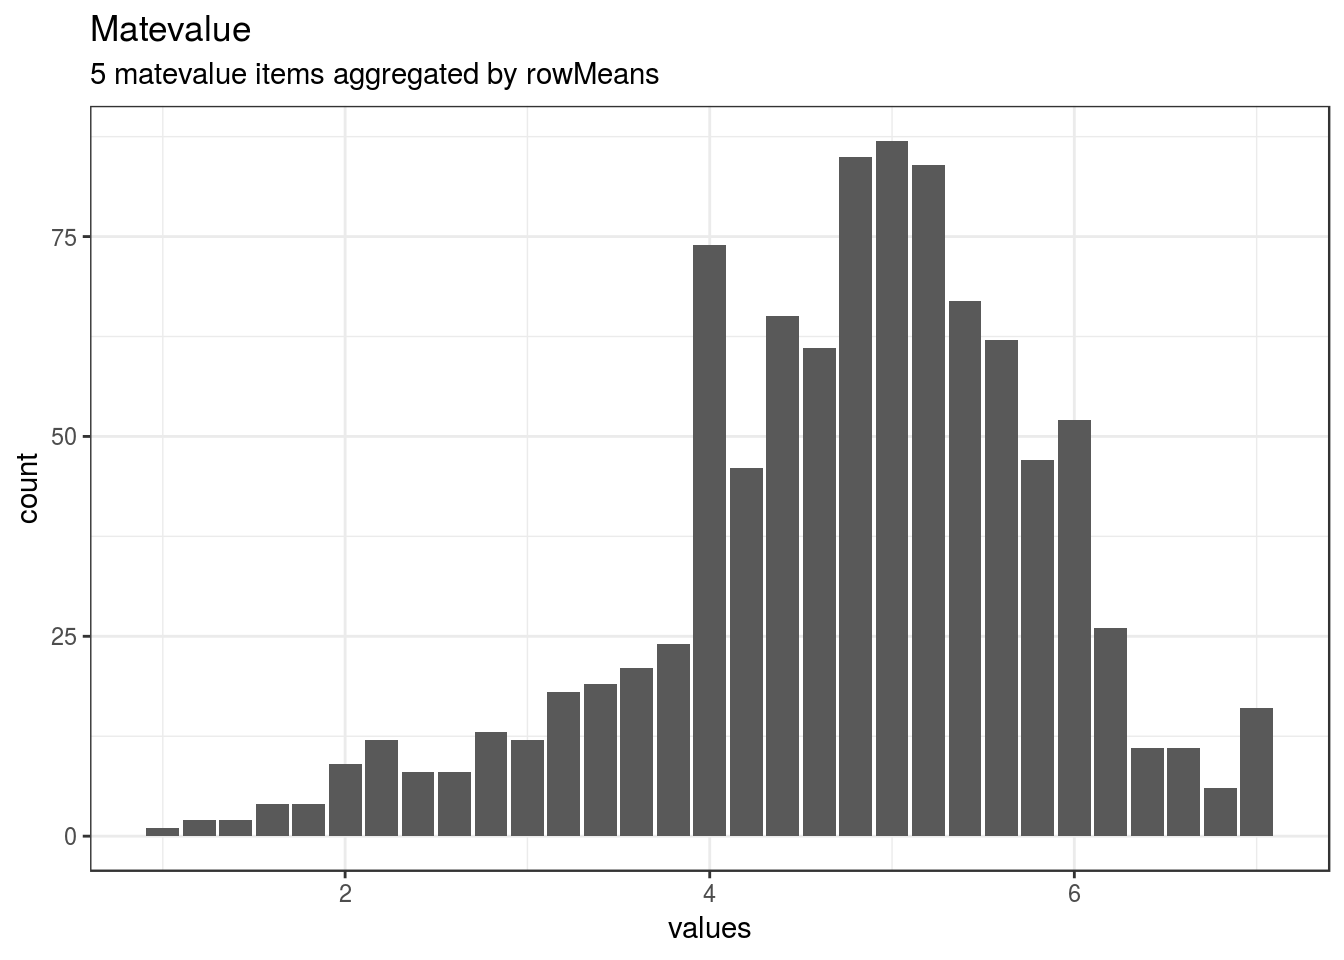
Reliability details
for (i in seq_along(reliabilities)) {
rel <- reliabilities[[i]]
cat(knitr::knit_print(rel, indent = paste0(indent, "####")))
}Reliability
95% Confidence Interval
if (!is.null(x$total$ase)) {
pander::pander(data.frame(lower = x$total$raw_alpha - 1.96 * x$total$ase,
estimate = x$total$raw_alpha,
upper = x$total$raw_alpha + 1.96 *
x$total$ase))
}| lower | estimate | upper |
|---|---|---|
| 0.9002 | 0.9066 | 0.9131 |
pander::pander(x$total)| raw_alpha | std.alpha | G6(smc) | average_r | S/N | ase | mean | sd | median_r |
|---|---|---|---|---|---|---|---|---|
| 0.9066 | 0.9073 | 0.8904 | 0.6619 | 9.79 | 0.003306 | 4.757 | 1.072 | 0.6547 |
Reliability if an item is dropped:
rownames(x$alpha.drop) <- recursive_escape(rownames(x$alpha.drop))
pander::pander(x$alpha.drop)| raw_alpha | std.alpha | G6(smc) | average_r | S/N | alpha se | var.r | med.r | |
|---|---|---|---|---|---|---|---|---|
| matevalue1 | 0.8826 | 0.8833 | 0.8524 | 0.6542 | 7.567 | 0.004291 | 0.001962 | 0.6532 |
| matevalue2 | 0.8847 | 0.8854 | 0.8545 | 0.6589 | 7.725 | 0.004204 | 0.001204 | 0.6516 |
| matevalue3 | 0.8794 | 0.8803 | 0.8509 | 0.6477 | 7.353 | 0.004412 | 0.002322 | 0.6402 |
| matevalue4 | 0.8973 | 0.898 | 0.872 | 0.6876 | 8.805 | 0.00375 | 0.001033 | 0.6832 |
| matevalue5 | 0.8856 | 0.8865 | 0.8586 | 0.6613 | 7.81 | 0.004193 | 0.002489 | 0.6653 |
Item statistics
rownames(x$item.stats) <- recursive_escape(rownames(x$item.stats))
pander::pander(x$item.stats)| n | raw.r | std.r | r.cor | r.drop | mean | sd | |
|---|---|---|---|---|---|---|---|
| matevalue1 | 958 | 0.8615 | 0.865 | 0.8247 | 0.7828 | 4.793 | 1.193 |
| matevalue2 | 958 | 0.8596 | 0.8585 | 0.8157 | 0.7711 | 4.742 | 1.29 |
| matevalue3 | 958 | 0.8722 | 0.8742 | 0.8369 | 0.7971 | 4.499 | 1.213 |
| matevalue4 | 957 | 0.8194 | 0.818 | 0.7462 | 0.7119 | 5.178 | 1.278 |
| matevalue5 | 958 | 0.8578 | 0.855 | 0.8064 | 0.7671 | 4.574 | 1.305 |
Non missing response frequency for each item
rownames(x$response.freq) <- recursive_escape(rownames(x$response.freq))
pander::pander(x$response.freq)| 1 | 2 | 3 | 4 | 5 | 6 | 7 | miss | |
|---|---|---|---|---|---|---|---|---|
| matevalue1 | 0.01148 | 0.03132 | 0.08246 | 0.2255 | 0.3852 | 0.2046 | 0.0595 | 0.5224 |
| matevalue2 | 0.02088 | 0.04175 | 0.08664 | 0.2077 | 0.3779 | 0.1983 | 0.06681 | 0.5224 |
| matevalue3 | 0.01461 | 0.06159 | 0.08351 | 0.3163 | 0.3267 | 0.1691 | 0.02818 | 0.5224 |
| matevalue4 | 0.01149 | 0.02508 | 0.04911 | 0.2006 | 0.2456 | 0.3386 | 0.1296 | 0.5229 |
| matevalue5 | 0.0261 | 0.05532 | 0.06889 | 0.3006 | 0.3205 | 0.1743 | 0.05428 | 0.5224 |
Summary statistics
for (i in seq_along(names(items))) {
attributes(items[[i]]) = recursive_escape(attributes(items[[i]]))
}
escaped_table(codebook_table(items))| name | label | data_type | missing | complete | n | mean | sd | p0 | p25 | p50 | p75 | p100 | hist | format.spss |
|---|---|---|---|---|---|---|---|---|---|---|---|---|---|---|
| matevalue1 | Overall, how would you rate your level of desirability as a partner on the following scale?-Your level of desirability as a partner | numeric | 1048 | 958 | 2006 | 4.79 | 1.19 | 1 | 4 | 5 | 6 | 7 | ▁▁▂▅▁▇▅▁ | F8.0 |
| matevalue2 | Overall, how would members of the opposite sex rate your level of desirability as a partner on th…-Opposite sex rating of your desirability as a partner | numeric | 1048 | 958 | 2006 | 4.74 | 1.29 | 1 | 4 | 5 | 6 | 7 | ▁▁▂▅▁▇▅▂ | F8.0 |
| matevalue3 | Overall, how would you believe you compare to other people in desirability as a partner on the fo…-Personal desirability comparison to other people | numeric | 1048 | 958 | 2006 | 4.5 | 1.21 | 1 | 4 | 5 | 5 | 7 | ▁▂▂▇▁▇▅▁ | F8.0 |
| matevalue4 | Overall, how good of a catch are you?-How good of a catch are you? | numeric | 1049 | 957 | 2006 | 5.18 | 1.28 | 1 | 4 | 5 | 6 | 7 | ▁▁▁▅▁▆▇▃ | F8.0 |
| matevalue5 | Overall, how physically attractive do you believe you are?-Personal physical attractiveness | numeric | 1048 | 958 | 2006 | 4.57 | 1.31 | 1 | 4 | 5 | 5 | 7 | ▁▂▂▇▁▇▅▂ | F8.0 |
Scale: RomInterest
Overview
Reliability: Cronbach’s α [95% CI] = 0.96 [0.96;0.97].
Missing: 1055.
old_height <- knitr::opts_chunk$get("fig.height")
new_height <- length(scale_info$scale_item_names)
new_height <- ifelse(new_height > 20, 20, new_height)
new_height <- ifelse(new_height < 1, 1, new_height)
new_height <- ifelse(is.na(new_height) | is.nan(new_height),
old_height, new_height)
knitr::opts_chunk$set(fig.height = new_height)likert_plot <- likert_from_items(items)
if (!is.null(likert_plot)) {
graphics::plot(likert_plot)
}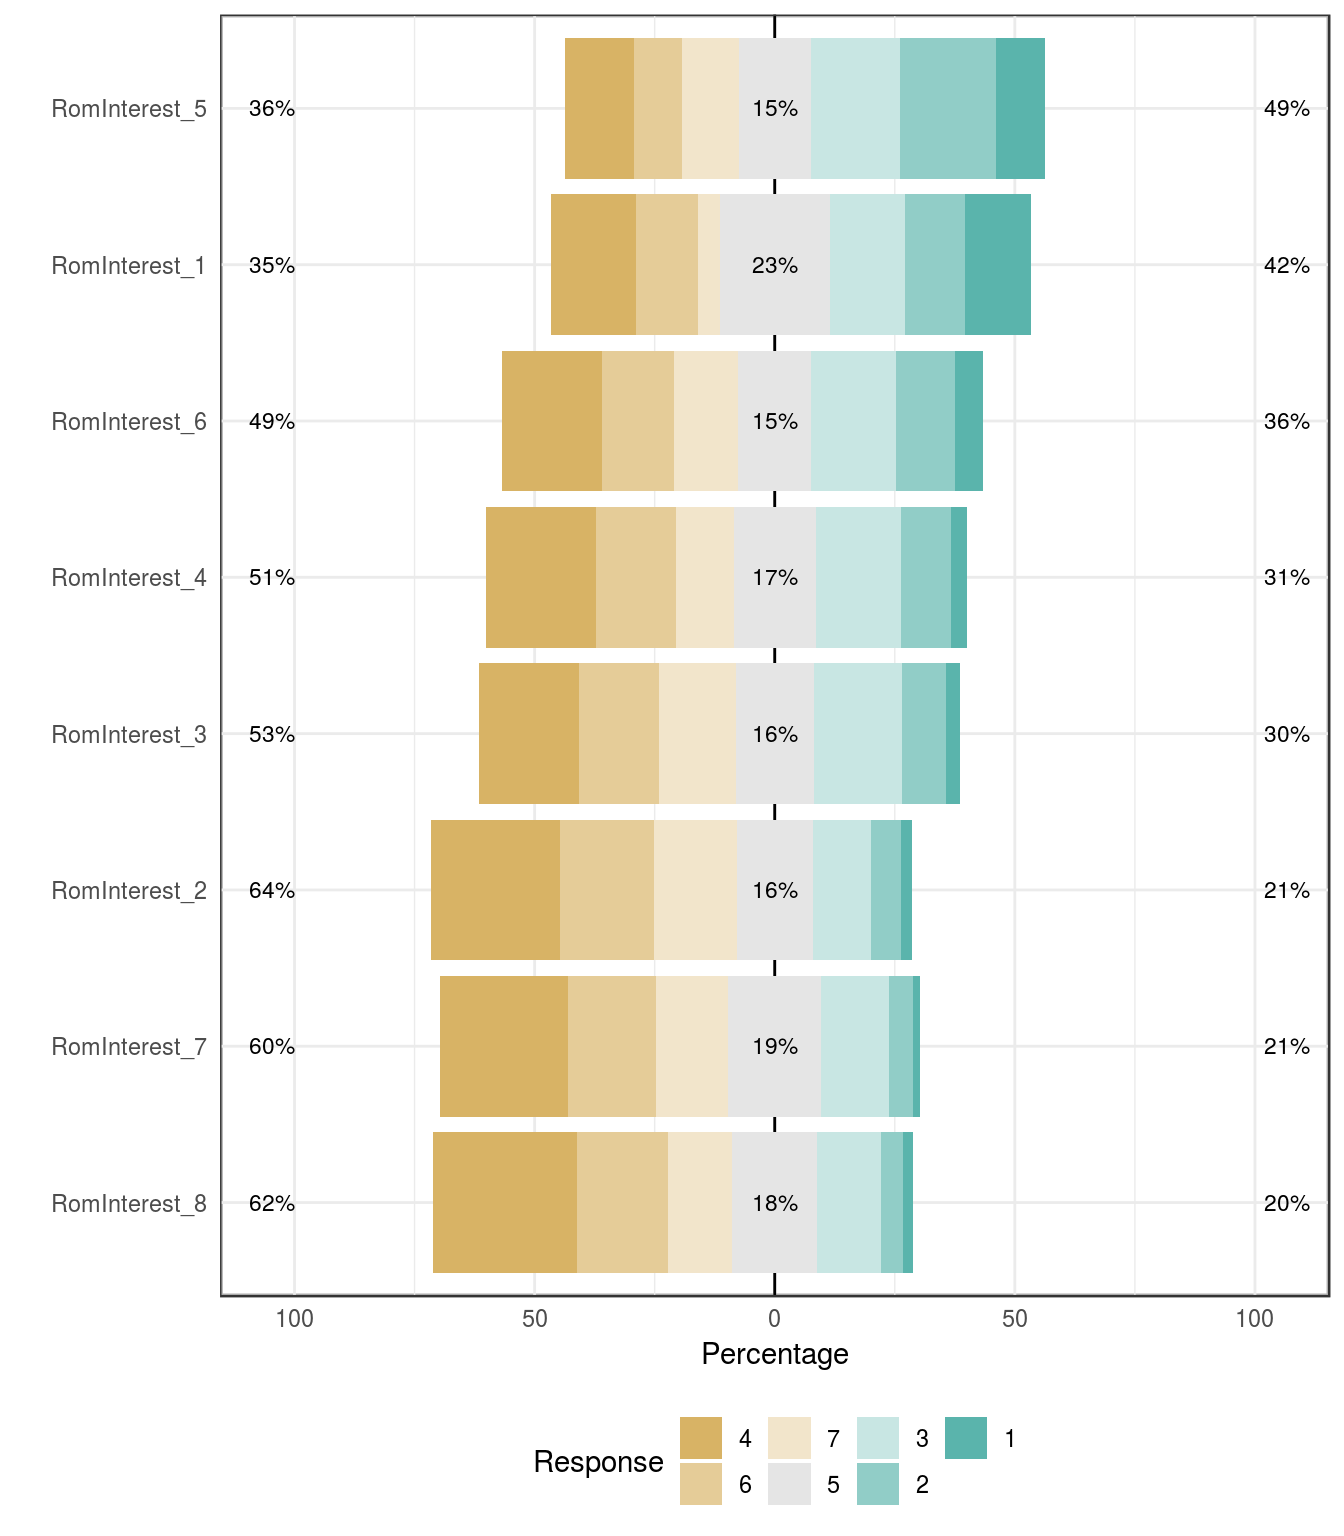
knitr::opts_chunk$set(fig.height = old_height)binwidth <- mean(diff(sort(unique(scale))))
wrap_at <- knitr::opts_chunk$get("fig.width") * 10dist_plot <- plot_labelled(scale, scale_name, wrap_at)
choices <- attributes(items[[1]])$item$choices
breaks <- as.numeric(names(choices))
if (length(breaks)) {
suppressMessages( # ignore message about overwriting x axis
dist_plot <- dist_plot +
ggplot2::scale_x_continuous("values",
breaks = breaks,
labels = stringr::str_wrap(unlist(choices), ceiling(wrap_at * 0.21))) +
ggplot2::expand_limits(x = range(breaks)))
}
dist_plot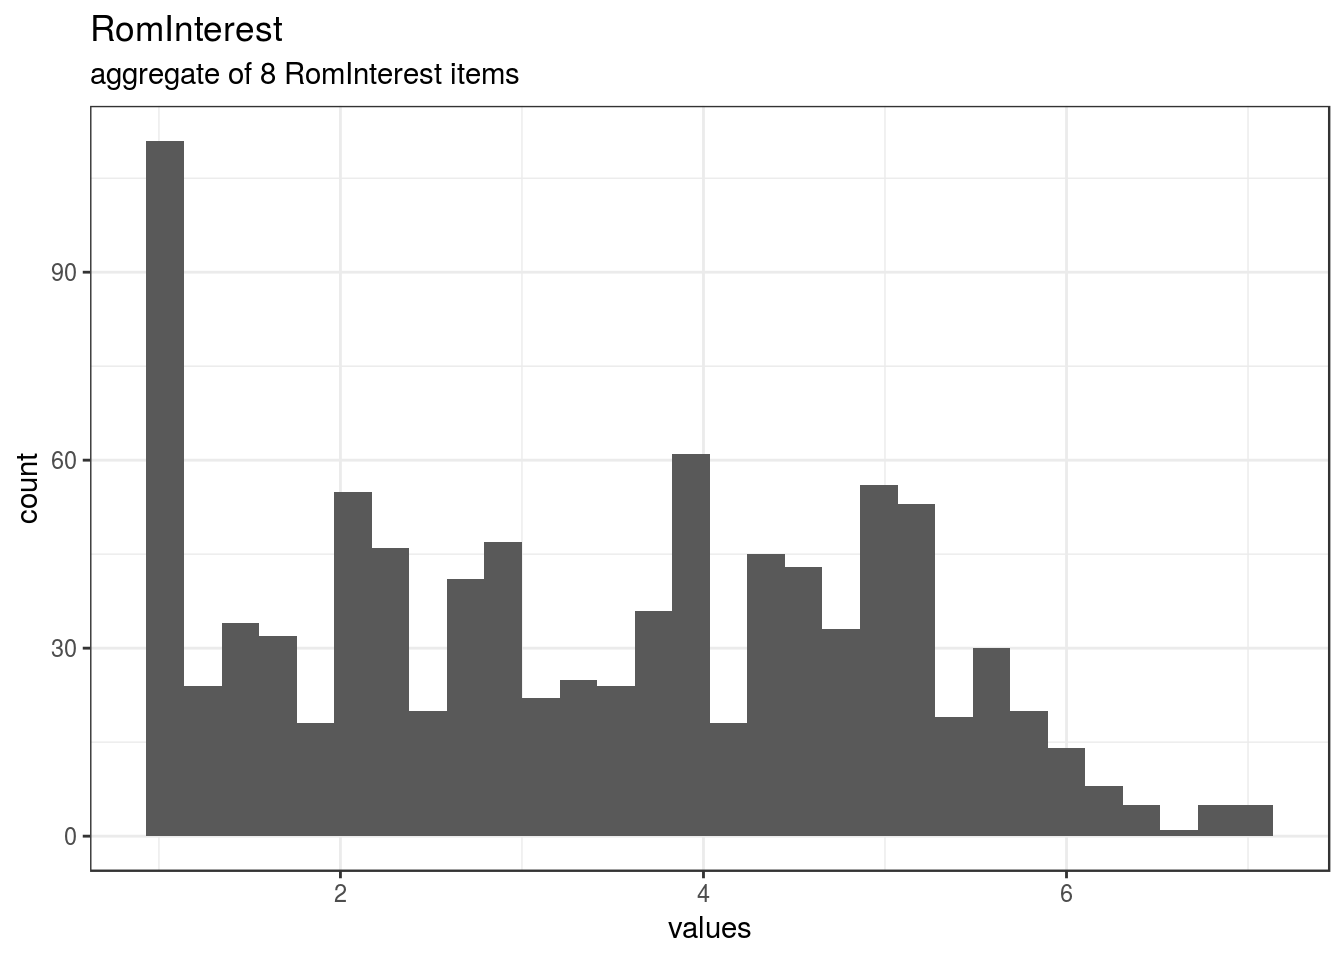
Reliability details
for (i in seq_along(reliabilities)) {
rel <- reliabilities[[i]]
cat(knitr::knit_print(rel, indent = paste0(indent, "####")))
}Reliability
95% Confidence Interval
if (!is.null(x$total$ase)) {
pander::pander(data.frame(lower = x$total$raw_alpha - 1.96 * x$total$ase,
estimate = x$total$raw_alpha,
upper = x$total$raw_alpha + 1.96 *
x$total$ase))
}| lower | estimate | upper |
|---|---|---|
| 0.961 | 0.9635 | 0.9659 |
pander::pander(x$total)| raw_alpha | std.alpha | G6(smc) | average_r | S/N | ase | mean | sd | median_r |
|---|---|---|---|---|---|---|---|---|
| 0.9635 | 0.9639 | 0.9642 | 0.7694 | 26.69 | 0.001232 | 3.37 | 1.578 | 0.7646 |
Reliability if an item is dropped:
rownames(x$alpha.drop) <- recursive_escape(rownames(x$alpha.drop))
pander::pander(x$alpha.drop)| raw_alpha | std.alpha | G6(smc) | average_r | S/N | alpha se | var.r | med.r | |
|---|---|---|---|---|---|---|---|---|
| RomInterest_1 | 0.9555 | 0.9562 | 0.9547 | 0.7571 | 21.81 | 0.001514 | 0.002119 | 0.7564 |
| RomInterest_2 | 0.9584 | 0.9588 | 0.959 | 0.7689 | 23.29 | 0.001418 | 0.002979 | 0.7613 |
| RomInterest_3 | 0.9607 | 0.9614 | 0.9616 | 0.7805 | 24.9 | 0.001342 | 0.002411 | 0.7812 |
| RomInterest_4 | 0.9556 | 0.9562 | 0.9555 | 0.757 | 21.81 | 0.001517 | 0.00234 | 0.7466 |
| RomInterest_5 | 0.9587 | 0.9591 | 0.9578 | 0.77 | 23.44 | 0.001412 | 0.002375 | 0.7679 |
| RomInterest_6 | 0.9593 | 0.9597 | 0.9598 | 0.773 | 23.84 | 0.001391 | 0.002855 | 0.7679 |
| RomInterest_7 | 0.9596 | 0.9599 | 0.9574 | 0.7739 | 23.96 | 0.001372 | 0.002426 | 0.7679 |
| RomInterest_8 | 0.9597 | 0.9601 | 0.957 | 0.7747 | 24.06 | 0.001364 | 0.0022 | 0.779 |
Item statistics
rownames(x$item.stats) <- recursive_escape(rownames(x$item.stats))
pander::pander(x$item.stats)| n | raw.r | std.r | r.cor | r.drop | mean | sd | |
|---|---|---|---|---|---|---|---|
| RomInterest_1 | 952 | 0.9308 | 0.9297 | 0.9252 | 0.9082 | 3.807 | 1.739 |
| RomInterest_2 | 952 | 0.8926 | 0.8949 | 0.8763 | 0.8599 | 2.947 | 1.684 |
| RomInterest_3 | 951 | 0.8607 | 0.8606 | 0.8309 | 0.8178 | 3.335 | 1.748 |
| RomInterest_4 | 952 | 0.93 | 0.9298 | 0.9237 | 0.9058 | 3.346 | 1.817 |
| RomInterest_5 | 952 | 0.8958 | 0.8916 | 0.8765 | 0.8583 | 4.141 | 1.926 |
| RomInterest_6 | 952 | 0.8862 | 0.8828 | 0.8606 | 0.8464 | 3.536 | 1.89 |
| RomInterest_7 | 952 | 0.876 | 0.8801 | 0.8631 | 0.8398 | 2.97 | 1.64 |
| RomInterest_8 | 952 | 0.8744 | 0.8779 | 0.8621 | 0.8366 | 2.875 | 1.682 |
Non missing response frequency for each item
rownames(x$response.freq) <- recursive_escape(rownames(x$response.freq))
pander::pander(x$response.freq)| 1 | 2 | 3 | 4 | 5 | 6 | 7 | miss | |
|---|---|---|---|---|---|---|---|---|
| RomInterest_1 | 0.1376 | 0.125 | 0.1565 | 0.1765 | 0.229 | 0.1292 | 0.04622 | 0.5254 |
| RomInterest_2 | 0.2668 | 0.1975 | 0.1712 | 0.1586 | 0.1208 | 0.06197 | 0.02311 | 0.5254 |
| RomInterest_3 | 0.2072 | 0.1672 | 0.1598 | 0.1619 | 0.184 | 0.09253 | 0.02734 | 0.5259 |
| RomInterest_4 | 0.2279 | 0.167 | 0.1197 | 0.1712 | 0.1775 | 0.104 | 0.03256 | 0.5254 |
| RomInterest_5 | 0.145 | 0.09979 | 0.1176 | 0.1492 | 0.1859 | 0.2006 | 0.1019 | 0.5254 |
| RomInterest_6 | 0.208 | 0.1502 | 0.1334 | 0.1513 | 0.1775 | 0.1229 | 0.05672 | 0.5254 |
| RomInterest_7 | 0.2658 | 0.1838 | 0.1502 | 0.1943 | 0.1418 | 0.04937 | 0.01471 | 0.5254 |
| RomInterest_8 | 0.2994 | 0.1901 | 0.1334 | 0.1775 | 0.1334 | 0.04517 | 0.02101 | 0.5254 |
Summary statistics
for (i in seq_along(names(items))) {
attributes(items[[i]]) = recursive_escape(attributes(items[[i]]))
}
escaped_table(codebook_table(items))| name | label | data_type | missing | complete | n | mean | sd | p0 | p25 | p50 | p75 | p100 | hist | format.spss |
|---|---|---|---|---|---|---|---|---|---|---|---|---|---|---|
| RomInterest_1 | How likely are you to accept a date with this person? | numeric | 1054 | 952 | 2006 | 3.81 | 1.74 | 1 | 2 | 4 | 5 | 7 | ▅▅▆▆▁▇▅▂ | F8.0 |
| RomInterest_2 | How likely are you to initiate a date with this person? | numeric | 1054 | 952 | 2006 | 2.95 | 1.68 | 1 | 1 | 3 | 4 | 7 | ▇▆▅▅▁▃▂▁ | F8.0 |
| RomInterest_3 | How likely are you to consider this person for a short-term relationship? | numeric | 1055 | 951 | 2006 | 3.34 | 1.75 | 1 | 2 | 3 | 5 | 7 | ▇▆▆▆▁▇▃▁ | F8.0 |
| RomInterest_4 | How likely are you to consider this person for a long-term relationship? | numeric | 1054 | 952 | 2006 | 3.35 | 1.82 | 1 | 2 | 3 | 5 | 7 | ▇▆▅▆▁▆▃▁ | F8.0 |
| RomInterest_5 | How likely are you to meet this person for coffee in the afternoon? | numeric | 1054 | 952 | 2006 | 4.14 | 1.93 | 1 | 3 | 4 | 6 | 7 | ▆▃▅▆▁▇▇▅ | F8.0 |
| RomInterest_6 | How likely are you to meet this person for drinks at night? | numeric | 1054 | 952 | 2006 | 3.54 | 1.89 | 1 | 2 | 4 | 5 | 7 | ▇▆▅▆▁▇▅▂ | F8.0 |
| RomInterest_7 | How physically attracted to this person are you? | numeric | 1054 | 952 | 2006 | 2.97 | 1.64 | 1 | 1 | 3 | 4 | 7 | ▇▆▅▆▁▅▂▁ | F8.0 |
| RomInterest_8 | How romantically attracted to this person are you? | numeric | 1054 | 952 | 2006 | 2.88 | 1.68 | 1 | 1 | 3 | 4 | 7 | ▇▅▃▅▁▃▁▁ | F8.0 |
missingness_reportMissingness report
Among those who finished the survey. Only variables that have missing values are shown.
if ( exists("ended", results) &&
exists("expired", results)) {
finisher_results <- dplyr::filter(results, !is.na(.data$ended))
} else {
finisher_results <- results
warning("Could not figure out who finished the surveys, because the ",
"variables expired and ended were missing.")
}## Warning: Could not figure out who finished the surveys, because the
## variables expired and ended were missing.if (length(md_pattern)) {
pander::pander(md_pattern)
}| description | keepdrop | startdate | enddate | filter_$ | conriskkeepdrop | ConsentAgree | gender | sexorien | hormcon | education | single | age | citizen | annualincome | race_2 | completedsurvey | duplicateID | compensated | turkprimegender | vsc | Cvsc | BehVig1 | BehVig2 | BehVig3 | BehVig4 | BehVig5 | BehVig6 | BehVig7 | BehVig8 | BehVig9 | BehVig10 | BehVig8r | AttentionCheck | BehVig11 | BehVig12 | BehVig13 | BehVig14 | BehVig15 | BehVig16 | BehVig17 | BehVig18 | BehVig19 | BehVig20 | BehVig21 | BehVig22 | BehVig23 | BehVig24 | BehVig25 | BehVig26 | BehVig27 | BehVig28 | BehVig29 | BehVig26r | BehVig27r | BehVig28r | BehVig29r | BehVig30 | BehVig30r | BehVig | Menstruated | MenstStop | HRT | CycleLengthAcc_1 | attentioncheckpf | HorCon3mon | PerNextAcc_1 | carelessresponding | PerBefLastAcc_1 | PerNext | LastPeriodAcc_1 | LastPeriod | PerBefLast | matevalue | matevalue1 | matevalue2 | matevalue3 | matevalue5 | matevalue4 | Matevalue | targetincome | targetformidability | targetgroupstatus | targetphoto | groupXincome | groupXformid | groupXvsc | incomeXformid | incomeXvsc | formidXvsc | groupXincomeXformid | groupXincomeXvsc | groupXformidXvsc | incomeXformidXvsc | groupXincomeXformidXvsc | rominterest | targetnationality | RomInterest_1 | RomInterest_2 | RomInterest_4 | RomInterest_5 | RomInterest_6 | RomInterest_7 | RomInterest_8 | MC1nationality | MC2income | MC3hobbies | MC4age | RomInterest_3 | MC5profession | MC2incomecorrect | MC3hobbiescorrect | RomInterest | MC1nationalitycorrect | conriskexclusion | groupXincomeXformidXcrisk | groupXincomeXformidXcriskXvsc | incomeXformidXcrisk | incomeXformidXcriskXvsc | groupXformidXcrisk | groupXformidXcriskXvsc | groupXincomeXcrisk | groupXincomeXcriskXvsc | formidXcrisk | formidXcriskXvsc | groupXcrisk | incomeXcrisk | groupXcriskXvsc | incomeXcriskXvsc | weightedaveragecycle | weightedaveragecyclerounded | daysfromovulation | conceptionrisk | Cconceptionrisk | criskXvsc | demoexclusioncriteria | race_1 | race_3 | race_5 | race_4 | race_6 | race_7 | var_miss | n_miss |
|---|---|---|---|---|---|---|---|---|---|---|---|---|---|---|---|---|---|---|---|---|---|---|---|---|---|---|---|---|---|---|---|---|---|---|---|---|---|---|---|---|---|---|---|---|---|---|---|---|---|---|---|---|---|---|---|---|---|---|---|---|---|---|---|---|---|---|---|---|---|---|---|---|---|---|---|---|---|---|---|---|---|---|---|---|---|---|---|---|---|---|---|---|---|---|---|---|---|---|---|---|---|---|---|---|---|---|---|---|---|---|---|---|---|---|---|---|---|---|---|---|---|---|---|---|---|---|---|---|---|---|---|---|---|---|---|---|---|---|---|---|---|---|---|
| Missing values per variable | 3 | 4 | 4 | 5 | 6 | 10 | 93 | 93 | 93 | 93 | 93 | 94 | 94 | 95 | 232 | 499 | 933 | 933 | 947 | 980 | 980 | 980 | 980 | 980 | 980 | 980 | 988 | 988 | 988 | 988 | 988 | 988 | 999 | 999 | 999 | 999 | 999 | 999 | 1006 | 1006 | 1006 | 1006 | 1006 | 1019 | 1019 | 1019 | 1019 | 1019 | 1021 | 1021 | 1021 | 1021 | 1021 | 1021 | 1021 | 1021 | 1022 | 1022 | 1022 | 1041 | 1041 | 1041 | 1041 | 1042 | 1042 | 1042 | 1043 | 1044 | 1045 | 1046 | 1047 | 1047 | 1048 | 1048 | 1048 | 1048 | 1048 | 1049 | 1049 | 1053 | 1053 | 1053 | 1053 | 1053 | 1053 | 1053 | 1053 | 1053 | 1053 | 1053 | 1053 | 1053 | 1053 | 1053 | 1054 | 1054 | 1054 | 1054 | 1054 | 1054 | 1054 | 1054 | 1054 | 1054 | 1054 | 1054 | 1054 | 1055 | 1055 | 1055 | 1055 | 1055 | 1056 | 1063 | 1077 | 1077 | 1103 | 1103 | 1106 | 1106 | 1111 | 1111 | 1156 | 1156 | 1168 | 1168 | 1168 | 1168 | 1269 | 1270 | 1270 | 1272 | 1272 | 1272 | 1790 | 1939 | 1980 | 1983 | 2006 | 2006 | 2006 | 139369 | 139369 |
| Missing values in 7 variables | 1 | 1 | 1 | 1 | 1 | 1 | 1 | 1 | 1 | 1 | 1 | 1 | 1 | 1 | 1 | 1 | 1 | 1 | 1 | 1 | 1 | 1 | 1 | 1 | 1 | 1 | 1 | 1 | 1 | 1 | 1 | 1 | 1 | 1 | 1 | 1 | 1 | 1 | 1 | 1 | 1 | 1 | 1 | 1 | 1 | 1 | 1 | 1 | 1 | 1 | 1 | 1 | 1 | 1 | 1 | 1 | 1 | 1 | 1 | 1 | 1 | 1 | 1 | 1 | 1 | 1 | 1 | 1 | 1 | 1 | 1 | 1 | 1 | 1 | 1 | 1 | 1 | 1 | 1 | 1 | 1 | 1 | 1 | 1 | 1 | 1 | 1 | 1 | 1 | 1 | 1 | 1 | 1 | 1 | 1 | 1 | 1 | 1 | 1 | 1 | 1 | 1 | 1 | 1 | 1 | 1 | 1 | 1 | 1 | 1 | 1 | 1 | 1 | 1 | 1 | 1 | 1 | 1 | 1 | 1 | 1 | 1 | 1 | 1 | 1 | 1 | 1 | 1 | 1 | 1 | 1 | 1 | 1 | 1 | 0 | 0 | 0 | 0 | 0 | 0 | 0 | 7 | 555 |
| Missing values in 126 variables | 1 | 1 | 1 | 1 | 1 | 1 | 1 | 1 | 1 | 1 | 1 | 1 | 1 | 1 | 1 | 0 | 0 | 0 | 0 | 0 | 0 | 0 | 0 | 0 | 0 | 0 | 0 | 0 | 0 | 0 | 0 | 0 | 0 | 0 | 0 | 0 | 0 | 0 | 0 | 0 | 0 | 0 | 0 | 0 | 0 | 0 | 0 | 0 | 0 | 0 | 0 | 0 | 0 | 0 | 0 | 0 | 0 | 0 | 0 | 0 | 0 | 0 | 0 | 0 | 0 | 0 | 0 | 0 | 0 | 0 | 0 | 0 | 0 | 0 | 0 | 0 | 0 | 0 | 0 | 0 | 0 | 0 | 0 | 0 | 0 | 0 | 0 | 0 | 0 | 0 | 0 | 0 | 0 | 0 | 0 | 0 | 0 | 0 | 0 | 0 | 0 | 0 | 0 | 0 | 0 | 0 | 0 | 0 | 0 | 0 | 0 | 0 | 0 | 0 | 0 | 0 | 0 | 0 | 0 | 0 | 0 | 0 | 0 | 0 | 0 | 0 | 0 | 0 | 0 | 0 | 0 | 0 | 0 | 0 | 0 | 0 | 0 | 0 | 0 | 0 | 0 | 126 | 344 |
| Missing values in 125 variables | 1 | 1 | 1 | 1 | 1 | 1 | 1 | 1 | 1 | 1 | 1 | 1 | 1 | 1 | 1 | 1 | 0 | 0 | 0 | 0 | 0 | 0 | 0 | 0 | 0 | 0 | 0 | 0 | 0 | 0 | 0 | 0 | 0 | 0 | 0 | 0 | 0 | 0 | 0 | 0 | 0 | 0 | 0 | 0 | 0 | 0 | 0 | 0 | 0 | 0 | 0 | 0 | 0 | 0 | 0 | 0 | 0 | 0 | 0 | 0 | 0 | 0 | 0 | 0 | 0 | 0 | 0 | 0 | 0 | 0 | 0 | 0 | 0 | 0 | 0 | 0 | 0 | 0 | 0 | 0 | 0 | 0 | 0 | 0 | 0 | 0 | 0 | 0 | 0 | 0 | 0 | 0 | 0 | 0 | 0 | 0 | 0 | 0 | 0 | 0 | 0 | 0 | 0 | 0 | 0 | 0 | 0 | 0 | 0 | 0 | 0 | 0 | 0 | 0 | 0 | 0 | 0 | 0 | 0 | 0 | 0 | 0 | 0 | 0 | 0 | 0 | 0 | 0 | 0 | 0 | 0 | 0 | 0 | 0 | 0 | 0 | 0 | 0 | 0 | 0 | 0 | 125 | 290 |
| Missing values in 6 variables | 1 | 1 | 1 | 1 | 1 | 1 | 1 | 1 | 1 | 1 | 1 | 1 | 1 | 1 | 1 | 1 | 1 | 1 | 1 | 1 | 1 | 1 | 1 | 1 | 1 | 1 | 1 | 1 | 1 | 1 | 1 | 1 | 1 | 1 | 1 | 1 | 1 | 1 | 1 | 1 | 1 | 1 | 1 | 1 | 1 | 1 | 1 | 1 | 1 | 1 | 1 | 1 | 1 | 1 | 1 | 1 | 1 | 1 | 1 | 1 | 1 | 1 | 1 | 1 | 1 | 1 | 1 | 1 | 1 | 1 | 1 | 1 | 1 | 1 | 1 | 1 | 1 | 1 | 1 | 1 | 1 | 1 | 1 | 1 | 1 | 1 | 1 | 1 | 1 | 1 | 1 | 1 | 1 | 1 | 1 | 1 | 1 | 1 | 1 | 1 | 1 | 1 | 1 | 1 | 1 | 1 | 1 | 1 | 1 | 1 | 1 | 1 | 1 | 1 | 1 | 1 | 1 | 1 | 1 | 1 | 1 | 1 | 1 | 1 | 1 | 1 | 1 | 1 | 1 | 1 | 1 | 1 | 1 | 1 | 1 | 0 | 0 | 0 | 0 | 0 | 0 | 6 | 165 |
| Missing values in 122 variables | 1 | 1 | 1 | 1 | 1 | 1 | 1 | 1 | 1 | 1 | 1 | 1 | 1 | 1 | 1 | 1 | 1 | 1 | 1 | 0 | 0 | 0 | 0 | 0 | 0 | 0 | 0 | 0 | 0 | 0 | 0 | 0 | 0 | 0 | 0 | 0 | 0 | 0 | 0 | 0 | 0 | 0 | 0 | 0 | 0 | 0 | 0 | 0 | 0 | 0 | 0 | 0 | 0 | 0 | 0 | 0 | 0 | 0 | 0 | 0 | 0 | 0 | 0 | 0 | 0 | 0 | 0 | 0 | 0 | 0 | 0 | 0 | 0 | 0 | 0 | 0 | 0 | 0 | 0 | 0 | 0 | 0 | 0 | 0 | 0 | 0 | 0 | 0 | 0 | 0 | 0 | 0 | 0 | 0 | 0 | 0 | 0 | 0 | 0 | 0 | 0 | 0 | 0 | 0 | 0 | 0 | 0 | 0 | 0 | 0 | 0 | 0 | 0 | 0 | 0 | 0 | 0 | 0 | 0 | 0 | 0 | 0 | 0 | 0 | 0 | 0 | 0 | 0 | 0 | 0 | 0 | 0 | 0 | 0 | 0 | 0 | 0 | 0 | 0 | 0 | 0 | 122 | 69 |
| Missing values in 134 variables | 1 | 1 | 1 | 1 | 1 | 1 | 0 | 0 | 0 | 0 | 0 | 0 | 0 | 0 | 0 | 1 | 0 | 0 | 0 | 0 | 0 | 0 | 0 | 0 | 0 | 0 | 0 | 0 | 0 | 0 | 0 | 0 | 0 | 0 | 0 | 0 | 0 | 0 | 0 | 0 | 0 | 0 | 0 | 0 | 0 | 0 | 0 | 0 | 0 | 0 | 0 | 0 | 0 | 0 | 0 | 0 | 0 | 0 | 0 | 0 | 0 | 0 | 0 | 0 | 0 | 0 | 0 | 0 | 0 | 0 | 0 | 0 | 0 | 0 | 0 | 0 | 0 | 0 | 0 | 0 | 0 | 0 | 0 | 0 | 0 | 0 | 0 | 0 | 0 | 0 | 0 | 0 | 0 | 0 | 0 | 0 | 0 | 0 | 0 | 0 | 0 | 0 | 0 | 0 | 0 | 0 | 0 | 0 | 0 | 0 | 0 | 0 | 0 | 0 | 0 | 0 | 0 | 0 | 0 | 0 | 0 | 0 | 0 | 0 | 0 | 0 | 0 | 0 | 0 | 0 | 0 | 0 | 0 | 0 | 0 | 0 | 0 | 0 | 0 | 0 | 0 | 134 | 48 |
| Missing values in 126 variables | 1 | 1 | 1 | 1 | 1 | 1 | 1 | 1 | 1 | 1 | 1 | 1 | 1 | 1 | 0 | 1 | 0 | 0 | 0 | 0 | 0 | 0 | 0 | 0 | 0 | 0 | 0 | 0 | 0 | 0 | 0 | 0 | 0 | 0 | 0 | 0 | 0 | 0 | 0 | 0 | 0 | 0 | 0 | 0 | 0 | 0 | 0 | 0 | 0 | 0 | 0 | 0 | 0 | 0 | 0 | 0 | 0 | 0 | 0 | 0 | 0 | 0 | 0 | 0 | 0 | 0 | 0 | 0 | 0 | 0 | 0 | 0 | 0 | 0 | 0 | 0 | 0 | 0 | 0 | 0 | 0 | 0 | 0 | 0 | 0 | 0 | 0 | 0 | 0 | 0 | 0 | 0 | 0 | 0 | 0 | 0 | 0 | 0 | 0 | 0 | 0 | 0 | 0 | 0 | 0 | 0 | 0 | 0 | 0 | 0 | 0 | 0 | 0 | 0 | 0 | 0 | 0 | 0 | 0 | 0 | 0 | 0 | 0 | 0 | 0 | 0 | 0 | 0 | 0 | 0 | 0 | 0 | 0 | 0 | 0 | 0 | 0 | 0 | 0 | 0 | 0 | 126 | 42 |
| Missing values in 126 variables | 1 | 1 | 1 | 1 | 1 | 1 | 1 | 1 | 1 | 1 | 1 | 1 | 1 | 1 | 0 | 0 | 0 | 0 | 0 | 0 | 0 | 0 | 0 | 0 | 0 | 0 | 0 | 0 | 0 | 0 | 0 | 0 | 0 | 0 | 0 | 0 | 0 | 0 | 0 | 0 | 0 | 0 | 0 | 0 | 0 | 0 | 0 | 0 | 0 | 0 | 0 | 0 | 0 | 0 | 0 | 0 | 0 | 0 | 0 | 0 | 0 | 0 | 0 | 0 | 0 | 0 | 0 | 0 | 0 | 0 | 0 | 0 | 0 | 0 | 0 | 0 | 0 | 0 | 0 | 0 | 0 | 0 | 0 | 0 | 0 | 0 | 0 | 0 | 0 | 0 | 0 | 0 | 0 | 0 | 0 | 0 | 0 | 0 | 0 | 0 | 0 | 0 | 0 | 0 | 0 | 0 | 0 | 0 | 0 | 0 | 0 | 0 | 0 | 0 | 0 | 0 | 0 | 0 | 0 | 0 | 0 | 0 | 0 | 0 | 0 | 0 | 0 | 0 | 0 | 0 | 0 | 0 | 0 | 0 | 0 | 1 | 0 | 0 | 0 | 0 | 0 | 126 | 31 |
| Missing values in 135 variables | 1 | 1 | 1 | 1 | 1 | 1 | 0 | 0 | 0 | 0 | 0 | 0 | 0 | 0 | 0 | 0 | 0 | 0 | 0 | 0 | 0 | 0 | 0 | 0 | 0 | 0 | 0 | 0 | 0 | 0 | 0 | 0 | 0 | 0 | 0 | 0 | 0 | 0 | 0 | 0 | 0 | 0 | 0 | 0 | 0 | 0 | 0 | 0 | 0 | 0 | 0 | 0 | 0 | 0 | 0 | 0 | 0 | 0 | 0 | 0 | 0 | 0 | 0 | 0 | 0 | 0 | 0 | 0 | 0 | 0 | 0 | 0 | 0 | 0 | 0 | 0 | 0 | 0 | 0 | 0 | 0 | 0 | 0 | 0 | 0 | 0 | 0 | 0 | 0 | 0 | 0 | 0 | 0 | 0 | 0 | 0 | 0 | 0 | 0 | 0 | 0 | 0 | 0 | 0 | 0 | 0 | 0 | 0 | 0 | 0 | 0 | 0 | 0 | 0 | 0 | 0 | 0 | 0 | 0 | 0 | 0 | 0 | 0 | 0 | 0 | 0 | 0 | 0 | 0 | 0 | 0 | 0 | 0 | 0 | 0 | 0 | 0 | 0 | 0 | 0 | 0 | 135 | 27 |
| Missing values in 19 variables | 1 | 1 | 1 | 1 | 1 | 1 | 1 | 1 | 1 | 1 | 1 | 1 | 1 | 1 | 1 | 1 | 1 | 1 | 1 | 1 | 1 | 1 | 1 | 1 | 1 | 1 | 1 | 1 | 1 | 1 | 1 | 1 | 1 | 1 | 1 | 1 | 1 | 1 | 1 | 1 | 1 | 1 | 1 | 1 | 1 | 1 | 1 | 1 | 1 | 1 | 1 | 1 | 1 | 1 | 1 | 1 | 1 | 1 | 1 | 1 | 1 | 1 | 1 | 1 | 1 | 1 | 1 | 1 | 1 | 1 | 1 | 1 | 1 | 1 | 1 | 1 | 1 | 1 | 1 | 1 | 1 | 1 | 1 | 1 | 1 | 1 | 1 | 1 | 1 | 1 | 1 | 1 | 1 | 1 | 1 | 1 | 1 | 1 | 1 | 1 | 1 | 1 | 1 | 1 | 1 | 1 | 1 | 1 | 1 | 1 | 1 | 1 | 1 | 1 | 1 | 1 | 1 | 1 | 1 | 1 | 0 | 0 | 1 | 1 | 0 | 0 | 0 | 0 | 0 | 0 | 0 | 0 | 0 | 0 | 0 | 0 | 0 | 0 | 0 | 0 | 0 | 19 | 24 |
| Missing values in 15 variables | 1 | 1 | 1 | 1 | 1 | 1 | 1 | 1 | 1 | 1 | 1 | 1 | 1 | 1 | 1 | 1 | 1 | 1 | 1 | 1 | 1 | 1 | 1 | 1 | 1 | 1 | 1 | 1 | 1 | 1 | 1 | 1 | 1 | 1 | 1 | 1 | 1 | 1 | 1 | 1 | 1 | 1 | 1 | 1 | 1 | 1 | 1 | 1 | 1 | 1 | 1 | 1 | 1 | 1 | 1 | 1 | 1 | 1 | 1 | 1 | 1 | 1 | 1 | 1 | 1 | 1 | 1 | 1 | 1 | 1 | 1 | 1 | 1 | 1 | 1 | 1 | 1 | 1 | 1 | 1 | 1 | 1 | 1 | 1 | 1 | 1 | 1 | 1 | 1 | 1 | 1 | 1 | 1 | 1 | 1 | 1 | 1 | 1 | 1 | 1 | 1 | 1 | 1 | 1 | 1 | 1 | 1 | 1 | 1 | 1 | 1 | 1 | 1 | 1 | 1 | 1 | 1 | 1 | 1 | 1 | 1 | 1 | 1 | 1 | 1 | 0 | 1 | 0 | 0 | 0 | 0 | 0 | 0 | 0 | 0 | 0 | 0 | 0 | 0 | 0 | 0 | 15 | 21 |
| Missing values in 19 variables | 1 | 1 | 1 | 1 | 1 | 1 | 1 | 1 | 1 | 1 | 1 | 1 | 1 | 1 | 1 | 1 | 1 | 1 | 1 | 1 | 1 | 1 | 1 | 1 | 1 | 1 | 1 | 1 | 1 | 1 | 1 | 1 | 1 | 1 | 1 | 1 | 1 | 1 | 1 | 1 | 1 | 1 | 1 | 1 | 1 | 1 | 1 | 1 | 1 | 1 | 1 | 1 | 1 | 1 | 1 | 1 | 1 | 1 | 1 | 1 | 1 | 1 | 1 | 1 | 1 | 1 | 1 | 1 | 1 | 1 | 1 | 1 | 1 | 1 | 1 | 1 | 1 | 1 | 1 | 1 | 1 | 1 | 1 | 1 | 1 | 1 | 1 | 1 | 1 | 1 | 1 | 1 | 1 | 1 | 1 | 1 | 1 | 1 | 1 | 1 | 1 | 1 | 1 | 1 | 1 | 1 | 1 | 1 | 1 | 1 | 1 | 1 | 1 | 1 | 1 | 1 | 1 | 1 | 0 | 0 | 1 | 1 | 0 | 0 | 0 | 1 | 0 | 1 | 0 | 0 | 0 | 0 | 0 | 0 | 0 | 0 | 0 | 0 | 0 | 0 | 0 | 19 | 21 |
| 102 other, less frequent patterns | 101 | 100 | 100 | 99 | 98 | 98 | 95 | 95 | 95 | 95 | 95 | 94 | 94 | 93 | 83 | 82 | 64 | 64 | 56 | 71 | 71 | 71 | 71 | 71 | 71 | 71 | 68 | 68 | 68 | 68 | 68 | 68 | 66 | 66 | 66 | 66 | 66 | 66 | 63 | 63 | 63 | 63 | 63 | 61 | 61 | 61 | 61 | 61 | 59 | 59 | 59 | 59 | 59 | 59 | 59 | 59 | 58 | 58 | 58 | 55 | 55 | 55 | 55 | 52 | 54 | 54 | 51 | 52 | 51 | 50 | 49 | 49 | 49 | 49 | 49 | 49 | 49 | 48 | 48 | 45 | 45 | 45 | 45 | 45 | 45 | 45 | 45 | 45 | 45 | 45 | 45 | 45 | 45 | 45 | 44 | 44 | 44 | 44 | 44 | 44 | 44 | 44 | 44 | 44 | 44 | 44 | 44 | 43 | 43 | 43 | 43 | 43 | 42 | 44 | 41 | 41 | 35 | 35 | 36 | 36 | 39 | 39 | 25 | 25 | 30 | 28 | 30 | 28 | 16 | 15 | 15 | 13 | 13 | 13 | 15 | 7 | 5 | 7 | 0 | 0 | 0 | 6956 | 369 |
itemsCodebook table
export_table(metadata_table)jsonld