Edit: Authors’ response
The authors of the study have responded to the points raised here. You can read their response here. We had a little bit of follow-up discussion on Twitter. In all, I found this was a productive exchange and I’m happy the authors took the time to respond in such detail.
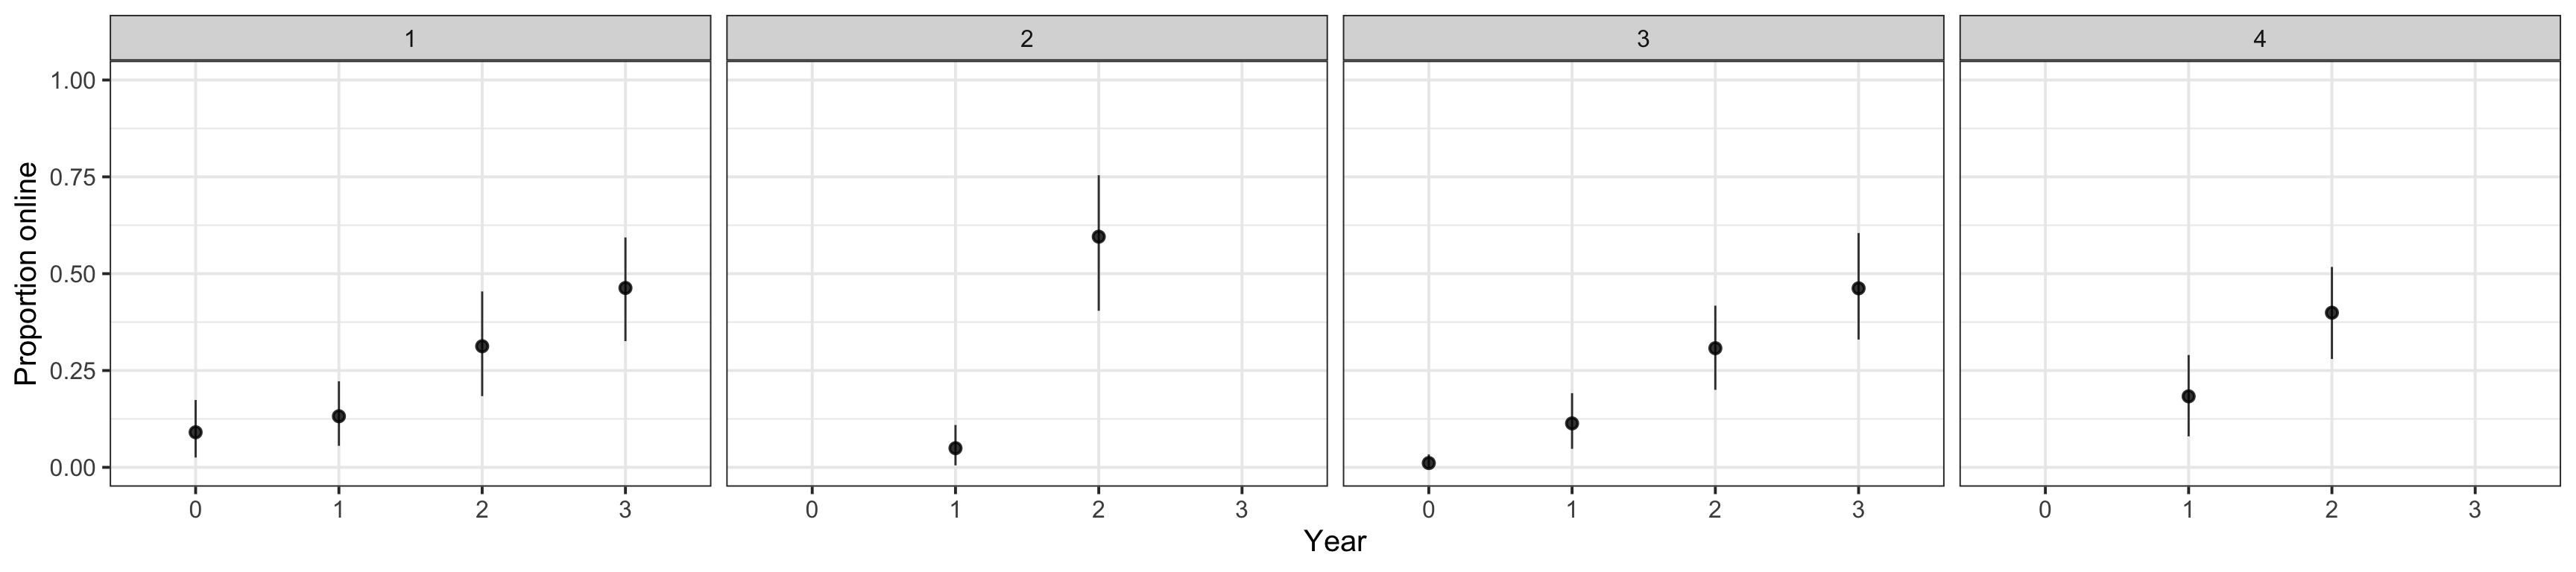
Figure 1: Change in proportion of studies that are online over time by journal. Bootstrapped means and 95% CIs.
Sassenberg and Ditrich published a paper in Advances in Methods and Practices in Psychological Science in May. It’s on a topic I care about deeply, namely the impact of changes in academic culture on research quality. Specifically, the authors were interested whether social psychologists have responded to the replication crisis in their subdiscipline and subsequent cries for higher methodological rigour (especially higher statistical power) by switching to less effortful methods of data collection (self-report).
I was not a reviewer of the paper, but given that I’ve already re-analyzed the N-pact paper, it felt only appropriate to do the same with this paper. I decided to do this post in the format of HIBAR.1 I think it’s an important topic and the authors collected valuable data, which surely took a lot of coding effort. The authors, regrettably, did not share any figures for their data. Their findings, which are easily summarised graphically, may therefore become less widely known. So, I made some figures from the open data (above and below).
I frequently hear arguments of the form “calls for rigour in some practices will just lead to less rigour in other areas”, “labour-intensive research will go extinct if higher sample sizes are required” from senior researchers. These arguments are often used to urge caution in response to calls for reform. They may end up being interpreted as advocacy for the status quo.
Empirical evidence that given consistent publication pressure, researchers urged to increase their sample sizes will do less rigorous research in other ways is thus worrying.2
Major points
Omitted variables
- The authors mention a number of coded variables analysed that they say are not relevant for the questions addressed here. I disagree with this assessment. The broader question is whether low-effort methods of data collection such as self-report and online research have replaced high-effort methods. However, the differences in effort for running an effective online study (especially when first learning about online research) versus running a lab study on undergraduates are smaller and more arguable than the differences in effort for running a study online vs. on a population-representative sample or a community sample. The same holds true for self-report and reaction time measures (both not very high-effort) versus e.g. genetic, or endocrinological data, intelligence testing, or observer coding. So, as a reader I would like to know whether self-report and online research replaced other low-effort or high-effort modes of data collection. The researchers disclose that they also coded study design, exclusion of participants, student vs. nonstudent sample, mediation analysis, behavioral measures, response times, memory measures, performance measures, coding of written materials, and physiological measures. Given that the authors give no strong rationale for excluding this data from analyses and given the absence of a preregistration, the omission of these data seems unjustifiable and should be rectified to give readers a fuller picture.
Wasteful sample size transformation
- The authors winsorize sample size. I do not think this is an appropriate treatment of this continuous variable. Yes, there are outlying values, but these are presumably not the result of miscoding, but the result of massive heterogeneity. A study of 10000 people really is a hundred times as big as a study of 100 people. There are better ways to deal with non-normally distributed statistics without discarding information. As an example, I chose to plot the logarithmised sample sizes below.
Figures
- Figures are essential for communicating data and effect sizes effectively. I took the liberty of generating a few figures below. What I would like to see in addition is figures on the omitted variables. Further inferential testing is, in my opinion, not necessary. We are interested in some measure of overall rigour, but there will be no agreeable way to aggregate the different variables into one measure of rigour, so the best we can do is present the data and discuss it.
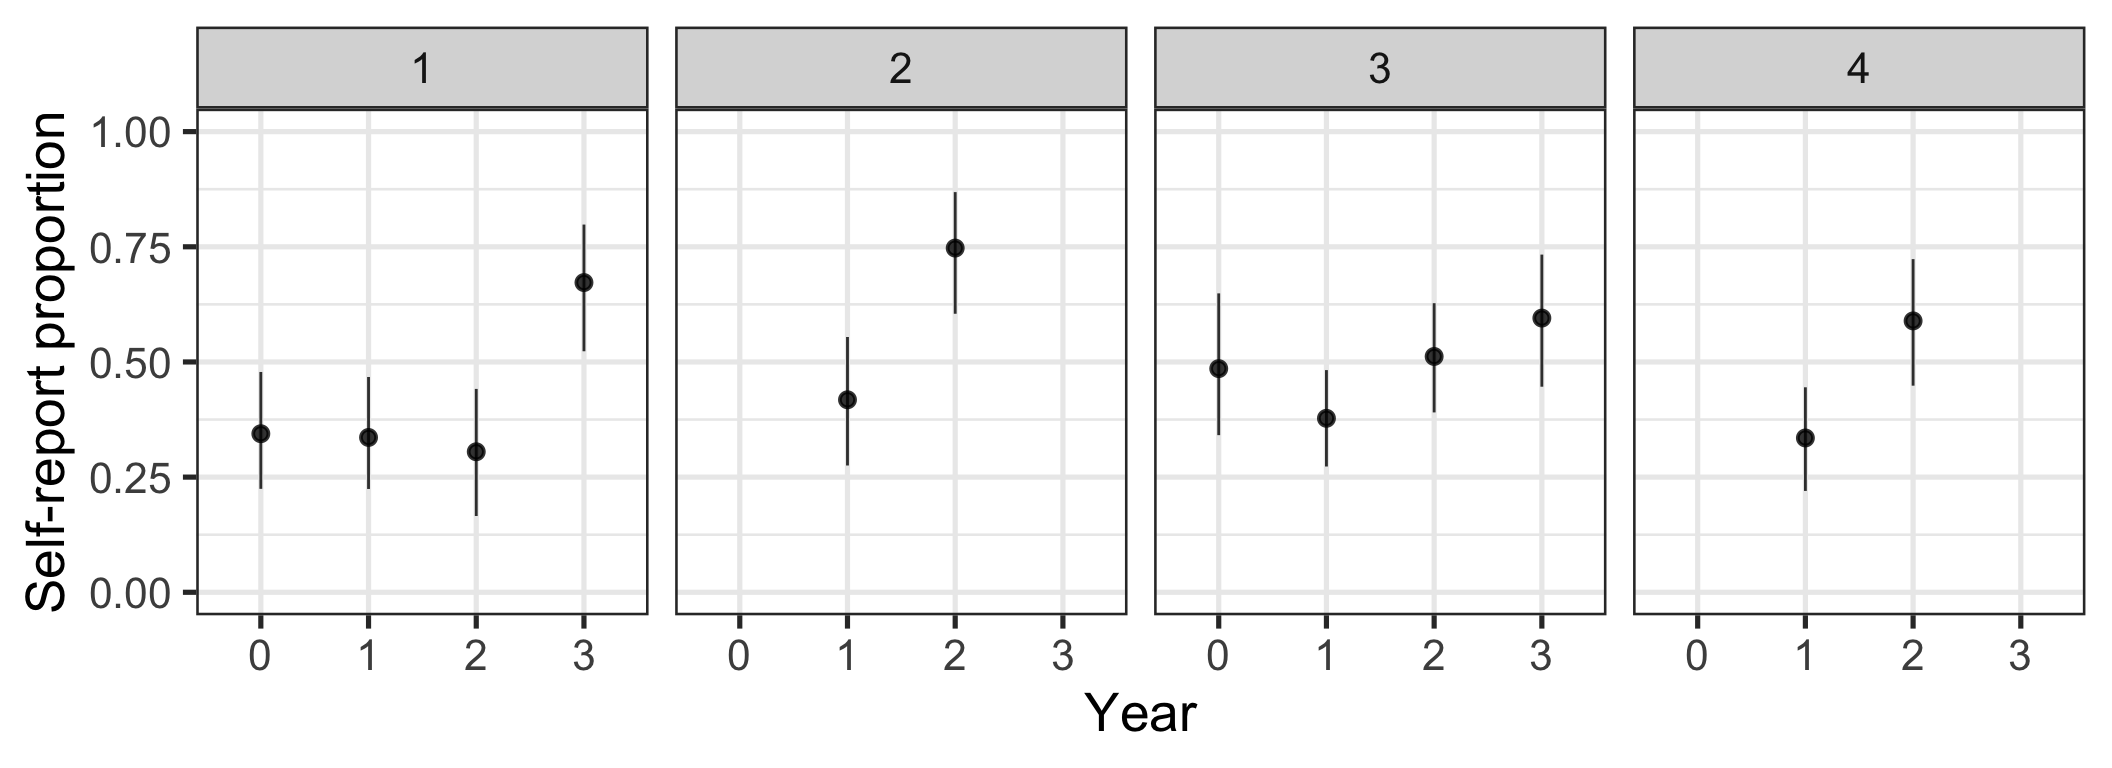
Figure 2: Change in proportion of studies that use only self-report over time by journal. Bootstrapped means and 95% CIs.
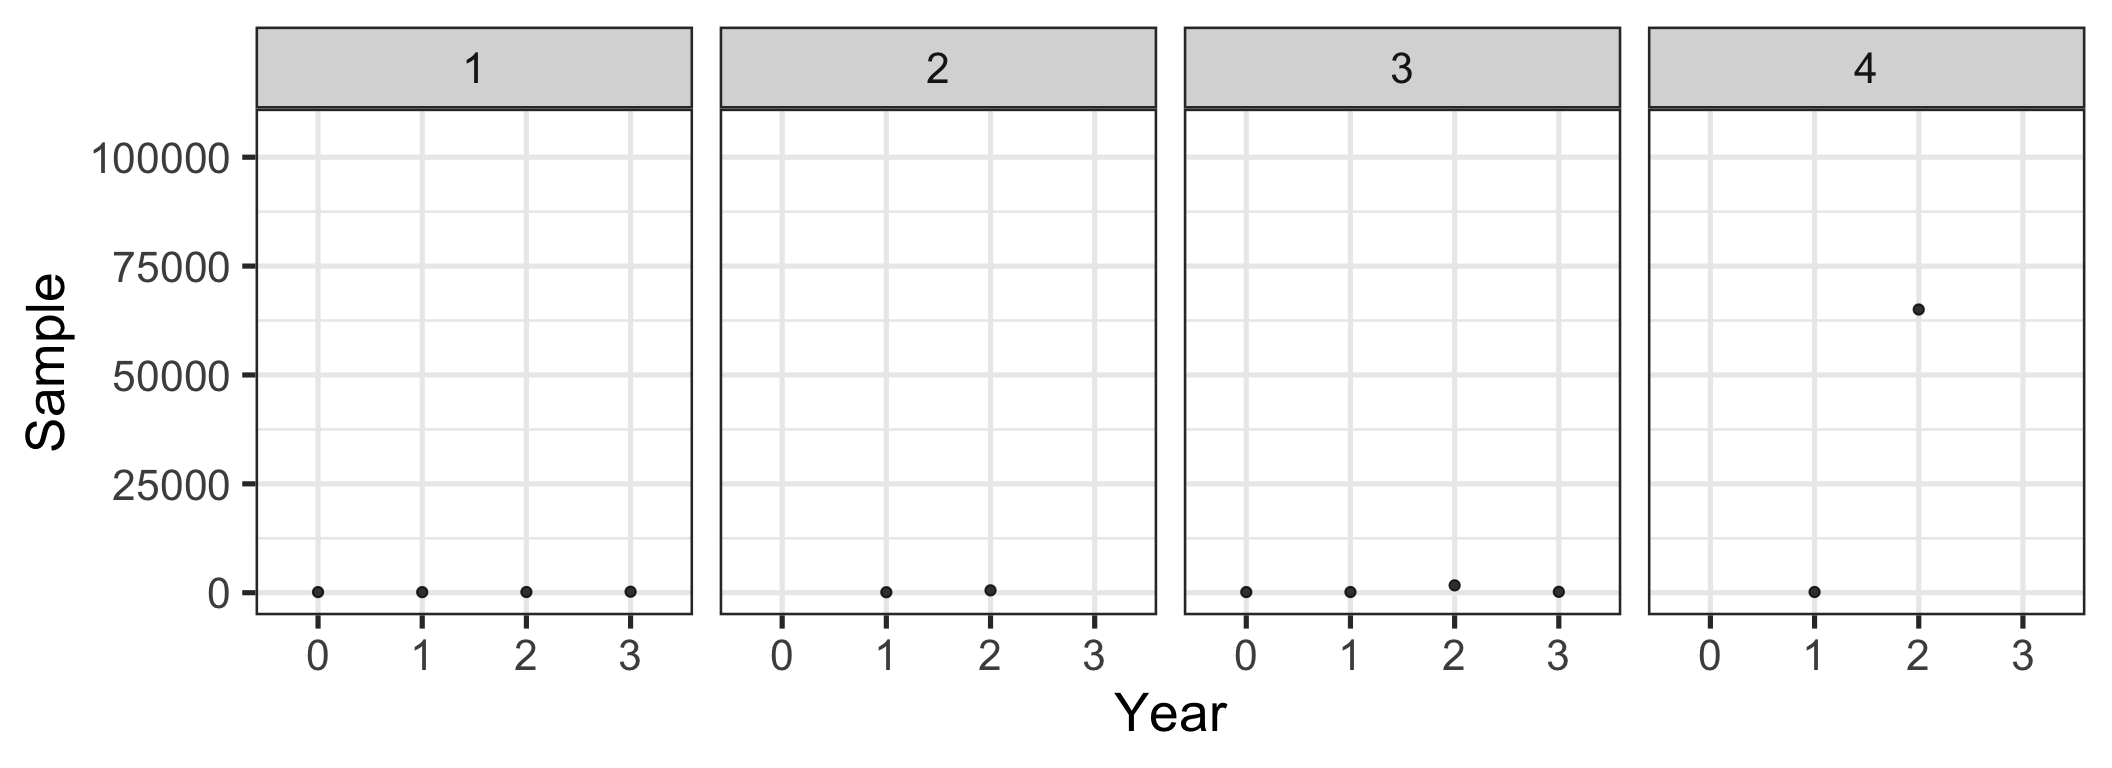
Figure 3: Change in median sample size over time by journal
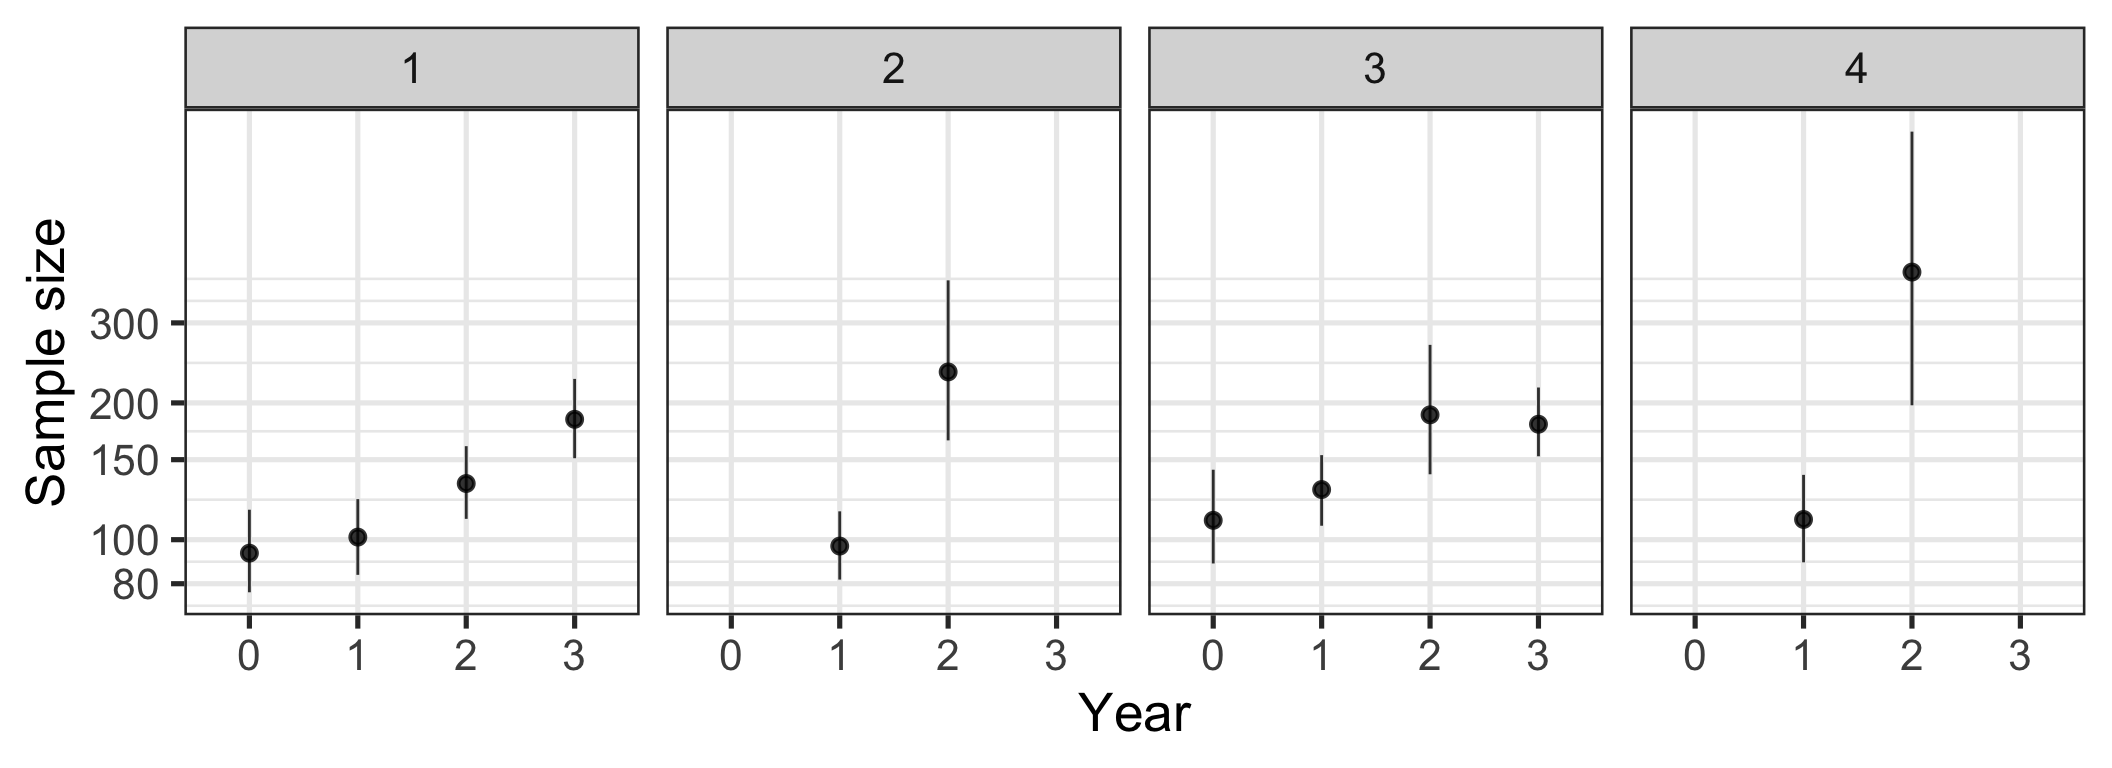
Figure 4: Change in sample size over time by journal. Sample sizes were logarithmised with base 10. Bootstrapped means and 95% CIs.
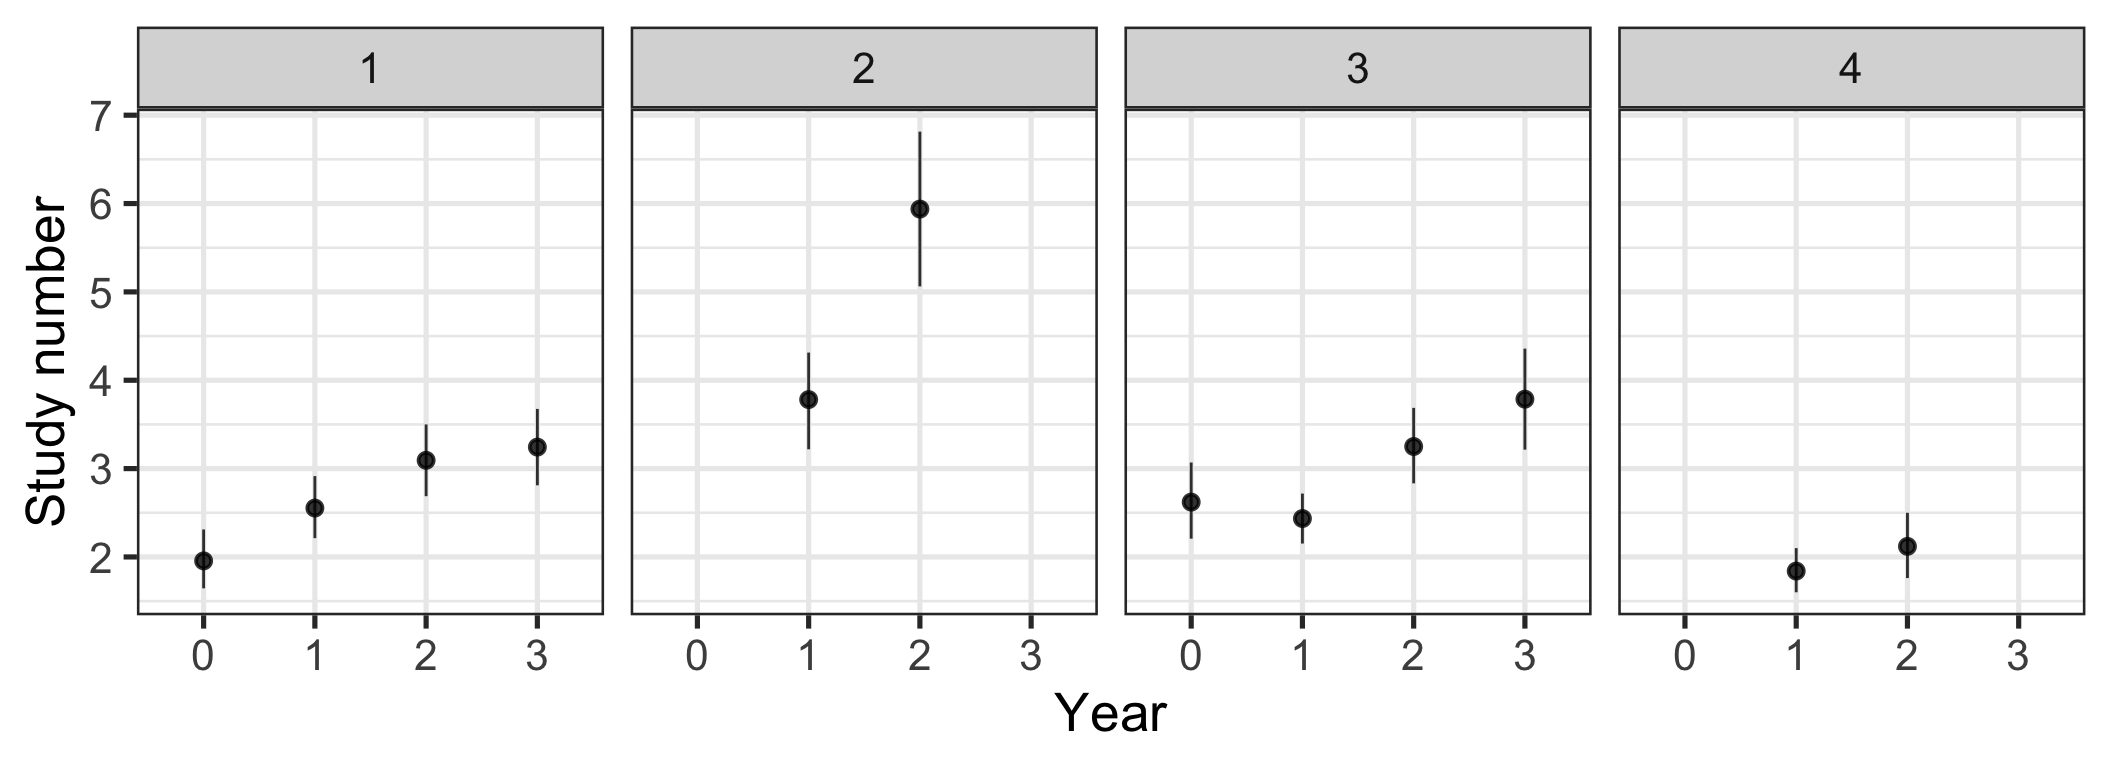
Figure 5: Change in number of studies per article over time by journal. Bootstrapped means and 95% CIs.
Did submitters or editors and reviewers change their behaviour?
- The authors frame their results as evidence of changes in the behaviour of research teams. Arguably, science reform is mediated in many places by editors and reviewers. Maybe just as many small-sample studies are being done, but they do not get published in these journals. To begin to answer this question, it is interesting to see (emphasis on see, below) how the different outcome measures associate. The authors should discuss this question more explicitly and discuss the correlations. Can they be used to make the case that researchers in the same team trade off sample size for self-report? Or are we seeing an increase in self-report measures only among online (Mturk?) researchers, while other researchers independently increase their sample sizes without changing their methods?
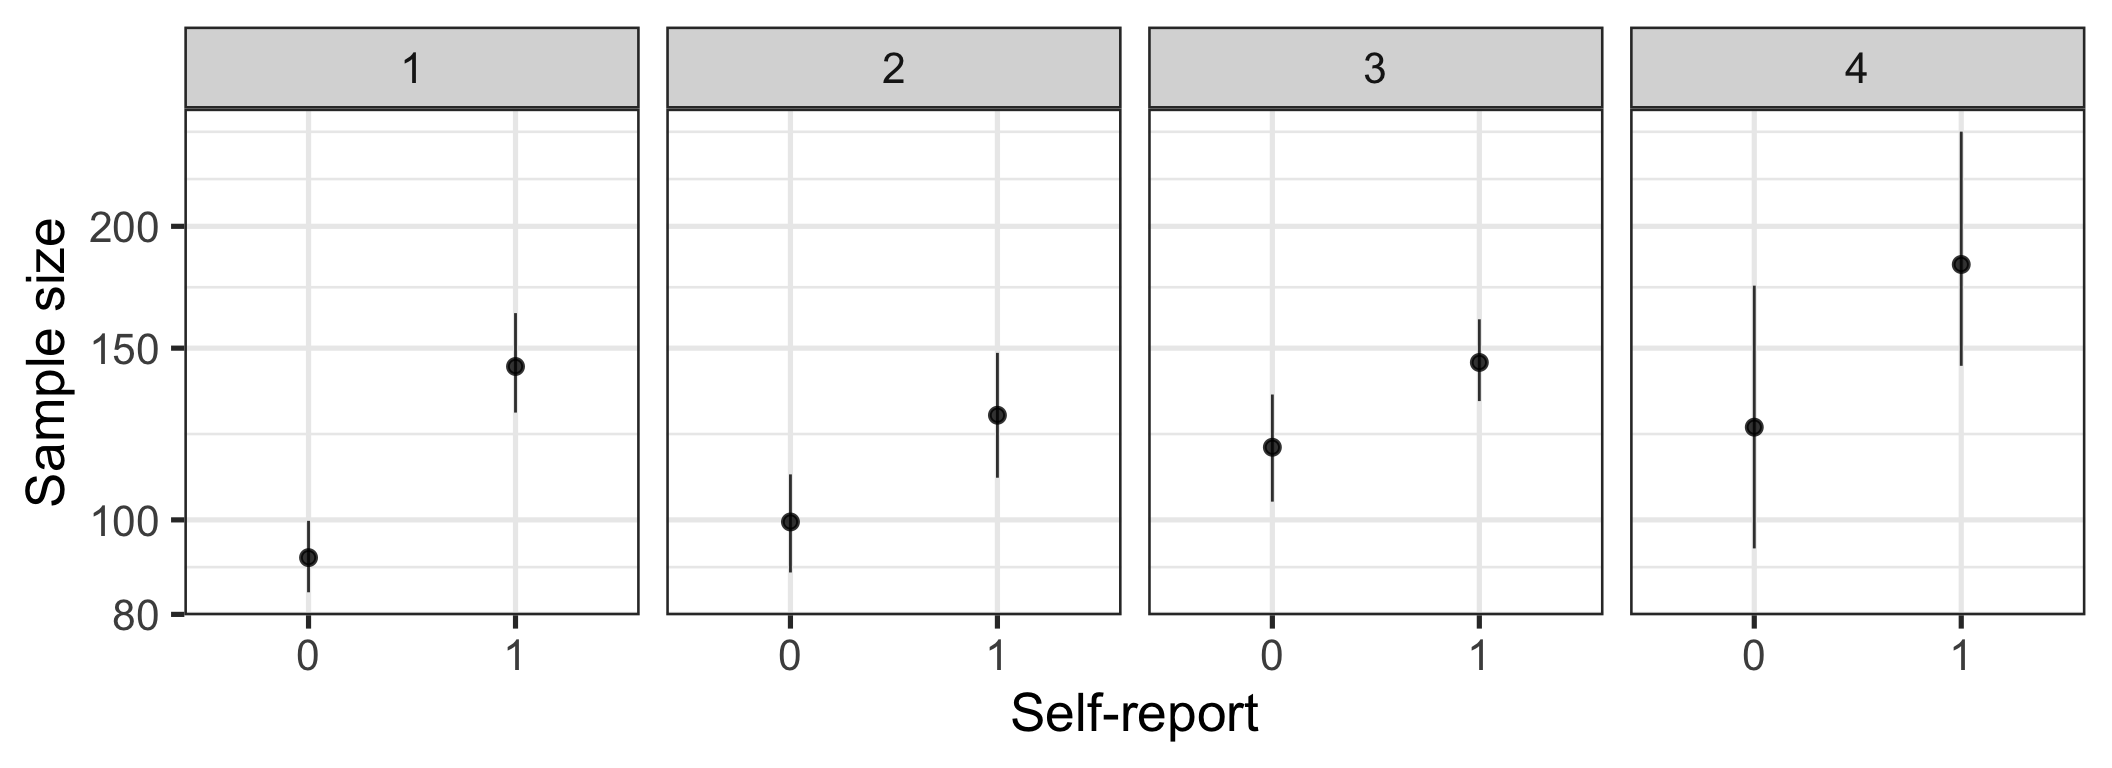
Figure 6: Sample size by self-report. Bootstrapped means and 95% CIs.
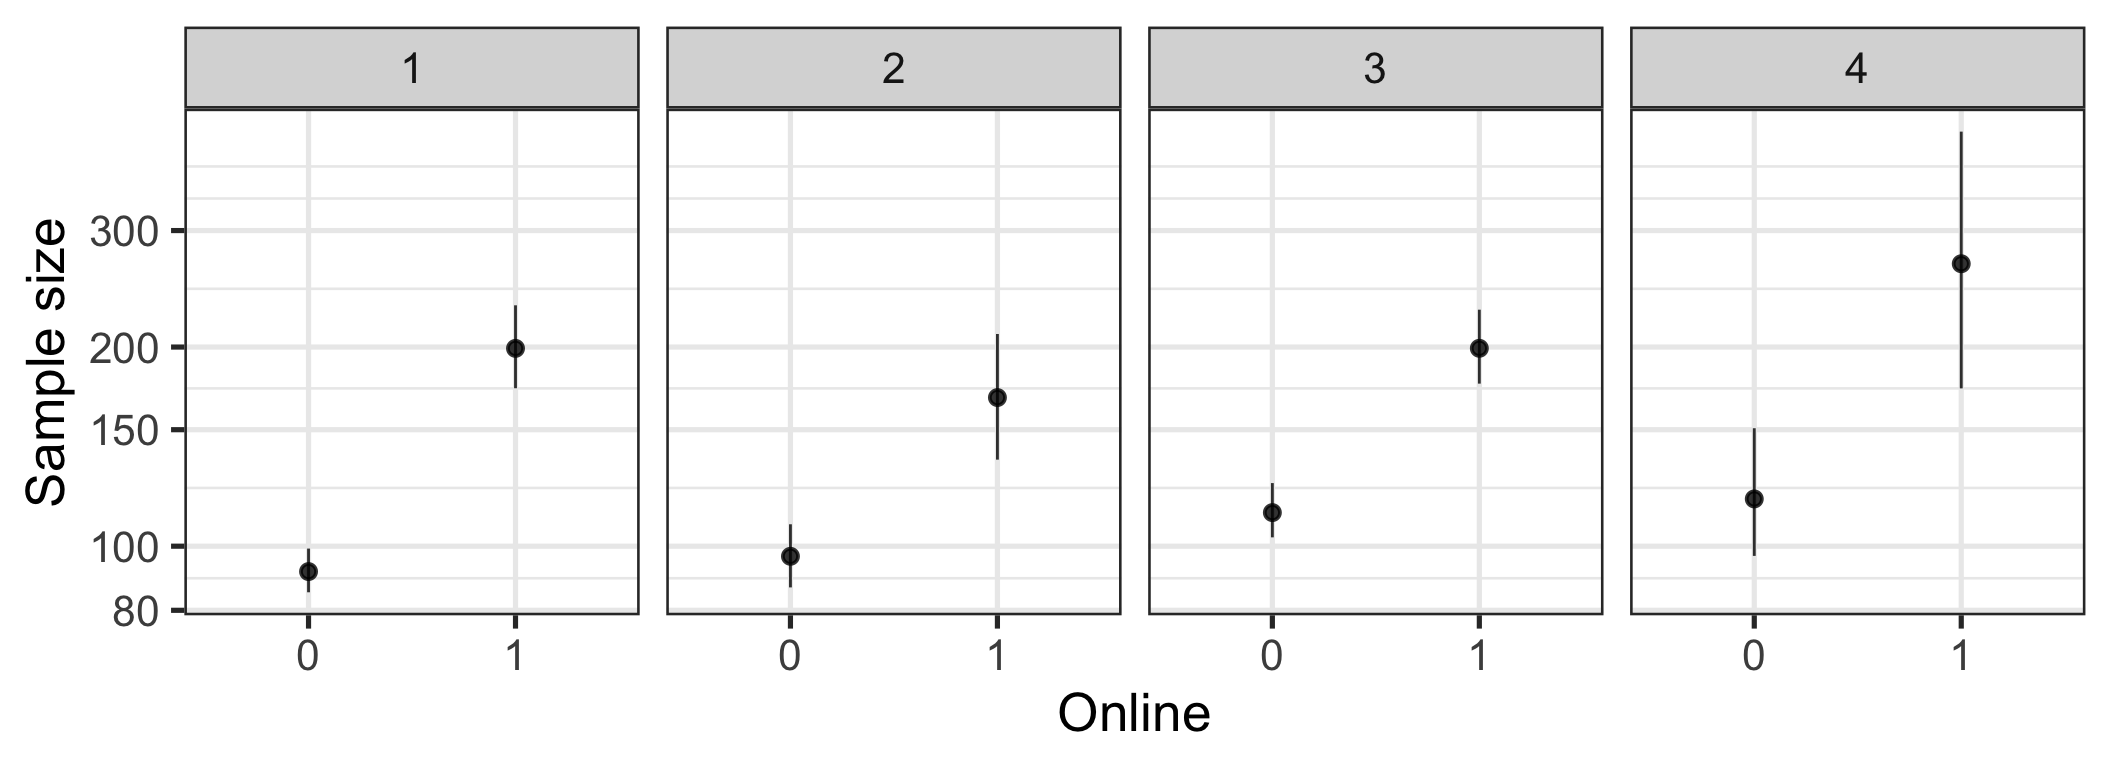
Figure 7: Sample size by online. Bootstrapped means and 95% CIs.
Bibliographic data
- The published data does not contain bibliographic information on the papers. This makes it impossible to check the accuracy of codings, to re-use and extend the data (by, for example, looking up DOIs and fetching citation counts in a few years). If the authors did this to preserve researcher anonymity, I want to strongly argue that this is misguided when it comes to published literature.
Causal inference
- The researchers give the standard disclaimer that they have examined only correlations. This would become more vivid if they discussed other known time trends that could confound their results, such as the rise of Mturk. They could also discuss ways in which a stronger causal inference would be possible. Are there subdisciplines akin to social psychology in their use of small samples that were not hit by the reform calls as early (developmental, evolutionary?) which we might examine additionally? Is the question important enough that we should advocate for large-scale experimentation with journal policies?
Minor points
- The authors say that their analysis explains 31% of the variance in the online variable. This is a dichotomous variable, so you cannot report an R2. Same for self-report. Please run logistic regressions and report pseudo R2s (if you must).
- I took the liberty of generating a human- and machine-readable codebook for the data, see below.
Summary
Given the presented data, I am not convinced that the researchers have shown that calls for increased rigour in terms of sample size have led to decreased rigour in measurement. To get a fuller sense of valid information, it would also have been interesting to look at other measures of rigour, such as the number of items, reliability, and whether the measure was ad-hoc. This cannot be done with the existing data. What the authors can do, is to fully present the data they have collected, including data on other measurement methods. As a final note, I am not aware that many voices in the reform movement called for more studies per article, yet we see this trend. This might serve as a vivid example that there are always many things going on simultaneously when just examining trends over time.
Codebook
Metadata
Description
Dataset name: Research in social psychology changed
The dataset has N=1300 rows and 6 columns. 458 rows have no missing values on any column.
Metadata for search engines
- Date published: 2021-03-04
|
Codebook table
JSON-LD metadata
The following JSON-LD can be found by search engines, if you share this codebook publicly on the web.
{
  "name": "Research in social psychology changed",
  "datePublished": "2021-03-04",
  "description": "The dataset has N=1300 rows and 6 columns.\n458 rows have no missing values on any column.\n\n\n## Table of variables\nThis table contains variable names, labels, and number of missing values.\nSee the complete codebook for more.\n\n|name     |label                                  | n_missing|\n|:--------|:--------------------------------------|---------:|\n|paperID  |unique paper identifier                |         0|\n|Journal  |journal in which article was published |         0|\n|Jahr     |year of publication                    |         0|\n|Studynum |number of studies per paper            |       842|\n|Sample   |sample size                            |         0|\n|online   |online data connection                 |         0|\n\n### Note\nThis dataset was automatically described using the [codebook R package](https://rubenarslan.github.io/codebook/) (version 0.9.2).",
  "keywords": ["paperID", "Journal", "Jahr", "Studynum", "Sample", "online"],
  "@context": "http://schema.org/",
  "@type": "Dataset",
  "variableMeasured": [
    {
      "name": "paperID",
      "description": "unique paper identifier",
      "@type": "propertyValue"
    },
    {
      "name": "Journal",
      "description": "journal in which article was published",
      "value": "1. JESP,\n2. JPSP,\n3. PSPB,\n4. SPPS",
      "maxValue": 4,
      "minValue": 1,
      "@type": "propertyValue"
    },
    {
      "name": "Jahr",
      "description": "year of publication",
      "value": "0. 2009,\n1. 2011,\n2. 2016,\n3. 2018",
      "maxValue": 3,
      "minValue": 0,
      "@type": "propertyValue"
    },
    {
      "name": "Studynum",
      "description": "number of studies per paper",
      "@type": "propertyValue"
    },
    {
      "name": "Sample",
      "description": "sample size",
      "@type": "propertyValue"
    },
    {
      "name": "online",
      "description": "online data connection",
      "value": "0. no,\n1. yes",
      "maxValue": 1,
      "minValue": 0,
      "@type": "propertyValue"
    }
  ]
}`It seems easier to change standards at journals than to decrease publication pressure and competititon throughout academia.↩︎