Paternal age effects on offspring fitness in four populations

Main result

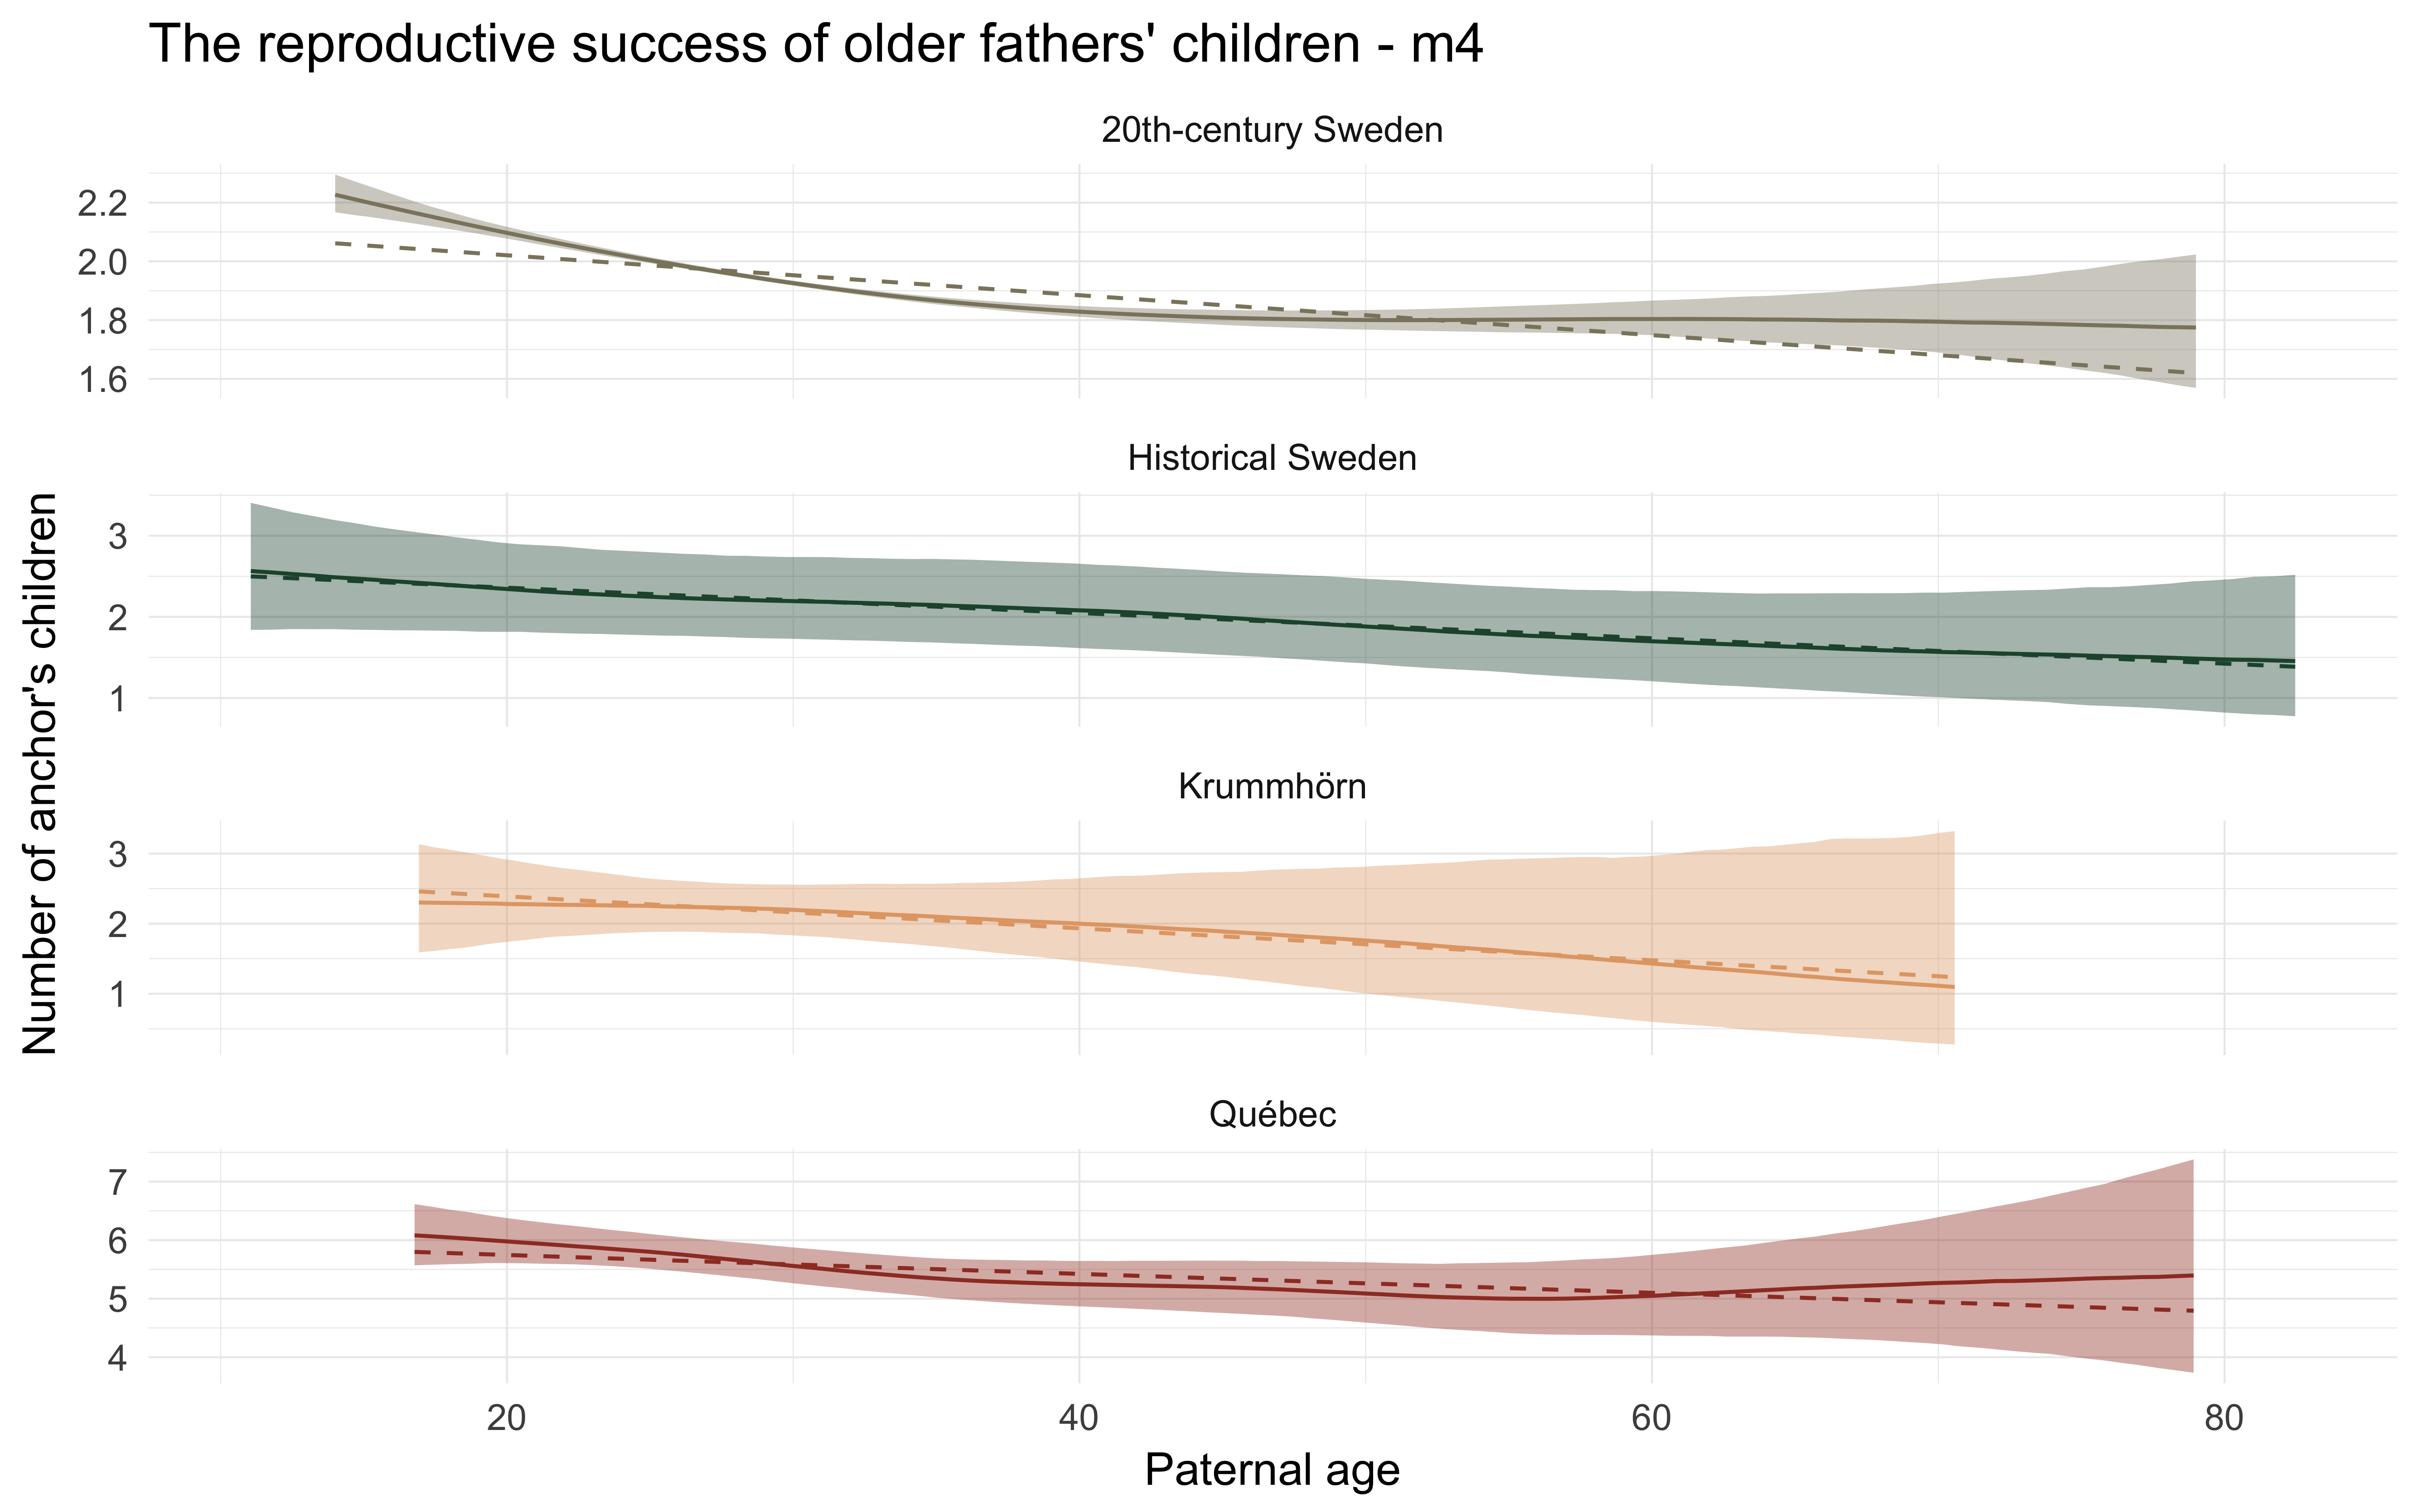
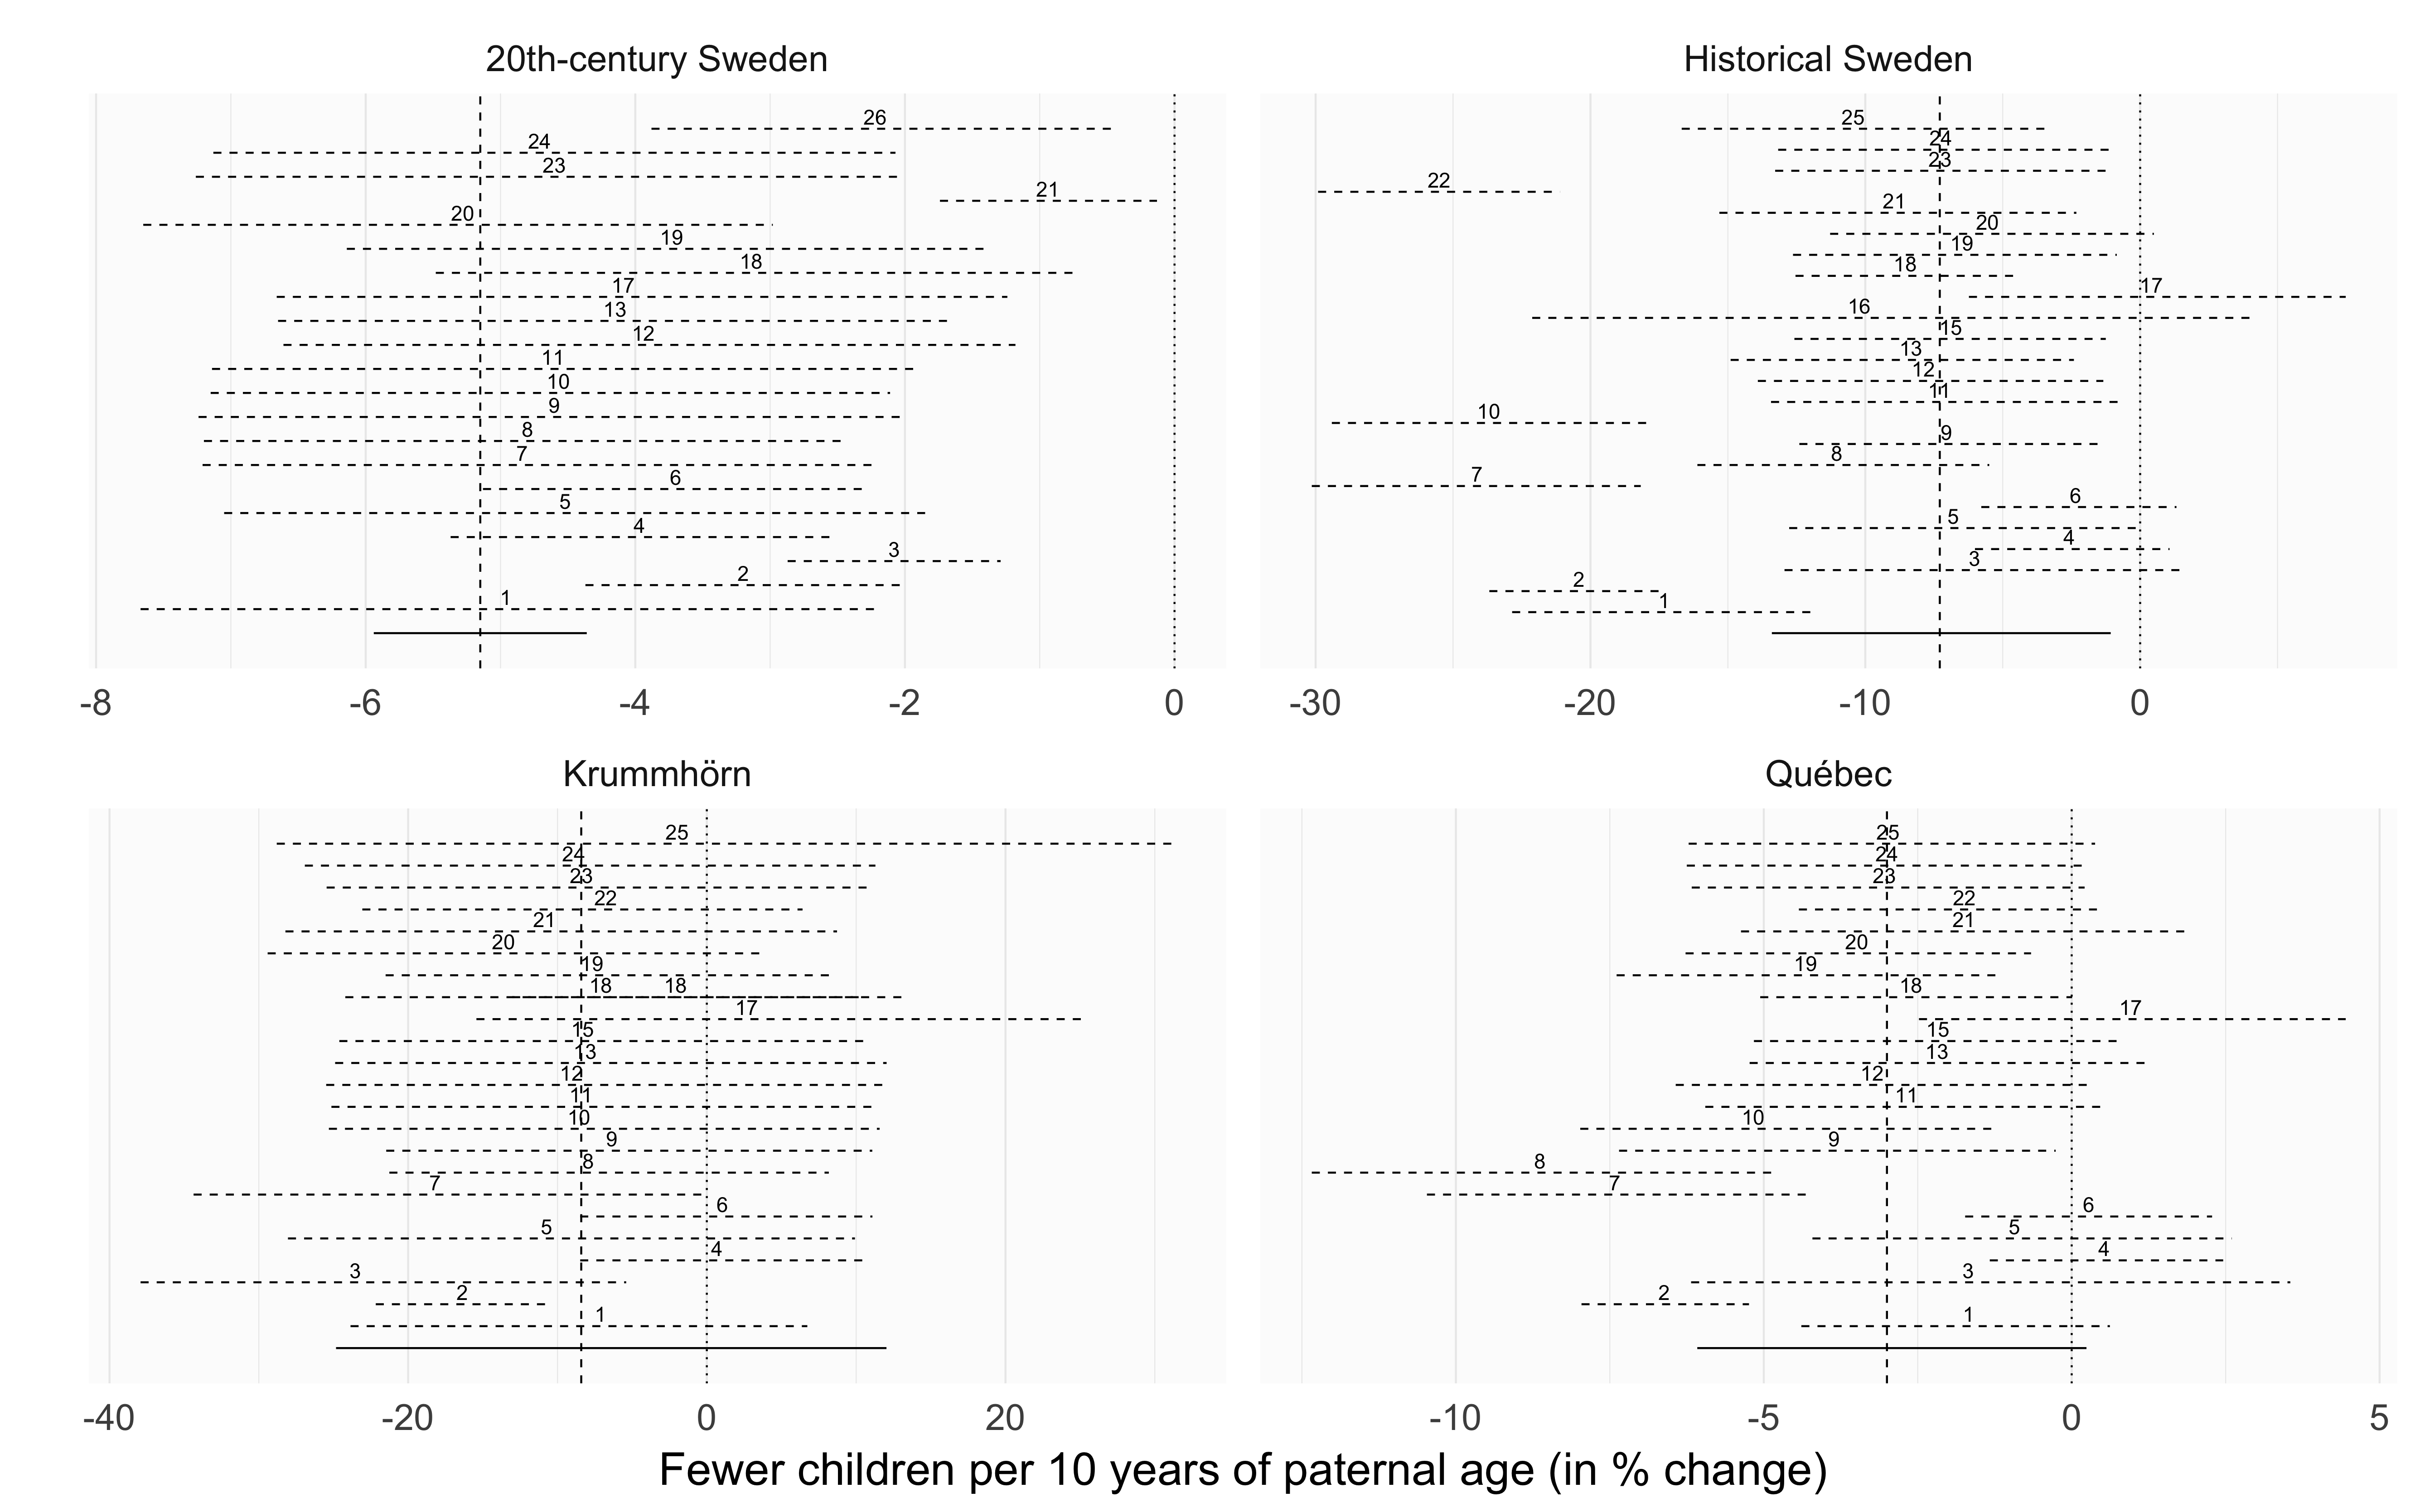
Paternal age effect in a sibling comparison design, adjusting for average paternal age, maternal age, number of siblings, number of older siblings, being last born, birth cohort, and parental loss.

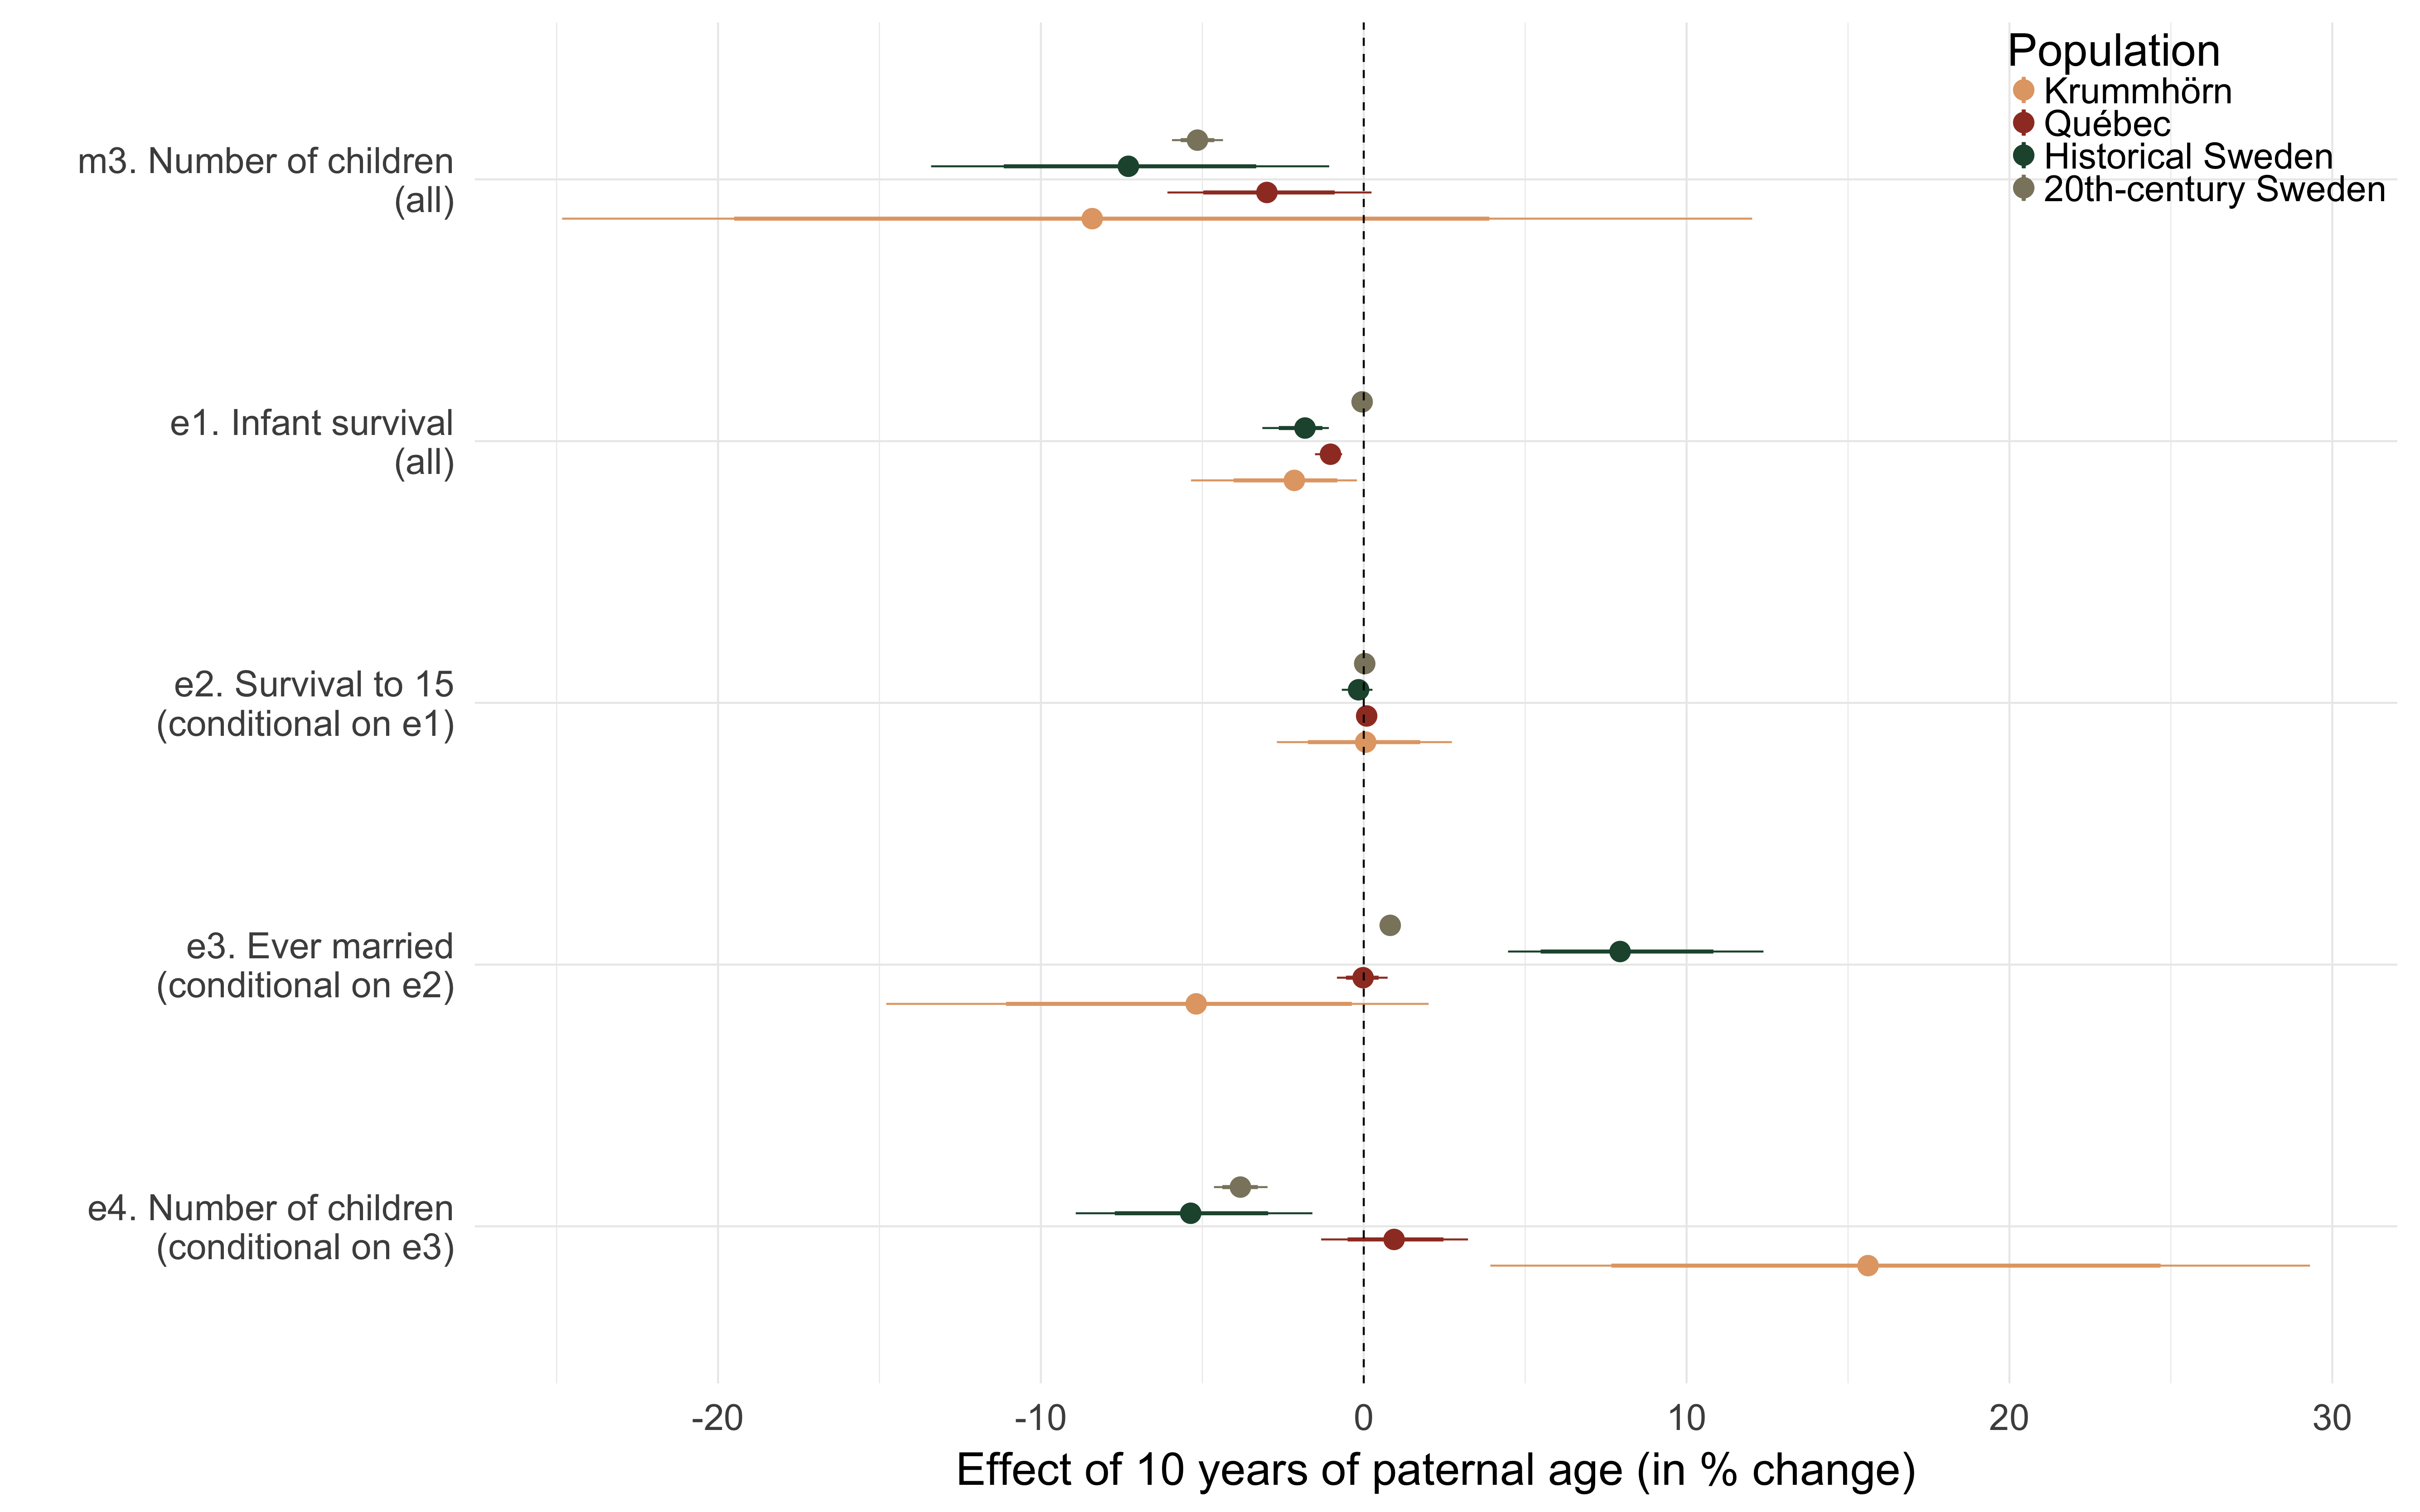
We find that the children of older fathers consistently have fewer childrens in all four populations, when compared to their siblings.

Main model results

Reproductive timing

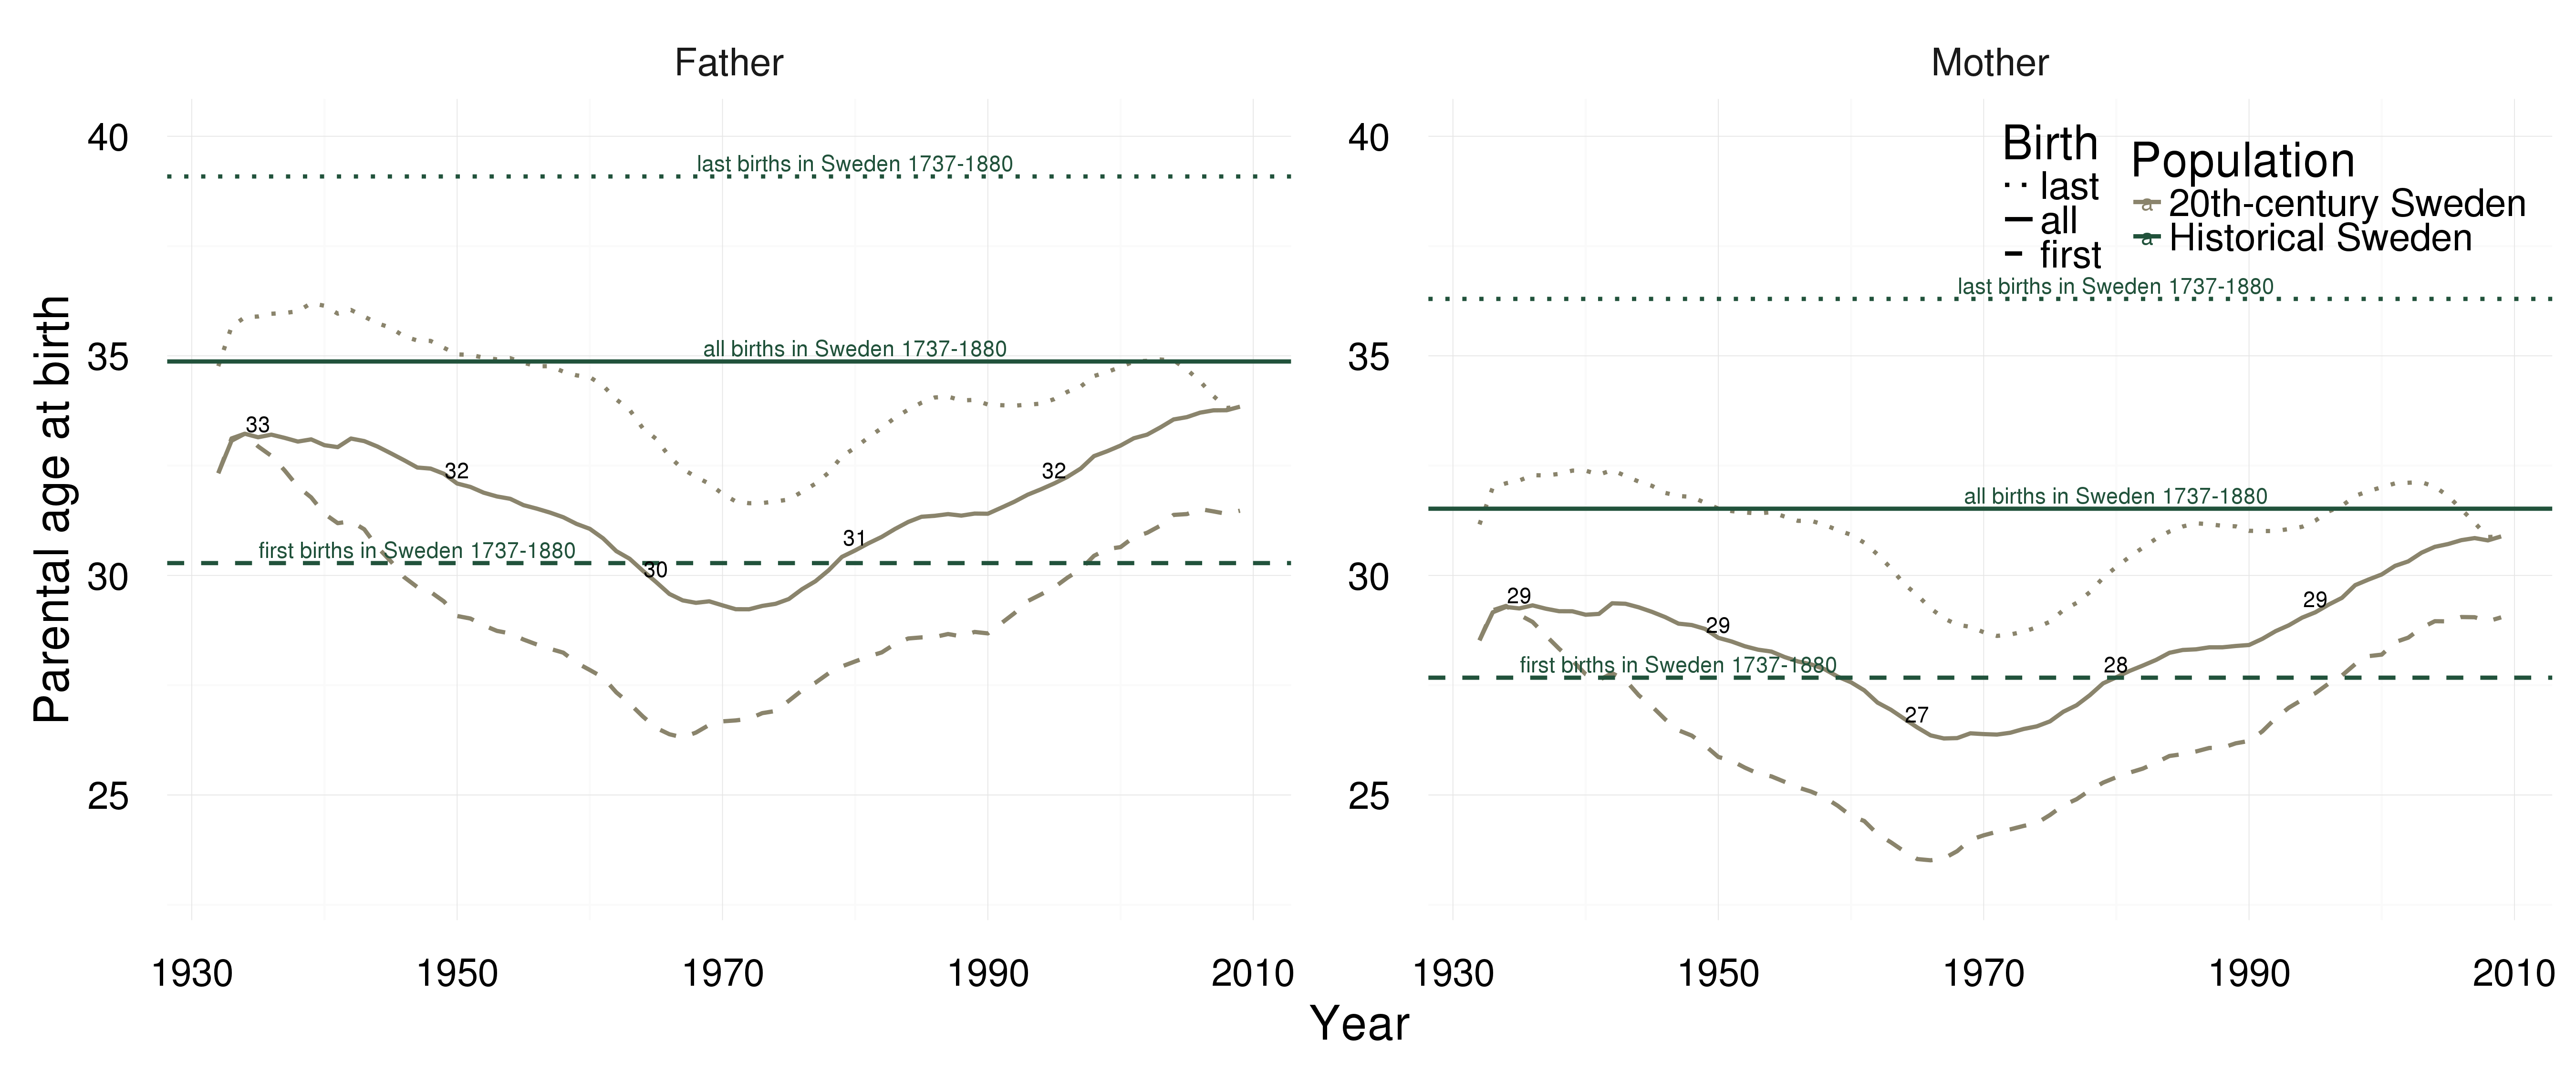
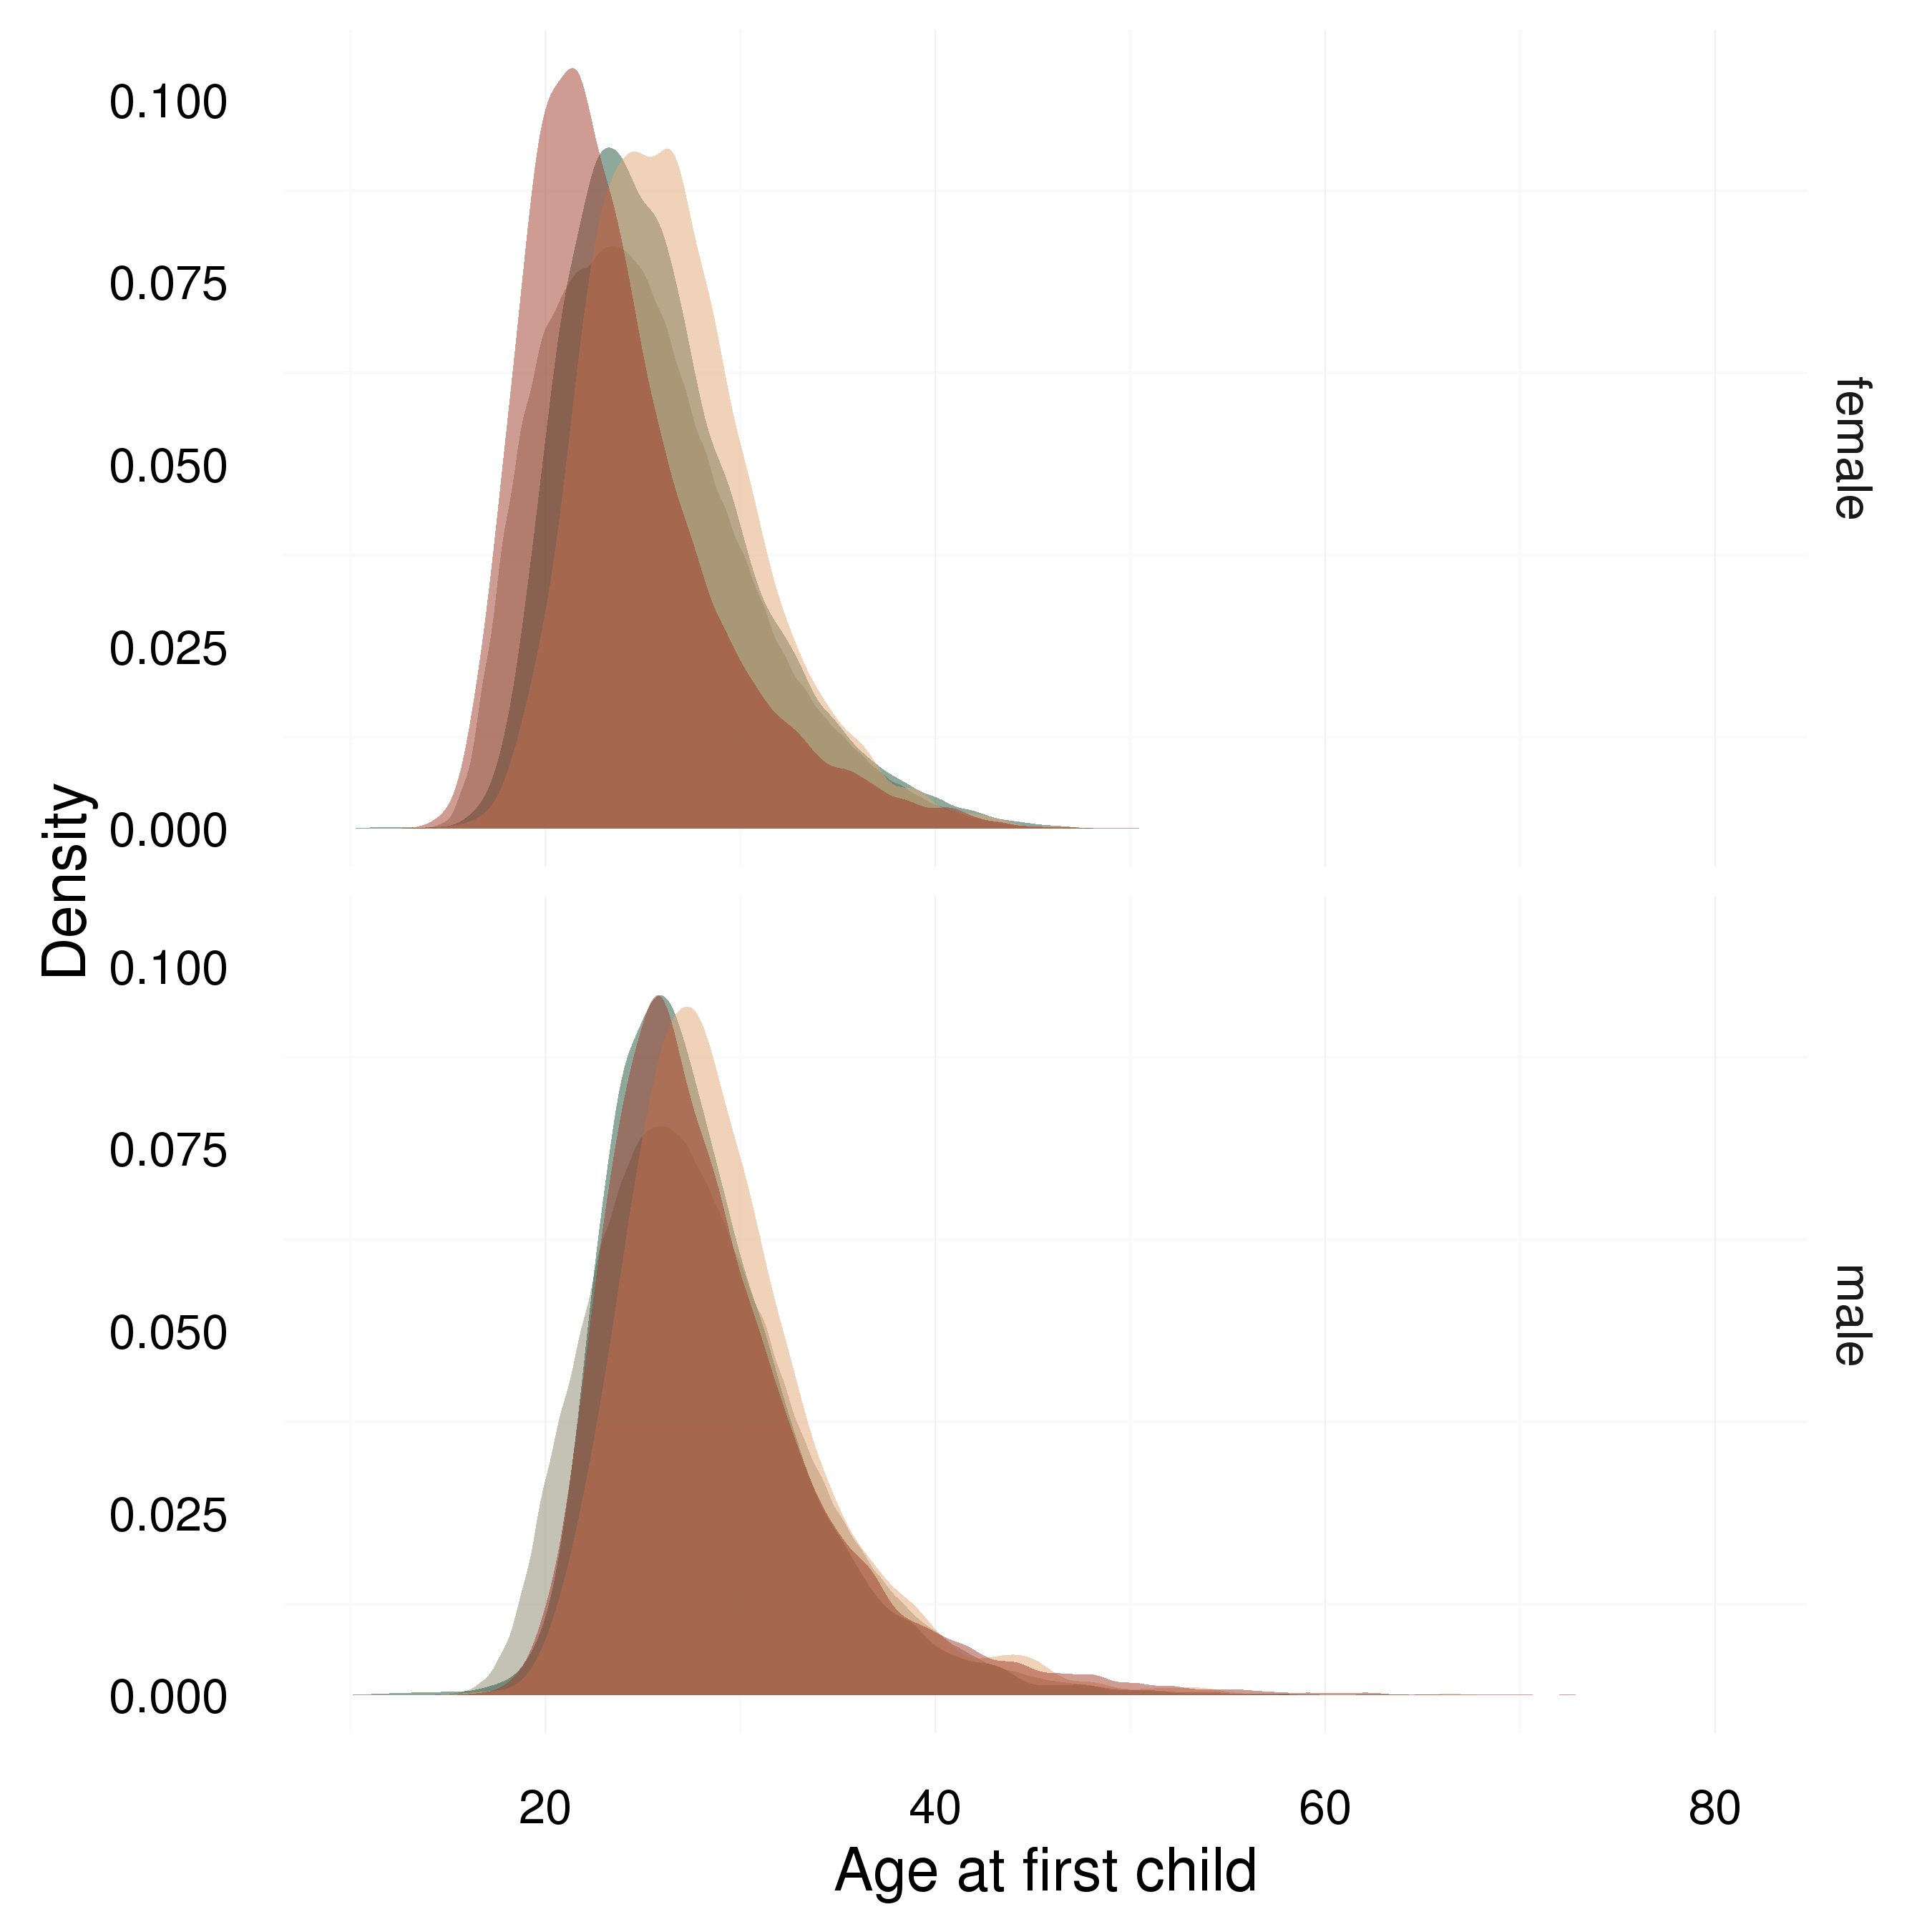
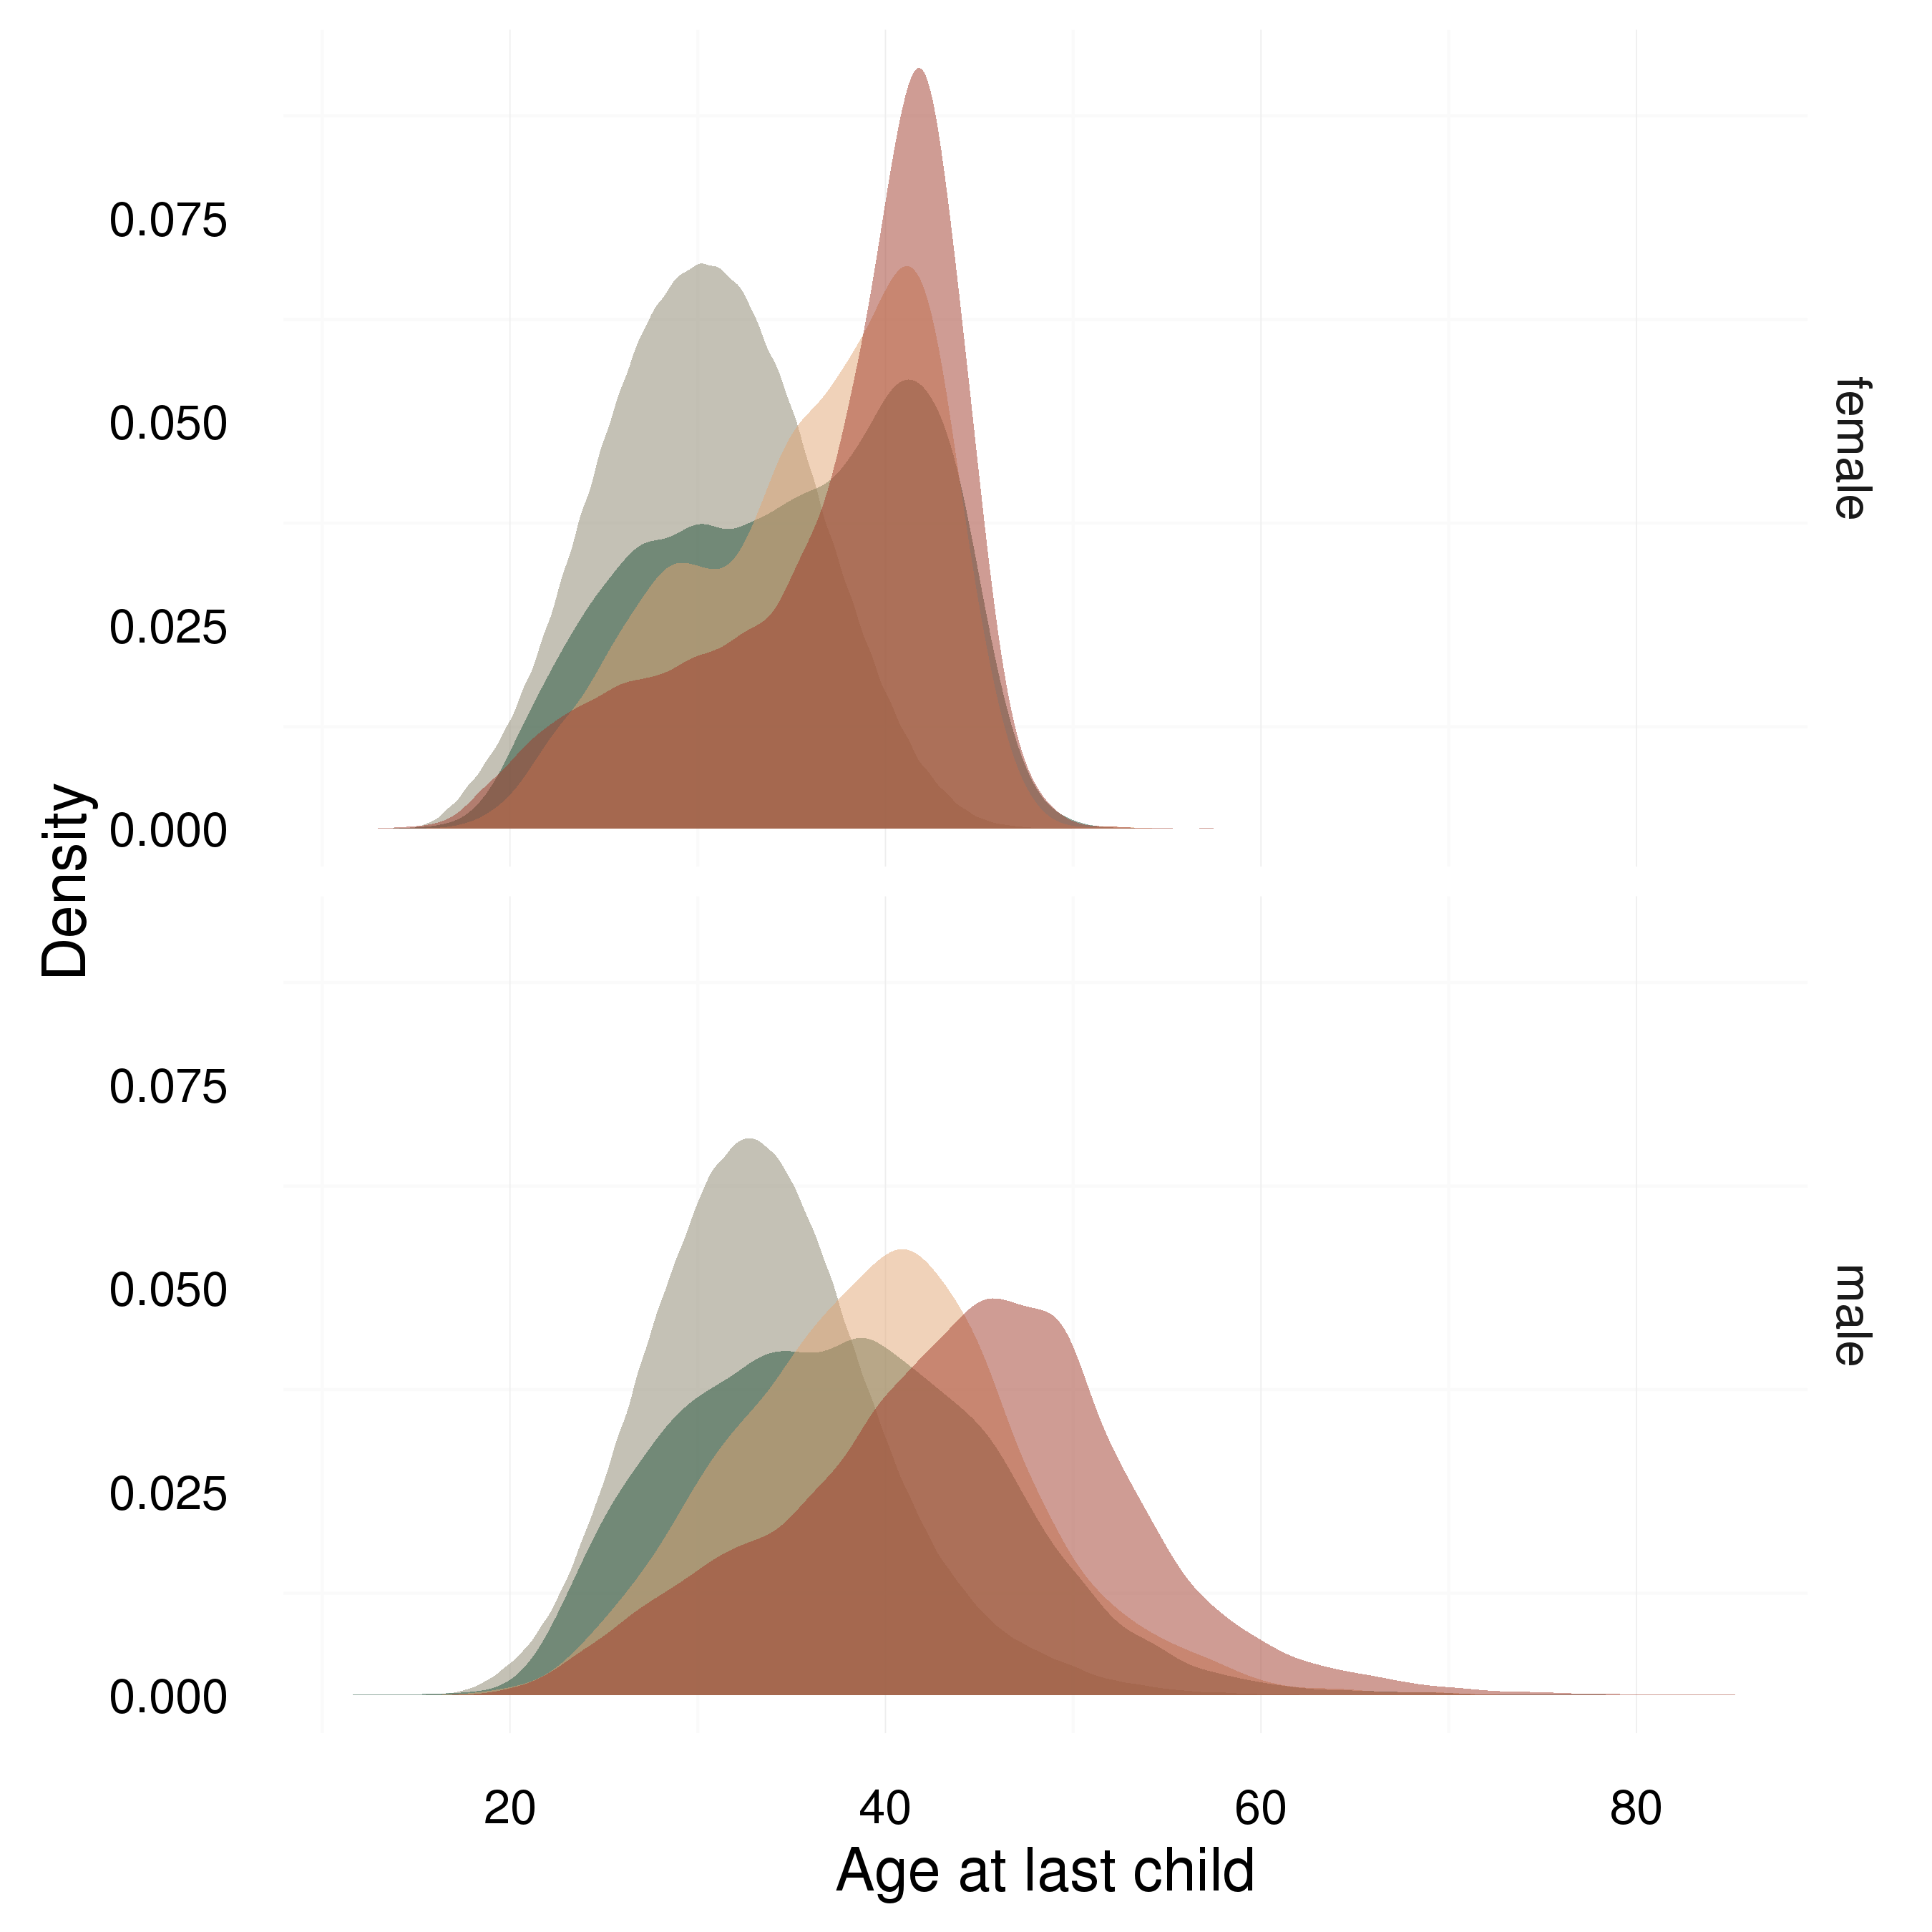
Much reporting on increasing parental ages tends to focus on ages at first birth (dashed lines) and hence seems at times unduly alarmist. Parental ages at all births (solid lines) show an increase since 1970 too, but are still lower than in the four Swedish regions of our historical Swedish data (1737-1880). The biggest difference is in fact not the slight delay of age at first birth in modern Sweden, but the much earlier reproductive stoppage (ages at last birth, dotted lines).

Hence, contrary to many people’s intutitions, in modern Sweden (1947-1959, gray) the average child was born to a younger parent than in our pre-industrial populations (1737-1880, green). This is mostly because people stopped having children earlier and to a lesser degree because people started having children ca. 1 year earlier. In contemporary Sweden (2010), the average parental age for both mothers and fathers is still lower than in our historical Swedish data.

In the below plot, we have compared all four populations ages at first and last births. The data for modern Sweden focuses on children born 1947 to 1959. Especially, mothers’ ages at last births stand out: In all historical datasets, it was still common for mothers to reproduce beyond the age of 40, reproductive stoppage for both men and women occurs much earlier in modern Sweden. Further descriptive comparisons on reproductive timing and other parameters.

Comparisons

Descriptives

Comparison of descriptives across populations.

Main models

Comparison of the main models across populations.

Selective episodes

Comparison of the selective episode models across populations. Selective episode comparison

Robustness

Comparison of the results of robustness checks in different populations. Robustness check comparison

Plausibility checks

How do the obtained effect sizes on number of children compare to estimates of genome-wide deleterious mutation rate times the mean selection coefficient against a deleterious heterozygous mutation (Hayward et al., 2015) and how to the effect sizes on infant survival compare to calculations of the mutation-attributable effect size computed in Gratten et al. (2016).

Helpers

In this document, all Helper functions functions that are used throughout, are documented.

This make file was used to generate this website (some code was run manually on the cluster).

The statistical models using brms were documented in a standardised fashion, this is documented here, model summary.

The main model reports, selective episode reports, main model reports were also generated in a standardised fashion.

Authors & Acknowledgements

Corresponding author: Ruben C. Arslan, Georg August University Göttingen
Kai P. Willführ, Emma M. Frans, Karin J. H. Verweij, Paul-Christian Bürkner, Mikko Myrskylä, Eckart Voland, Catarina Almqvist, Brendan Zietsch, & Lars Penke

This supplementary website has been archived on Zenodo.org DOI.

RCA thanks Holger Sennhenn-Reulen, Jarrod Hadfield, author of MCMCglmm, and Ben Bolker, co-author of lme4, for their statistical advice.

License

Creative Commons License
This work is licensed under a Creative Commons Attribution 4.0 International License.

Image credits
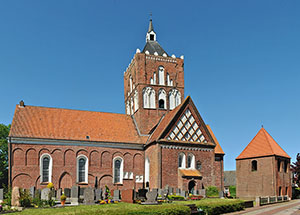
Kreuzkirche Pilsum, Krummhörn

Pilsumer Kirche 2010.jpg
Pilsumer Kirche 2010“ von kaʁstn Disk/Cat - Eigenes Werk. Lizenziert unter CC BY-SA 3.0 de über Wikimedia Commons.

Basilica of Sainte-Anne-de-Beaupré, Québec

Church of Sainte Anne de Beaupre.jpg
Church of Sainte Anne de Beaupre” by Detroit Publishing - http://hdl.loc.gov/loc.pnp/ppmsca.18107. Licensed under Public Domain via Wikimedia Commons.

Skellefteå landsförsamlings kyrka, Sweden

Skellefteå landsförsamlings kyrka (2010).
Skelleftea landskyrka main view” av Xauxa Håkan Svensson - Eget arbete. Licensierad under CC BY-SA 3.0 via Wikimedia Commons.

Statistics Sweden, Statistiska centralbyrån, Örebro Office, Sweden

SCB Örebro
SCB Örebro” by Edaen. Licensed under CC BY 3.0 via Wikimedia Commons.

Package bibliography
Session info (with package versions)
library(brms, warn.conflicts = F, quietly = T)
library(bayesplot, warn.conflicts = F, quietly = T)
## This is bayesplot version 1.2.0
sessionInfo()
## R version 3.3.2 (2016-10-31)
## Platform: x86_64-apple-darwin13.4.0 (64-bit)
## Running under: OS X El Capitan 10.11.6
## 
## locale:
## [1] en_US.UTF-8/en_US.UTF-8/en_US.UTF-8/C/en_US.UTF-8/en_US.UTF-8
## 
## attached base packages:
## [1] stats     graphics  grDevices utils     datasets  methods   base     
## 
## other attached packages:
##  [1] bayesplot_1.2.0  brms_1.7.0       Rcpp_0.12.9      pander_0.6.0    
##  [5] broom_0.4.1.9000 dtplyr_0.0.1     dplyr_0.5.0      data.table_1.9.6
##  [9] knitr_1.16       plyr_1.8.4       reshape2_1.4.2   stringi_1.1.2   
## [13] stringr_1.1.0    lubridate_1.6.0  formr_0.4.2      QuantPsyc_1.5   
## [17] MASS_7.3-45      boot_1.3-18      psych_1.6.9      car_2.1-3       
## [21] Hmisc_4.0-0      ggplot2_2.2.1    Formula_1.2-1    survival_2.40-1 
## [25] lattice_0.20-34  foreign_0.8-67   formatR_1.4      rmarkdown_1.2   
## 
## loaded via a namespace (and not attached):
##  [1] tidyr_0.6.0          assertthat_0.1       rprojroot_1.1       
##  [4] digest_0.6.11        packrat_0.4.8-1      R6_2.2.0            
##  [7] chron_2.3-47         backports_1.0.4      acepack_1.4.1       
## [10] MatrixModels_0.4-1   stats4_3.3.2         coda_0.19-1         
## [13] evaluate_0.10        lazyeval_0.2.0       minqa_1.2.4         
## [16] SparseM_1.74         nloptr_1.0.4         rpart_4.1-10        
## [19] Matrix_1.2-7.1       labeling_0.3         splines_3.3.2       
## [22] lme4_1.1-12          loo_1.1.0            munsell_0.4.3       
## [25] rstan_2.15.1         mnormt_1.5-5         mgcv_1.8-16         
## [28] rstantools_1.2.0     htmltools_0.3.5      nnet_7.3-12         
## [31] tibble_1.2           gridExtra_2.2.1      htmlTable_1.7       
## [34] matrixStats_0.51.0   grid_3.3.2           nlme_3.1-128        
## [37] gtable_0.2.0         DBI_0.5-1            magrittr_1.5        
## [40] StanHeaders_2.15.0-1 scales_0.4.1         latticeExtra_0.6-28 
## [43] RColorBrewer_1.1-2   tools_3.3.2          abind_1.4-5         
## [46] parallel_3.3.2       pbkrtest_0.4-6       yaml_2.1.14         
## [49] inline_0.3.14        colorspace_1.3-2     cluster_2.0.5       
## [52] quantreg_5.29
References

1. Bürkner, P.-C. in press brms: An R package for bayesian multilevel models using stan. Journal of Statistical Software

2. Hadfield, J. D. 2010 MCMC methods for multi-response generalized linear mixed models: The MCMCglmm R package. Journal of Statistical Software 33, 1–22.

3. Bates, D., Mächler, M., Bolker, B. & Walker, S. 2015 Fitting linear mixed-effects models using lme4. Journal of Statistical Software 67, 1–48. (doi:10.18637/jss.v067.i01)

4. Allaire, J., Cheng, J., Xie, Y., McPherson, J., Chang, W., Allen, J., Wickham, H., Atkins, A. & Hyndman, R. 2016 Rmarkdown: Dynamic documents for r.

5. Xie, Y. 2016 FormatR: Format r code automatically.

6. R Core Team 2016 Foreign: Read data stored by minitab, s, sas, spss, stata, systat, weka, dBase, .

7. Harrell Jr, F. E., Charles Dupont & others. 2016 Hmisc: Harrell miscellaneous.

8. Fox, J. & Weisberg, S. 2011 An R companion to applied regression. Second. Thousand Oaks CA: Sage.

9. Revelle, W. 2016 Psych: Procedures for psychological, psychometric, and personality research. Evanston, Illinois: Northwestern University.

10. Fletcher, T. D. 2012 QuantPsyc: Quantitative psychology tools.

11. Arslan, R. 2014 Formr: Formr survey framework.

12. Wickham, H. 2009 Ggplot2: Elegant graphics for data analysis. Springer-Verlag New York.

13. Grolemund, G. & Wickham, H. 2011 Dates and times made easy with lubridate. Journal of Statistical Software 40, 1–25.

14. Wickham, H. 2016 Stringr: Simple, consistent wrappers for common string operations.

15. Gagolewski, M. & Tartanus, B. 2016 R package stringi: Character string processing facilities.

16. Wickham, H. 2007 Reshaping data with the reshape package. Journal of Statistical Software 21, 1–20.

17. Wickham, H. 2011 The split-apply-combine strategy for data analysis. Journal of Statistical Software 40, 1–29.

18. Xie, Y. 2016 Knitr: A general-purpose package for dynamic report generation in r.

19. Dowle, M., Srinivasan, A., Short, T., R Saporta, S. L. with contributions from & Antonyan, E. 2015 Data.table: Extension of data.frame.

20. Wickham, H. & Francois, R. 2016 Dplyr: A grammar of data manipulation.

21. Wickham, H. 2016 Dtplyr: Data table back-end for ’dplyr’.

22. Robinson, D. 2016 Broom: Convert statistical analysis objects into tidy data frames.

23. Daróczi, G. & Tsegelskyi, R. 2015 Pander: An r pandoc writer.

24. Xie, Y. 2016 DT: A wrapper of the javascript library ’datatables’.

25. Gabry, J. 2016 Bayesplot: Plotting for bayesian models.